
Abstract
Much of our understanding of the course and outcome of mental disorders is derived from clinic-based research. However, most people who suffer from a mental disorder may never seek clinical help and, until recently, less was known about the incidence and prognosis of mental disorders within the broader community.
Over the past decade, a number of large populationbased studies have been undertaken within the US and Europe to improve our understanding of the prevalence and burden of mental disorders [1–3]. These crosssectional studies have often been based on the Composite International Diagnostic Interview (CIDI) [4]. In Australia, the Australian Bureau of Statistics took a similar approach in 1997 when it conducted the Survey of Mental Health and Wellbeing (SMHWB) in a random national sample of 10 600 community-based subjects [5].
These surveys suggest that the 12 month prevalence of any mental disorder in the general population is between approximately 18% [6] and 30% [1]. However, as the studies were cross-sectional in nature, many issues remain unresolved. These include the stability of mental health diagnoses in a population setting over time, the determinants of outcome and the incidence of new diagnoses in previously asymptomatic individuals.
Recently, questions of this nature have been the focus of a large, longitudinal study reported from the Netherlands [7, 8], which found significant changes in the mental health status of individuals over a 12 month period, and which has explored the factors associated with these changes.
Our study, the Northern Rivers Mental Health Study (NoRMHS), was similarly designed to explore changes in mental health status in a community-based sample over a 2 year period. We recruited a cohort designed to be representative of the rural Australian community. For comparability, NoRMHS used the same instruments as the SMHWB, allowing a better understanding of the long-term implications of the prevalences and comorbidities found in this national survey. However, unlike the SMHWB, it was not structured to provide information on the prevalence of mental disorders at a single point in time. Rather, these instruments were used to prospectively study changes in mental health status and their relationship to possible determinants such as helpseeking behaviour and life events. This paper outlines the study methods and the initial results of the NoRMHS.
Method
The NoRMHS was conducted in the Richmond Valley on the north coast of New South Wales, Australia. The study area comprised a population of approximately 100 000 adults living in a demographically diverse region including large coastal towns, the regional centre of Lismore and a large number of smaller rural and remote communities.
Instruments
The NoRMHS used the same instruments as the SMHWB to identify mental health diagnoses, and to measure disability, general health, psychological distress, sociodemographic variables, perceived health needs, help-seeking behaviour, neuroticism, health service utilization and other variables [5]. We also included a number of additional variables in NoRMHS to study the influence of potential determinants of mental health status. These included life events, physical activity, height, weight, social connectedness and smoking.
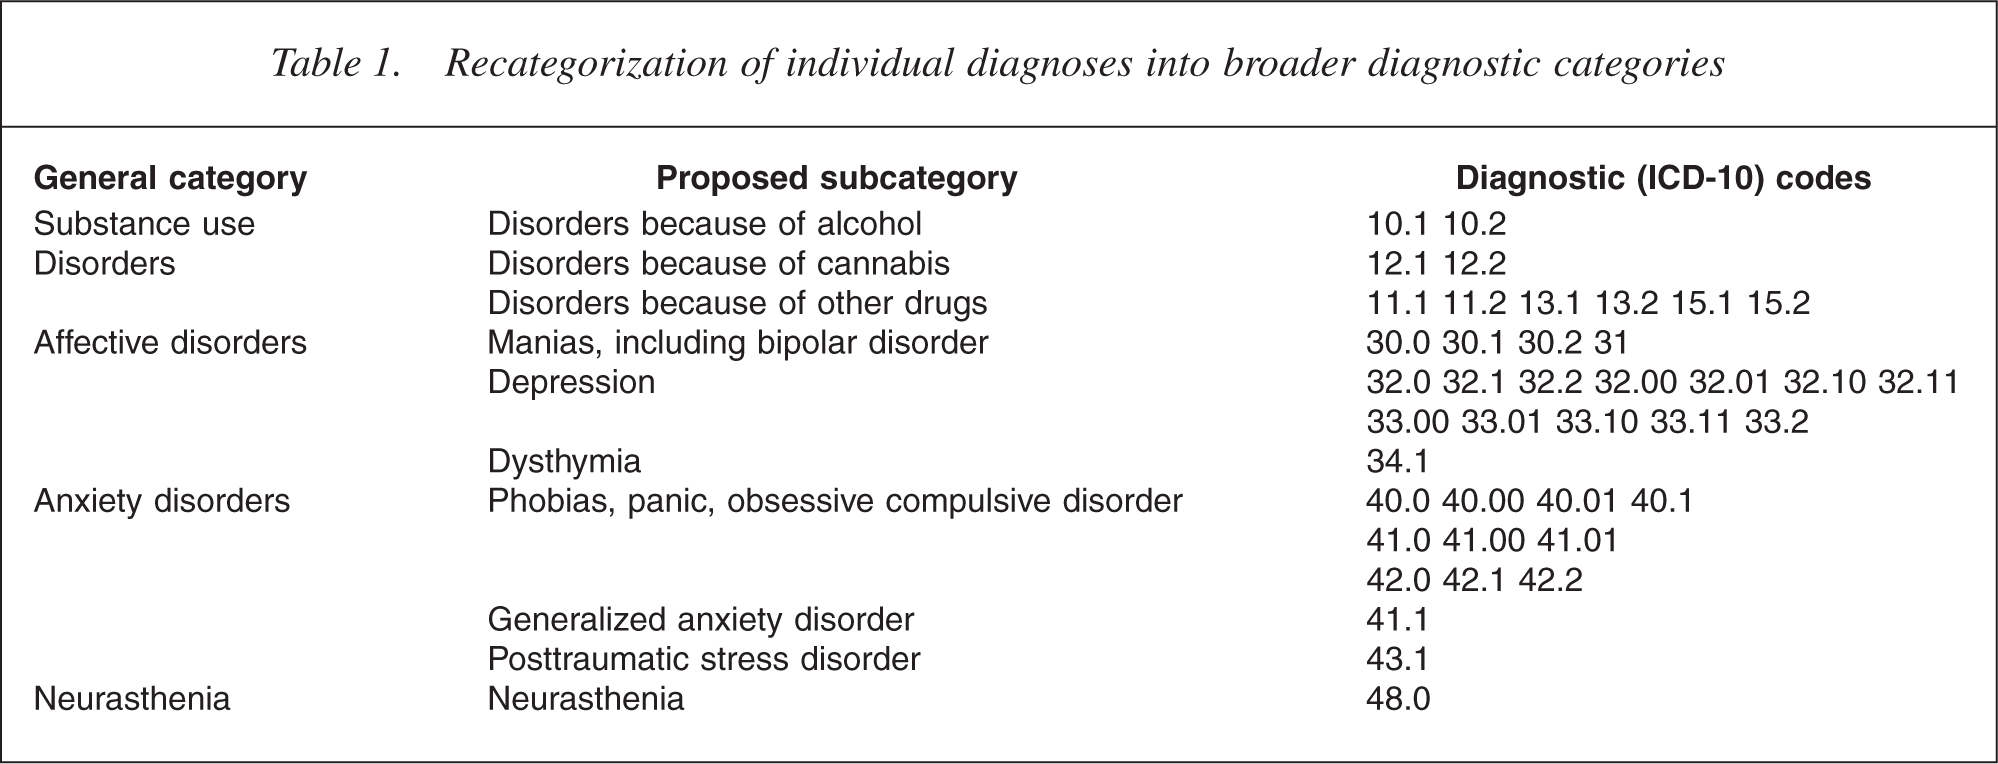
The core diagnostic instruments used in our study were the CIDI and the ‘MiniCIDI’. The CIDI was produced as part of a joint project between the World Health Organization and the United States Alcohol, Drug Abuse and Mental Health Administration in the 1980s [4], and provides a computer-aided diagnostic interview designed to be administered by lay interviewers that is widely used in epidemiological surveys. The instrument is widely used in epidemiological research [9], has excellent interrater reliability [10] and good test–retest reliability and validity [11]. While it has not been specifically designed for longitudinal research, it has been used as the diagnostic instrument in other recent large longitudinal studies [12]. The CIDI enables the diagnosis of mental disorders according to both the ICD-10 and DSM-IV classification schemes. For this paper, we assessed the same 40 ICD-10 diagnoses studied in the SMHWB and also adopted the approach of the national survey when regrouping these into broader diagnostic categories (Table 1).
Recategorization of individual diagnoses into broader diagnostic categories
The ‘MiniCIDI’ uses key ‘stem’ questions from the CIDI decision tree to identify individuals who may be more likely than others to attract positive CIDI diagnoses in a complete diagnostic interview. It was developed using data from the National Comorbidity Survey [1] to identify the probability of CIDI caseness from stem questions and was very similar to the CIDI Short Form which was one of the screening instruments most highly correlated with CIDI diagnosis [13]. The CIDI Short Form has been used in a number of epidemiological studies [14] and is thought to be useful in large-scale community surveys where more extensive psychiatric interviews are not feasible [15]. In our study, an individual scoring positive on the MiniCIDI was categorized as a ‘likely case’, while an individual scoring negative was classified as a ‘likely control’.
The sampling process
Even though mental disorders such as depression are relatively common, a randomly selected cohort would need to be very large to have the statistical power needed to answer our research questions. To ensure we had adequate power in a more manageable study, we increased the proportion of subjects with a mental disorder at baseline by drawing the cohort from a larger telephone survey.
In this screening phase, a random sample of approximately 9.2% of the adult population of the Richmond Valley was administered an interview by telephone which included the MiniCIDI and some basic questions on medical history and health service utilization. At the time the survey was conducted, around 95% of households in Australia had a fixed telephone connected [16].
A total of 15 021 telephone numbers were randomly selected during the screening period. Of these, 1456 were found to be business numbers and 1427 numbers did not answer. From the remaining 12 138 numbers, randomly selected adult members of households were invited to participate in a telephone interview, with 9205 interviews being completed. There were 2933 refusals. Fourteen respondents were aged less than 18 years and were later excluded resulting in 9191 interviews from 12 138 calls, a response rate of 75.8%. No demographic information was available for refusals.
All subjects identified as ‘likely cases’ during the screening and a random sample of the remaining subjects identified as ‘likely controls’ were invited to participate in later phases of the study. Consenting subjects were then administered a computer-aided face-to-face interview using the instruments described above. These were used to identify mental disorders among subjects based on ICD-10 using the standard scoring methods for the CIDI. Subjects interviewed at baseline were recontacted 2 years later and invited to participate in a second face-to-face interview using the same instruments and scoring. Baseline and follow-up data were entered into a single dataset and were analysed using SPSS for Windows Version 12.0.1 (SPSS Inc, Chicago, IL, US). Simple cross-tabulations were used to display the changes in mental health status over time. Subjects were then stratified by sex and screening category to estimate the incidence of new disorders in subjects who had previously been disorder-free.
It is important to note that the analysis in this paper has been simplified in order to maintain consistency with early reports of the national SMHWB. Therefore, diagnoses at baseline and follow-up do not take account of comorbidity. This means that subjects identified at a particular point with one disorder may also have one or more additional diagnoses. This needs to be considered when examining changes in subject diagnosis over time. The alternative of examining the subject's nominated main diagnosis was not possible because many subjects attributed physical diagnoses to their mental health symptomatology. Analysis of comorbidity patterns will be the subject of later papers.
Results
Of telephone-screening respondents aged 18 years and over, 5201 (56.6%) were female, while the underlying proportion of women among adults in the study area was 50.96%. For subjects over 34 years of age (except for the small population over 85 years), the sample was evenly distributed across all age groups (mean 10.01% of study population for each 10 years age group, range 9.3% to 11.2%). Subjects under 35 years of age were under-represented in the sample population (5.7% of study population).
Of subjects given a telephone interview, 1670 subjects (18.2%) were defined as ‘likely cases’. All likely cases and 963 ‘likely control’ subjects were asked to participate in a follow-up survey. A total of 1407 invited subjects completed face-to-face interviews at baseline (859 51.4% likely cases and 548 56.9% likely controls). Two years later, 1016 subjects were reinterviewed, with 968 reliably matched to baseline and 439 (189 men, 250 women) lost to follow up.
Impact of screening
The study used telephone screening with the MiniCIDI to boost the number of subjects with mental disorders in the study group. Comparison with the SMHWB rural subsample indicates screening resulted in a substantial increase in case prevalence for affective and anxiety disorders, but less for substance-use disorders (Table 2). The Mantel– Haenszel common odds ratios (homogeneous over 5 year age categories) and their 95% confidence intervals were: substance-use disorders male = 1.44 (1.10 − 1.88), female = 1.44 (1.06 − 1.96); affective disorders male = 3.12 (2.35 − 4.16), female = 2.39 (1.95 − 2.91); anxiety disorders male = 2.79 (2.18 − 3.56), female = 2.23 (1.87 − 2.65).
Regression to the mean
The NoRMHS was designed to have higher proportions of people with positive diagnoses than the SMHWB. Consequently, compared with the general population, the study had relatively more people with a diagnosed mental disorder and who might have become disorder-free over the study period, and relatively less who had no positive diagnosis and who might have developed a disorder. The sampling design thus produces a regression to the mean effect resulting in lower rates of mental disorders at follow-up than at baseline (Table 1). However, the focus of our prospective study is to examine the outcomes over 2 years in subjects with specific baseline diagnoses and to explore the factors influencing them. These trends are unaffected by this regression to the mean effect.
Loss to follow-up and diagnosis
Four hundred and thirty-nine respondents (31.2%) were lost to follow-up between the two face-to-face interviews. Of these, there were 189 men (35.5%) and 250 women (28.6%). If the respondents lost to follow-up were more (or less) likely than others to have positive diagnoses, then this might introduce the potential for various study biases. A model was built to investigate whether being lost to follow-up was associated with baseline variables including age, gender, substance-use disorders, affective disorder and anxiety disorder. Age less than 30 years and gender were significant in all models, but only cannabisuse disorder was significant among the diagnostic categories. The odds ratios and their 95% confidence intervals from the final model were: male = 1.36 (1.07 − 1.72); age less than 30 = 1.21 (1.13 − 1.29) and cannabis-use disorder = 2.25 (1.22 − 4.160).
Percentages of positive diagnoses in the disorder subcategories by gender and survey component
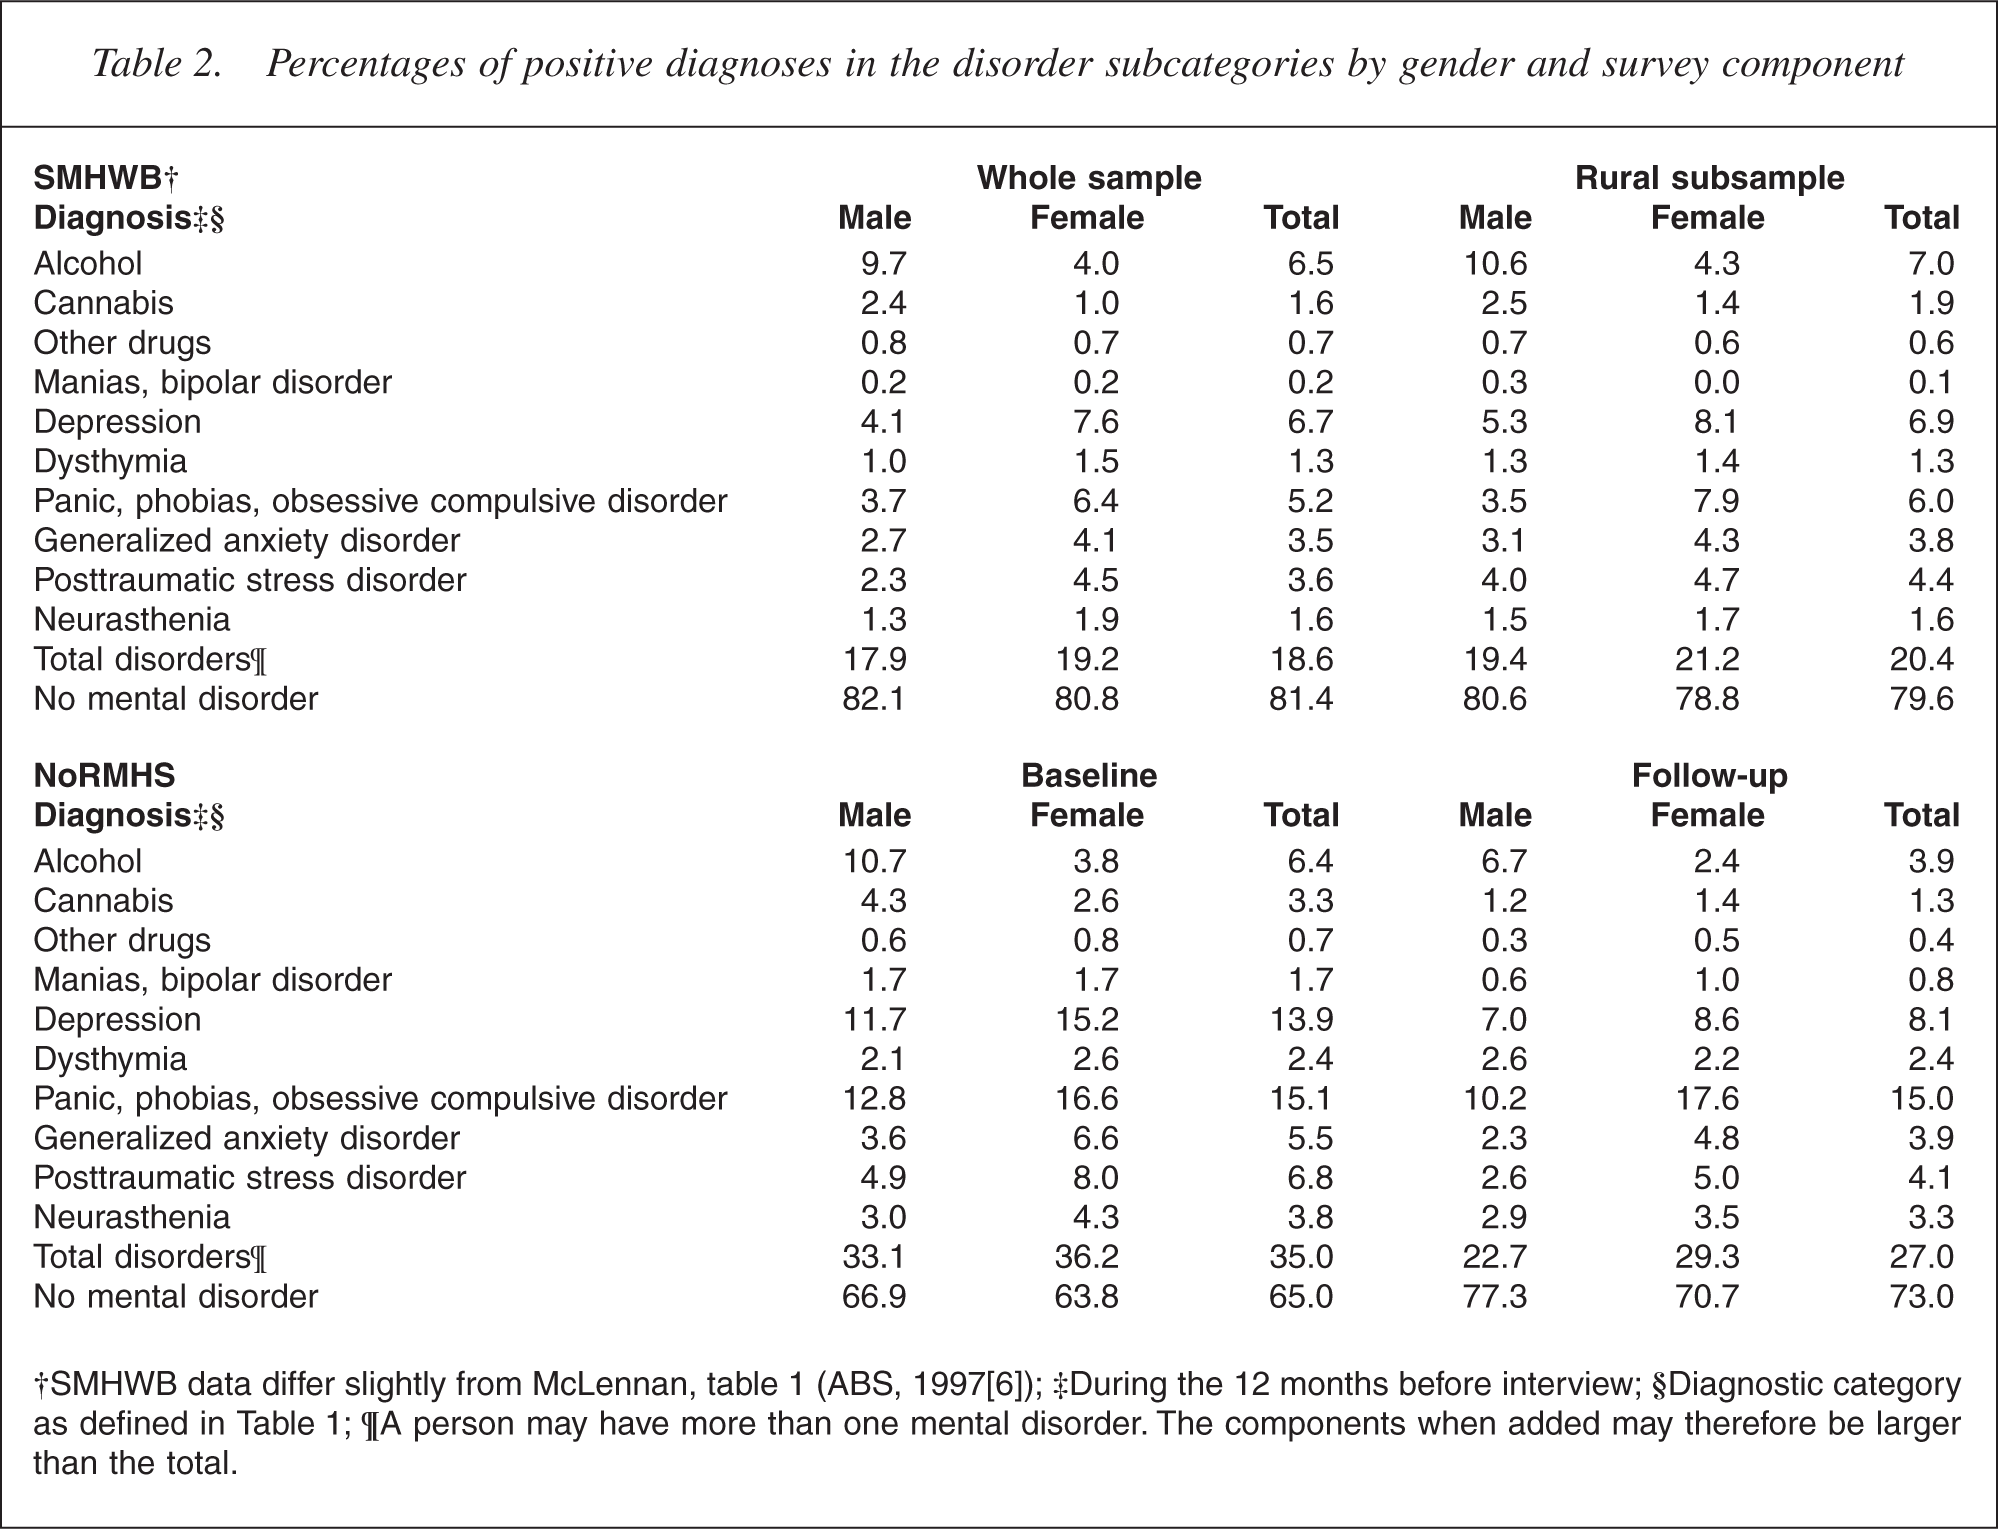
To account for this potential bias, relevant analyses have been adjusted for age and gender. The effect of losing more cannabis-use disorders is minimal because of the small numbers of positive diagnoses (4 male, 9 female at follow-up). Models weighted for the loss of cannabis-use disorders differed only trivially from unweighted models. The latter are reported here for simplicity.
Pattern of mental disorders
Table 3 shows the number of subjects within each diagnostic grouping at baseline and their diagnosis at follow-up (because of comorbidity, subjects with one disorder may also be included under other disorders). Of respondents present at follow-up, 330 (34%) met criteria for one or more disorders at baseline, while 638 had no positive baseline diagnosis. At follow-up, there were 261 subjects with a positive diagnosis comprising 163 subjects who had previously had one or more diagnoses and 98 subjects who had previously been diagnosis-free. The lower proportion of people with a positive diagnosis at follow-up than at baseline is likely to reflect the ‘regression to the mean’ effect resulting from the survey design. It is also important to note that disorder prevalences within the study are generally higher than population prevalence rates because of sample enrichment.
Simple relationships between diagnoses over time: number of people with a diagnosis at baseline and their diagnosis at follow-up†
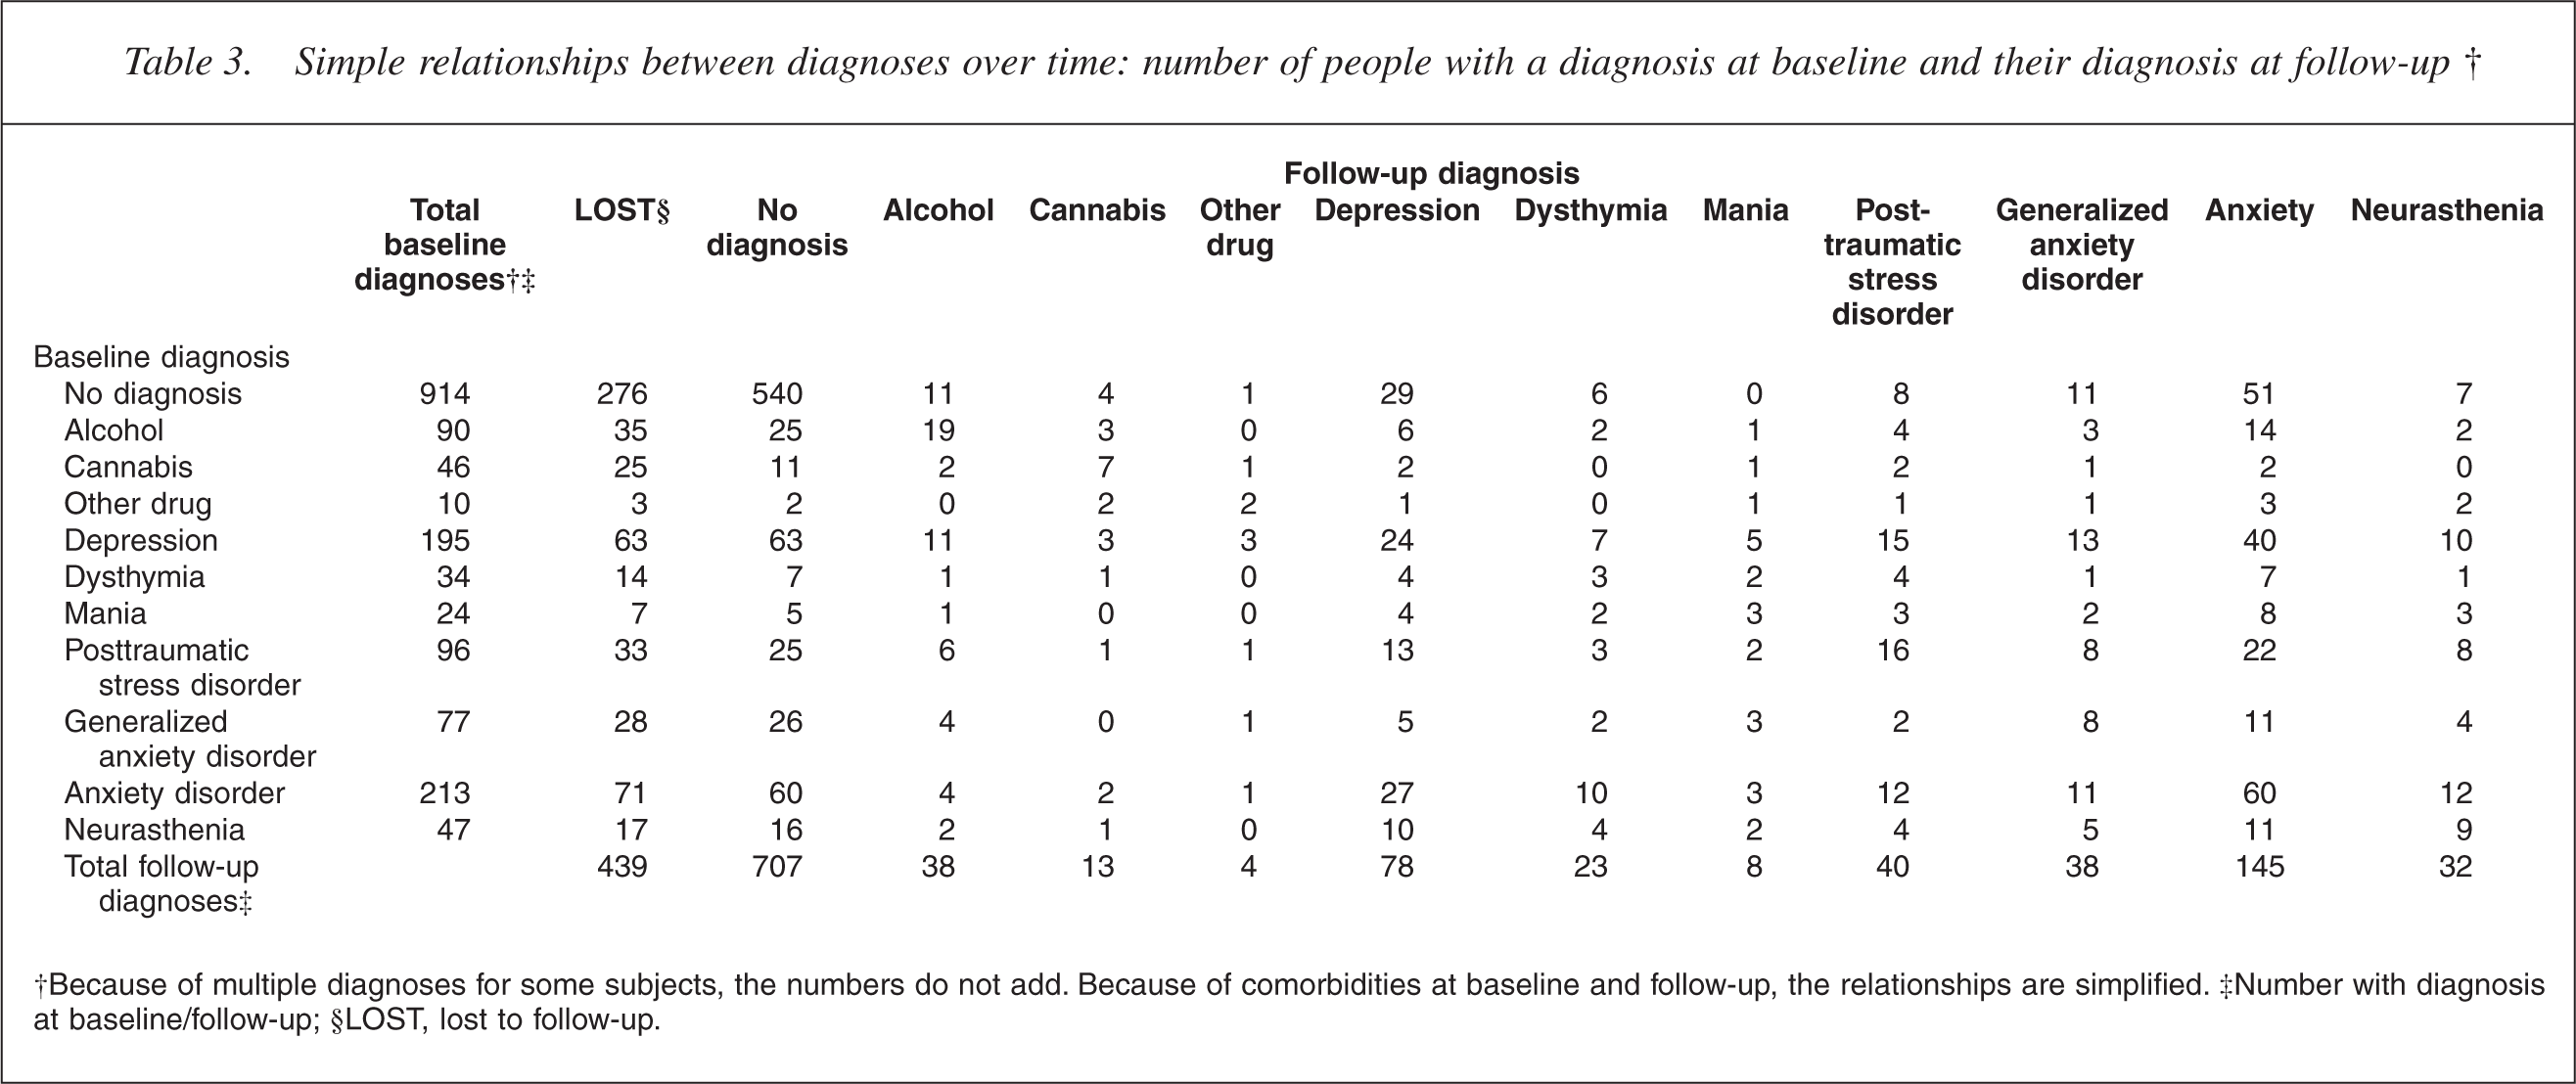
†Because of multiple diagnoses for some subjects, the numbers do not add. Because of comorbidities at baseline and follow-up, the relationships are simplified. ‡Number with diagnosis at baseline/follow-up; §LOST, lost to follow-up.
Of those with a diagnosis at baseline, 56.2% met criteria for multiple disorders. The number of diagnoses at baseline was a strong predictor of the number of diagnoses at follow-up (Pearson chi-square, Monte Carlo p < 0.001). Each additional comorbid diagnosis at baseline also increased the probability of any disorder at follow-up (p < 0.001, OR = 2.5; 95% CI = 2.10 − 2.94).
There was considerable variability within individuals in diagnoses over the study period. For example, in subjects who were interviewed at both baseline and follow-up, of 132 people with an initial diagnosis of depression (without consideration of comorbidity), only 24 (18.2%) met criteria for depression at follow-up, while 40 (30.3%) were diagnosed with an anxiety disorder. Similarly, of 142 subjects with a diagnosis of anxiety disorder at baseline, 60 (42.3%) were diagnosed with an anxiety disorder at follow-up and 27 (19.1%) met criteria for depression.
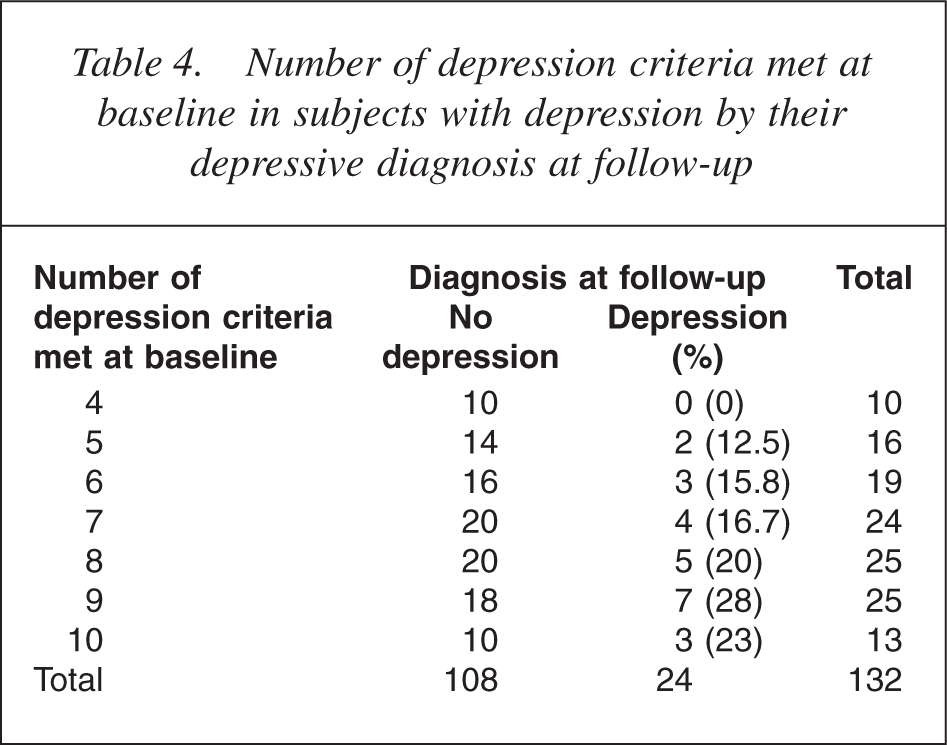
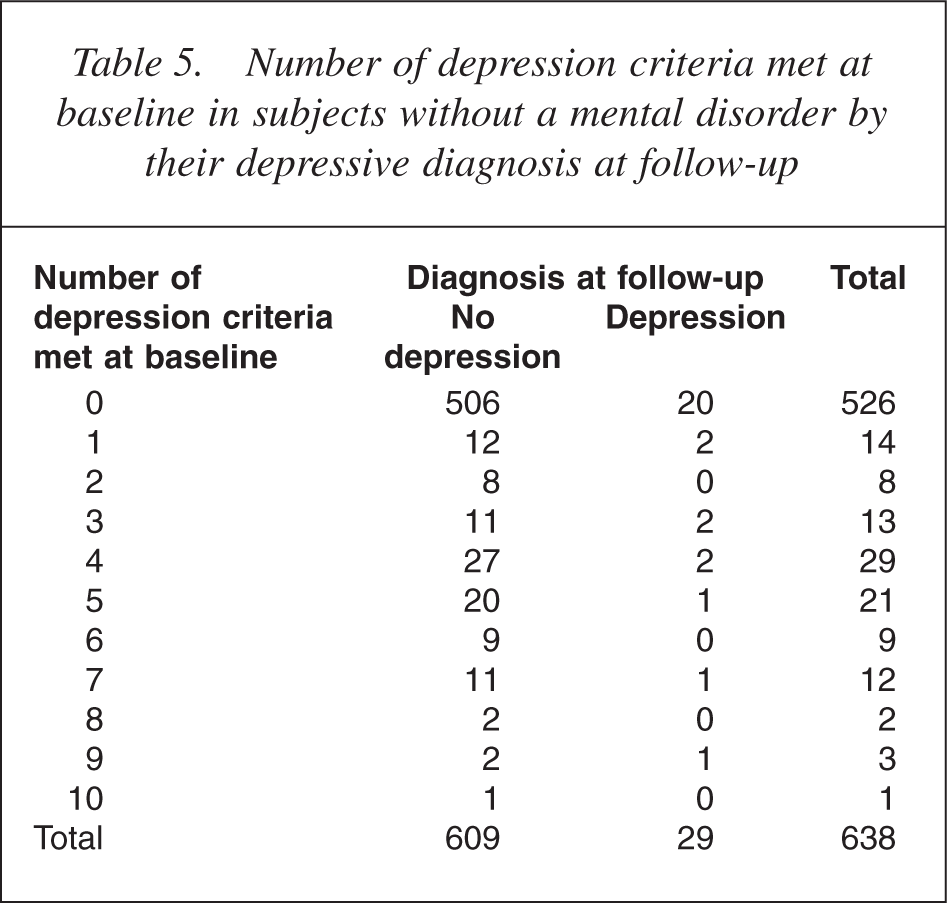
One possible explanation for these findings might be minor symptom or reporting changes in those participants who were just above or below the diagnostic threshold. These may be sufficient to alter diagnostic status, but not reflect meaningful changes in symptomatology. To assess the likelihood of this possibility, we also looked at the number of criteria met by subjects with and without disorders at baseline and how this related to their diagnosis at follow-up (Tables 4,5).
The CIDI uses a complex multilevel assessment process to define subjects with and without a disorder. Diagnosis of anxiety disorders is particularly complex and the impact of marginal symptom changes is difficult to assess. However, the algorithm used to decide who meets the ICD-10 criteria for a depressive episode. (F32.0 Mild Depressive Episode, F32.1 Moderate Depressive Episode, F32.2 Severe Depressive Episode) is constructed in such a way that it is possible to explore the possible impact of measurement error over time in subjects with borderline diagnoses.
To establish a diagnosis of depression, stem questions first ask if the subject has had a period of feeling sad, empty or depressed, or if they have lost interest in most things for a period of 2 weeks or more in the previous 12 months. If either of these criteria is met, subjects are then asked a series of questions on other symptoms of affective disorder. The first of the additional questions asks about loss of interest or pleasure in activities that are normally pleasurable, decreased energy or increased fatiguability. At least two of the stem criteria or this first additional symptom need to be present for a diagnosis of a depressive episode.
Additional symptoms from the following list also need to be present to give a total of at least four for a mild depressive episode, six for a moderate depressive episode and eight for severe depressive episode: loss of confidence or self-esteem; unreasonable feelings of selfreproach or excessive and inappropriate guilt; recurrent thoughts of death or suicide or any suicidal behaviour; complaints or evidence of diminished ability to think or concentrate, such as indecisiveness or vacillation; change in psychomotor activity, with agitation or retardation (either subjective or objective); sleep disturbance of any type; change in appetite (decrease or increase) with corresponding weight change.
Finally, the CIDI excludes subjects with significant hypomanic or manic symptoms or those where the responses may be attributable to psychoactive substance use or to any organic mental disorder.
Only 10 of 132 subjects with a diagnosis of depression at baseline had a total number of depression criteria at the diagnostic minimum of four. None of these had a positive diagnosis at follow-up. As would be expected, there was also a general tendency for more severe cases (those with more symptoms) to have a greater likelihood of having a persistent diagnosis at follow-up. Among subjects without a baseline diagnosis, a surprising number met one or more criteria for depression. A number of these met more than the required four criteria, but were not given a positive diagnosis at baseline because of failure to meet stem criteria or other exclusions. However, only seven of the 29 new cases of depression at follow-up met more than one criteria for depression at baseline.
Incidence of new disorders
Ninety-eight of 638 subjects who were disorder-free at baseline and completed the follow-up interview were identified as having developed a disorder in the 12 months before follow-up. However, to accurately calculate the incidence of mental disorders in the 12 months before interview in previously well subjects from these figures, it is necessary to account for the selection process. To do this, we adjusted for both gender and enrichment of the sample by screening.
Study subjects who were disorder-free at baseline were split into those who had screened negative and those screening positive. Subjects who had screened negative and been invited to participate in the study were a random sample of all negatively screened subjects. These 313 subjects can be considered as representatives of the 81.8% of the target population who had screened negative. Twenty-five of this group were found to have a disorder at follow-up.
A further 449 subjects screened positive, but ultimately were diagnosed as disorder-free by CIDI. These are representatives of the 18.2% of the population who screened positive. Of the 325 who were interviewed at follow-up, 73 had developed a disorder. To calculate the real 12 month incidence of new disease in the total population, we weighted the incidence in these two groups by their relative share of the population, giving a 12 month incidence of any mental disorder among those previously disorder-free of 10.6 per hundred person-years at risk.
Number of depression criteria met at baseline in subjects with depression by their depressive diagnosis at follow-up
Because the proportion of women in the sample (56.6%) was higher than in the adult study population (50.96%), we also stratified the above incidence calculations by gender, giving an incidence weighted by caseness for women of 12.39 per hundred person-years at risk and for men of 7.73 per hundred person-years at risk. Adjusting for the over sampling of women gives an incidence for the total population of 9.95 per hundred person-years at risk.
Discussion
The NoRMHS includes a mixture of diagnostic and other information gathered on community-based subjects 2 years apart. We used the same diagnostic instruments as the SMHWB and our findings provide an insight into the long-term implications of this large national prevalence survey.
In our study, 50.6% of subjects with a mental disorder at baseline were disorder-free 2 years later. On the other hand, we estimate that the 12 month incidence of mental disorders in previously well subjects is approximately 10 per hundred person-years at risk. This is not inconsistent with the Netherlands Mental Health Survey and Incidence Study (NEMESIS), the other large prospective study to estimate incidence for mental disorders. NEMESIS found an incidence rate for the first incidence of any disorder of 5.68 per hundred person-years at risk (men 4.45, women 6.94) [17]. This would be expected to be lower than our rate as, unlike NEMESIS, we included subjects who may have had previous disorders (and hence are more likely to have a recurrence) among those who were disorder-free at baseline.
Number of depression criteria met at baseline in subjects without a mental disorder by their depressive diagnosis at follow-up
If our estimated incidence of new disorders is accurate, it needs to balance with the proportion of subjects becoming disorder-free to give a stable prevalence. In our study, 167 of 330 (50.6%) subjects who were disorder positive at baseline were disorder negative at follow-up. Using the same instruments as us, the NSMHWB identified a prevalence of mental disorders in the general Australian community of approximately 18%. Our findings suggest that approximately half of these (9% of the total population) can be expected to be disorder-free after 2 years. This balances closely to our estimates of the incidence of new disease.
One possible explanation for the changing patterns of mental health status observed in our study might be measurement error in the CIDI, particularly in subjects who lie just below or above diagnostic cut-offs. For example, even though there may have been no real change in their symptomatology, random variation in response may lead subthreshold cases to report the single additional symptom required to give a positive diagnosis. Similarly, cases only just meeting the required criteria may report one fewer symptom even though their condition was essentially unchanged. This would mean that the diagnostic changes we observed may not reflect significant symptom change among subjects, but might merely be the result of minor changes in reporting over time and an artefact of the study methods.
However, analysis of the specific symptoms reported by subjects does not support these concerns and, instead, suggests the identified changes generally represented meaningful shifts in symptomatology. While those subjects with depression at baseline who had the lowest number of symptoms had a better prognosis than more complex cases, this is to be expected. In fact, the striking finding is just how dramatic the changes in reported symptoms are over this 2 year period. Over three quarters of subjects developing depression had one or no symptoms at baseline, while more than three quarters of subjects meeting all 10 symptom criteria at baseline were depression-free 2 years later.
Detailed examination of the factors influencing the prognosis of subjects with mental disorders, or the likelihood of previously well subjects developing mental disorders, is beyond the scope of this paper and will be explored in subsequent papers. However, the number of diagnoses (comorbidity) at baseline was a significant predictor of persistence of mental disorders. This is consistent with clinical experience that complex mental illness tends to be persistent.
Over the study period, there was also considerable variation in diagnosis for those individuals who met criteria for a mental disorder at both baseline and followup. As described above, this seems unlikely to reflect failings of the diagnostic instrument. Alternative explanations may be that such diagnoses reflect a common pathology, or the coexistence of depression and anxiety symptoms at varying intensity over time.
If our findings are applied to the larger cross-sectional SMHWB, they provide interesting estimates of national trends in mental health and the associated need for health care. Based on a nominal adult population of 15 million (7.3 million men + 7.7 million women), the National Survey estimates that 2.7 million Australians might be suffering from a mental disorder over any 12 month period. Our study suggests that, after 2 years, slightly less than 1.35 million of these would still have a mental disorder, while the remainder would have become disorder-free. This would be balanced by a similar number of new cases of mental disorder in previously well individuals. The lability of diagnosis and high incidence of mental disorders need to be considered when planning for health services to address this substantial burden of disease.
Our study has a number of strengths. Because subject selection deliberately resulted in a cohort ‘enriched’ with mental disorders at baseline, this study group does not reflect community prevalence. However, the pool from which this enriched sample was drawn was randomly selected and individuals with particular diagnoses can be considered to be representative of individuals with similar diagnoses who were interviewed by the SMHWB. Our study used the same instruments as the SMHWB with a few additional questions included at the end of the interview and the findings can therefore be directly extrapolated to this large representational survey.
Two factors might potentially bias our findings: regression to the mean and loss to follow-up. Over-sampling of cases makes the cohort as a whole susceptible to regression to the mean when followed longitudinally, because it contained relatively more people with a positive diagnosis who might get better and relatively fewer who had no diagnosis and who might get ill. The effect of this is to yield lower prevalence rates for the cohort as a whole at follow-up than at baseline. However, this effect does not influence the longitudinal follow-up of individual disorders.
An alternative explanation for the lower prevalence of disorders at follow-up may be that subjects who were more likely to have persistent disease were also more likely to be lost to follow-up. Analysis of our cohort suggests that bias associated with loss to follow-up was not a major problem for this study. While 31.2% of subjects were lost between baseline interview and follow-up, when a number of baseline variables were examined to see if they may predict loss to follow-up, only age less than 30 years, gender and cannabis-use disorder were significant predictors. All analyses in this study were adjusted for age. Analyses were also conducted separately for men and women, thus adjusting for the relationship between gender and loss to follow-up. Only a small proportion of the cohort was diagnosed with cannabis-use disorder. Nevertheless, the possibility of bias needs to be considered, particularly when examining substance-use disorders, and when considering the good prognoses suggested by our research.
Conclusion
Our study has previously shown that 41% of reported disability days are the result of mental disorders [18]. These conditions afflict approximately 18% of the Australian population at any one point in time and can be persistent and debilitating. However, a large proportion of subjects with a disabling mental disorder at any one point in time can also be expected to recover. Our longitudinal study provides the first quantitative estimate of the incidence of these disorders within the Australian community, and reinforces the need for early identification and management of the large number of new cases that can be expected over relatively short periods of time.
Footnotes
Acknowledgements
Financial support for this study was received from the North Coast Area Health Service and NSW Health. Thanks to Anne Kempton for her assistance in the early stages of the study. The authors gratefully acknowledge Gavin Andrews for his role in developing the MiniCIDI and for the advice and support he has offered throughout the course of this study.