
Abstract
Many of the most important research questions addressed in psychiatry and mental health relate to how symptoms and behaviour change over time and what factors influence the development of pathological and normal behaviours. Repeated assessments are required for the description of normal and abnormal developmental trends, the range of individual variation in change, and influential risk and protective factors that impact the development of normal and psychopathological development. For example, studying the course of depression longitudinally enables researchers to identify factors associated with onset, remission and relapse and to describe the long-term outcomes at the individual and group level. The information obtained from longitudinal studies is important for designing early interventions to prevent psychopathology and to monitor the effects of treatment and prevention programs on the development of problems such as depression, anxiety, dementia and schizophrenia. Longitudinal studies provide the opportunity to describe individual developmental trends and the identification of risk factors influencing the onset and development of psychopathology and its correlates.
Longitudinal studies are defined as those where the same sample of individuals is measured at more than one time-point. In epidemiology, longitudinal studies are most often referred to as cohort studies, emphasizing the repeated measurement of a defined sample of individuals. In comparison, cross-sectional studies are those where a sample is measured on a single occasion only [1]. In longitudinal studies, traits and disorders may be studied with respect to age-changes within individuals directly. In cross-sectional studies, inferences are made about developmental changes in traits and disorders by examining age-differences between individuals varying in age. It is noteworthy that ‘longitudinal’ describes a range of research strategies [2] that may include interventions, multiple cohorts or multiple sites.
The aim of this review is to provide an overview of key issues and new developments in longitudinal research methodology that are relevant to psychiatry. While we do not intend to provide an in-depth review, we do provide references of summary articles for further study. We begin with a brief overview of frequently used cross-sectional designs, of which all longitudinal studies necessarily begin, before approaching longitudinal design and analysis of longitudinal data. The strengths and weaknesses of cross-sectional and longitudinal studies are summarized in Table 1.
Comparison of study features in cross-sectional and longitudinal designs
Cross-sectional designs
Cross-sectional studies provide information about associations between variables. For example, high levels of depression may be associated with single parent status, stress and low levels of social support [3], [4]; low assertiveness and high emotionality has been associated with alcoholism [5]; anterior hippocampal volume has been shown to be reduced in patients with schizophrenia [6]. Cross-sectional studies cannot shed light on whether variables that have a statistical association also have substantive association. They can however, provide important descriptive information about disorders and their correlates. Cross-sectional studies also provide point prevalence estimates, that is, the number of cases of a particular disorder in a population at the time of the study usually calculated in terms of risk per 1000 (see Jablensky, 2002 [7] for a detailed description of measures of risk in epidemiological studies).
Advantages of cross-sectional studies
Cross-sectional studies are relatively inexpensive to conduct, and of short duration, allowing for results to be obtained within reasonable time. As all individuals are tested at the same time, period (i.e. time-of-measurement) effects are constant relative to longitudinal studies where individuals are tested repeatedly at different times. Period effects refer to events and conditions that affect all age-cohorts studied at a point in time. Examples of period effects that may influence psychiatric research are the introduction of a new medication or global changes to delivery and availability of health services. Period effects are an internal validity threat for longitudinal studies. Cross-sectional studies are also formally free from testing effects, which are another threat to the internal validity of longitudinal studies. Testing effects are observed across repeated assessments of the same or similar measurement instruments and may involve practice effects and other behavioural changes due to testing.
Limitations of cross-sectional studies
Cross-sectional studies have some serious limitations for understanding developmental processes that have led many researchers to favour longitudinal research methods.
Cohort effects
A problem of cross-sectional studies is that age is confounded with cohort effects [8], [9]. Cohort effects relate to the macro conditions that affect birth cohorts (determined by the year of birth) and are directly confounded with chronological age in cross-sectional design. Cohort effects may include factors such as amount and type of education, nutrition, child rearing practices, environmental exposures and attitudes towards psychosocial and cultural phenomena. For example, adults who were infants during the Great Depression may have experienced suboptimal nutrition leading to increased health problems in later life. Neglecting cohort differences in infant nutrition may lead to the misattribution of all poor health to age, instead of infant nutrition [10].
One of the most famous cohort effects relates to intelligence and is known as the ‘Flynn’ effect. Flynn has shown that IQ test scores have systematically increased for successive birth cohorts during the 20th century [11]. An implication of this finding is that in cross-sectional studies comparing young and old adults on intelligence tests, the observed age differences may be, at least in part, due to differences in birth cohorts. Kanaya et al. describe the potential effect this might have on mental retardation placements given re-norming of IQ tests [12].
Sample selection bias
Unlike longitudinal studies, cross-sectional studies may not appear to suffer from participant dropout or differential mortality effects. However, there are inevitable biases in the sample of individuals available in the population at the time of the study relating to physical and mental health and socio-economic status. Therefore, despite the process of attrition and differential mortality being exclusive to longitudinal studies [13], some of the same inferential problems they give rise to occur in cross-sectional studies in the form of selection bias.
Direction of effects not ascertainable
Another important limitation of cross-sectional studies is their inability to shed light on the direction of effect of putative risk and protective factors and outcomes. Associations may be observed between two variables but it is not possible to tell whether the variables are causally related. For example, self-rated health may correlate negatively with a number of depressive symptoms, but this simple association says nothing about whether depression causes poorer self-rated health.
Third variable effects
In a cross-sectional study, it is possible that a statistical association between two variables is due to both variables being correlated with a third variable. For example aggression is associated with delinquency in cross-sectional studies leading some researchers to hypothesize that an underlying antisocial trait causes both factors [14]. If this possibility is not recognized, then researchers may draw false conclusions about the true meaning of statistical associations among variables [15].
Statistical problems of inferring age changes from age-differences
Cross-sectional studies run into specific problems when they use comparisons of individuals at different ages to make inferences about developmental processes or ageing. This is particularly a problem for cross-sectional studies focusing on age-changes in traits or disorders in adulthood and late life because of the need to assess age of onset and rate of progression across a broad range of ages. This practice may lead to false conclusions being drawn about both the mean level of change over time and associations among risk factors and outcomes. There are several reasons for this, related to population dynamics and sampling (effects of selection; mortality) and to the influence of average age differences on estimates of correlations. For detailed explanations of these problems see Hofer et al. [16] and Kraemer [17].
Longitudinal designs
Much of the development of longitudinal methods and applications has occurred in the areas of child development and in ageing, periods of life during which changes occur more rapidly, and when new disorders begin. More recently, however, there has been an effort to commence studies of mid-life in recognition of the lack of longitudinal research at this stage of the lifespan [18]. Another recent development in the field of psychiatric epidemiology has been the emphasis on lifespan approaches that allow genetic, biological and environmental risk factors associated with the development of psychopathology to be identified [19], [20]. Examples of key longitudinal studies in psychiatry include: the Lundby study [21]; the Stirling County study [22]; the Dunedin Child Development Study [23]; Simmons Longitudinal Study [24], and the Canberra Longitudinal Study [25].
Advantages of longitudinal studies
The potential benefits of longitudinal studies are many. They allow researchers to measure change within individuals, to identify precursors of psychopathology, to track at-risk groups and to evaluate treatment outcomes. Particular longitudinal designs allow sampling across multiple age cohorts in a manner that overcomes the problems of cohort effects being confounded with age-differences [26]. Longitudinal studies provide descriptive information on the development of normal and pathological behaviour over time, allow for the identification of antecedents of psychopathology, and provide a means of testing hypotheses about the direction of effects [27].
Limitations of longitudinal studies
Longitudinal studies are not without their methodological limitations [8], [28]. The first of these is selective drop-out or attrition. Selective drop-out refers to the fact that individuals who have poorer physical or mental health, or who are less motivated, will be more likely to discontinue in the study. Since the variables of interest to the investigator often involve physical and mental health, selective drop-out biases the remaining sample with respect to the variables of interest.
A second problem faced by longitudinal studies involves testing effects. Participants learn from the experience of being assessed at the first wave of a study, and may perform better on cognitive tests on subsequent occasions, or answer questions differently simply because they are no longer naive to the issues being studied.
Longitudinal studies are often put forward as the ‘answer’ to the limitations of cross-sectional studies because they enable causal relationships to be identified. However, where two variables are correlated over several occasions of measurement, the issue of third variable effects is applicable just as in cross-sectional studies.
Central issues in psychiatric research addressed by longitudinal studies
Description of clinical and developmental phenomena at the individual and population level
Incidence and prevalence
One of the most valuable contributions of longitudinal studies is to provide descriptive data on the natural history, prevalence (both point prevalence and cumulative prevalence), incidence, and duration of psychiatric disorders [7]. Longitudinal studies are also necessary to obtain information about the onset of disorders and remission of disorders. For example, studies of antisocial behaviour in adolescents have shown that over 60% of adolescents participate in antisocial behaviour, but that only about 5% remain antisocial beyond adolescence [14].
Identification of developmental trajectories of mental disorders
Longitudinal studies are necessary to describe varieties of developmental trajectories. Kraemer (2000) describes three developmental trajectories that are important in psychiatric research (illustrated in Fig. 1) [17]. The first type is a fixed trait that is stable over time (Fig. 1a). Variables such as gender and genetic phenotypes are examples of fixed traits, but there may also be personality or ability variables that are stable. Although many statistical models assume that whether a variable is fixed or variable is known a priori, there are many instances in which this information itself is the topic of research. For example, longitudinal research is required to determine the stability of temperament over the lifespan, and the constancy of social indicators such as socio-economic status.
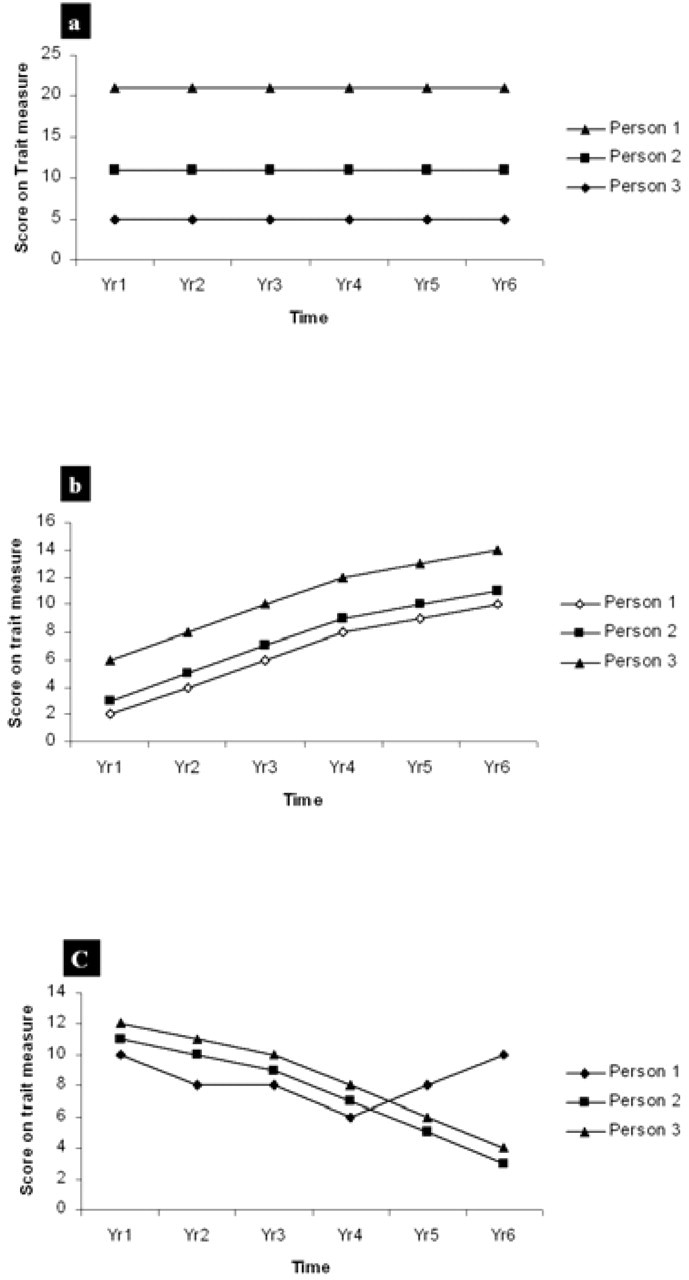
(a) Trajectories of a fixed trait in three participants; (b) trajectories of three participants who differ in the level of a trait but have parallel patterns of change over time; (c) trajectories of a trait showing different patterns of change over time (adapted from Kraemer et al.) [17].
The second type of developmental trajectory described by Kraemer [17] is that of parallel trajectories (Fig. 1b). In these cases, individuals have the same developmental trajectories with respect to particular traits or abilities but start at different levels. For example, individuals may have different levels of cognitive ability, but this may decline at the same rate in old age. Kraemer argues that although there are no examples of such patterns in psychiatric research, many statistical models assume that this type of process is occurring. However, studies of cognitive ageing over short time periods (say 5–10 years) may show roughly parallel trajectories in samples without cognitive impairment.
The third type of developmental trajectory described by Kraemer is non-parallel (Fig. 1c). This is the most common type of developmental trajectory of interest to psychiatric research. Where the topic of investigation is a condition such as Alzheimer's disease, some members of the sample may show stability, some may show slow decline in cognitive abilities while a clinical group shows a rapid decline in cognitive ability. Where the focus of investigation is mood state, there again may be part of the sample showing fairly stable mood, chronic depressives showing chronic low levels of mood, remitting relapsing depressives fluctuating in mood and individuals with bipolar disorder showing cyclical or varied patterns of change over time. The time interval between occasions of measurement will influence the degree to which variability is observed.
Continuity and discontinuity of behaviours and psychopathology
A critical issue addressed in longitudinal studies of children relates to the continuity versus discontinuity of problem behaviours [14]. Longitudinal studies may address questions such as whether early problem behaviours develop into stable problem behaviours later in life, whether anxious children become anxious adults and whether attachment styles observed in 12-month-old infants are similar in the same children aged 4 years. Similarly, in adulthood, longitudinal studies may answer questions about the probability of relapse of disorders after the first episode. Cross-sectional studies are unable to identify the processes that explain continuities and discontinuities in development [2].
Identification of risk factors
Longitudinal studies allow for identification of precursors or antecedents of specific behaviours and disorders. In a cross-sectional study maternal depression may be associated with child behaviour problems, but it is not possible to judge whether child behaviour problems precede maternal depression, maternal depression precedes child behaviour problems, or whether the two co-occur. Longitudinal studies of child and adolescent development have examined temporal relationships between maternal and child mental health and determined some directions of associations [29]. Increasingly, the interactions of genes and environment are being studied in longitudinal studies of psychiatric disorders [30], [31].
Evaluation of treatment outcome and adverse effects
The long-term benefits, and side-effects of treatments for psychiatric disorders can only be evaluated using longitudinal research designs. For further information on clinical trials see articles in this series [32], [33].
Types of data gathered in longitudinal studies
Statistical methods used to analyze data from longitudinal studies are determined by the type of developmental data being gathered. Nearly all developmental data relevant to research in psychiatry and mental health can be classified as either continuous or discrete [34]. The way variables and the development of disorders are conceptualized influences the types of measures included in a study, the nature of the statistical analyses possible and the types of questions that may be answered by analyzing the data.
Continuous data for measurement of continuous processes
The study of normal psychological development focuses largely on continuous change (gains or losses) in human abilities or traits. For example, cognitive development is usually viewed as a continuous process with increases early in life, stability in mid-life and some decline in later life. Conditions that have a developmental trajectory of increasing severity such as dementia are also usually studied as continuous processes. Many of the measures used within this framework are also continuous, with parametric statistical properties, allowing for analysis of growth curves and rates of change. It is also possible to view psychological phenomena such as depression in terms of continuous measures of mood that fluctuate over the lifespan.
Scales of measurement
Ideally, in a longitudinal study, continuous variables will be measured on at least an interval scale, have identical meaning at different occasions of measurement, have an adequate number of items and have variation in items to measure very high and very low abilities (i.e. no ceiling or floor effects). An interval level measurement is necessary to enable comparison of degree of change between time periods and to develop meaningful growth curves. For example, if measuring anxiety longitudinally, we need to establish that a decline in anxiety symptoms from 10 to 8 over 2 years is the same as decline in anxiety symptoms from 15 to 13 over 2 years.
Measurement invariance across groups and over time
For both scientific and diagnostic purposes, it is important for measurements to be comparable across developmental periods, levels of outcomes and between subgroups of interest. This is called measurement invariance. For example, researchers such as Achenbach have developed scales that are valid for different stages of child development, in order to overcome the problem of symptoms of child behaviour problems changing through the preschool and early childhood years [35]. Statistical methods are well developed for the evaluation of measurement (i.e. factorial) invariance of latent constructs such as depression, anxiety and cognition. Meredith has developed a hierarchy of tests for evaluating the invariance properties of multiple item tests [36]. The evaluation of factorial invariance is usually performed within a general structural equation-modelling framework. This provides a systematic method of ensuring the same items in a test designed for a specific purpose (e.g. to measure depression), actually measure the same construct in groups of individuals drawn from different sources, age groups or at different times. An example of where this issue may become important is in designing instruments to measure depression in older adults or adults with physical health problems. Items that measure symptoms of depression in healthy young adults (e.g. fatigue, sleep difficulties), may reflect frailty or physical illness in other populations or in the same population at a different life-stage [37].
Categorical data for measuring discrete phenomena
A second approach to the longitudinal study of development that has greater relevance to pathological outcomes involves viewing development as a phenomenon involving discrete transitions. Researchers focus on major stages, life events or diagnoses as outcomes. Measures used within this framework are more likely to be categorical and development is not modelled as a growth process, but as a time period in which an observation (transition or diagnosis) has a probability of occurring [38]. Transitions may be irreversible or reversible. Statistical modelling of reversible transitions is highly complex and less often attempted than statistical modelling of irreversible transitions [38].
When data represent discrete phenomena, they are usually in binary format indicating whether or not a transition has occurred. Transitions may occur at different times for different individuals, not occur at all, represent a permanent change, or individuals may move in and out of the transition state. For example, in a longitudinal study, individuals may experience a first episode of depression at different times, not experience any episodes, become chronically depressed or have several episodes of depression. Transitions differ from the classification of participants from a researcher's perspective. An individual may be classified as a ‘case’ after a single episode of depression, thus the first transition may result in the participant being permanently classified according to the researcher's design. Static classification of participants at one occasion of measurement may lead researchers to overlook the dynamic quality of developmental processes, but at the same time may be the most appropriate approach for answering a single research question.
Longitudinal study designs
Longitudinal studies vary with respect to the composition of the sample, the number of follow-ups and the intervals between follow-ups.
Retrospective studies
Retrospective studies involve studying the histories of individuals, through self-report or case notes, in order to obtain information on diagnoses, life events and so on. The first wave of a prospective longitudinal study often includes a retrospective component in which participants are asked questions such as whether they have ever been depressed, or taken medication for depression. For example, the Path Through Life Study includes questions on childhood adversity even though the study is primarily a prospective examination of common mental disorders [20].
Empirical studies conducted to evaluate the validity of retrospective reports have generally found them to have low validity. Participants tend to forget events occurring in the distant past [39] or when they actually occurred [40]. Memories of past events are also sometimes reconstructed on the basis of suggestion or later information and may not be accurate [41]. One large evaluation of the reliability and validity of retrospective reports in young children found that while there was relatively high agreement between reports at age 18 years of height, weight and physical injuries measured at ages 9–11 years, there was very low agreement between reports at age 18 and self- and mothers' reports of depression and anxiety at ages 9–11 [42]. These authors concluded that the lowest level of agreement between prospective and retrospective reports was for psychosocial measures. They suggest that retrospective reports are particularly unreliable for determining estimation of the timing of past events. Retrospective studies based on case notes are limited by the data collected by relevant sources and loss of data due to destruction or unavailability of medical records. Event history calendars provide a structured yet flexible method of collecting retrospective data [43].
In some instances, the retrospective approach is the only option available to the researcher attempting to piece together the historical antecedents of current behaviours and problems. Retrospective studies may be most useful in forensic psychiatry and suicide studies.
Follow-up studies involving two occasions of measurement
Follow-up studies are a common longitudinal research design involving two occasions of measurement, often involving an intervention. This design provides no information on fluctuations between the two time intervals being studied, and data from such studies must be modelled as a linear function [34]. The main limitation of studies involving only two occasions of measurement is that of measurement error. Individuals who score lower than their ‘true score’ at Time 1 and higher than their ‘true score’ at Time 2, will appear to have changed, even if they have not. Likewise, some individuals will appear to have remained stable because of measurement error, even when their true scores have changed. Although measurement error is a problem for all longitudinal studies, it has the greatest effect on results of follow-up studies. In experimental research this problem is often described as regression to the mean. It is usually overcome by the inclusion of a control group.
The potential impact of measurement error in a cohort study was well illustrated in a study on reading disability based on the Dunedin Multidisciplinary Health and Development Study [44]. On the basis of observed data, 37% remission occurred within a 2-year period; however, when statistical techniques (Markov models) were used that took account of measurement error, the remission rate went down to 15–19%.
Further criticisms of change scores obtained from follow-up studies are that they are unreliable, and that they correlate with initial status. However, it has been argued that low reliability does not always imply that change has been poorly measured, and it has been noted that low reliability may occur in a sample where individuals are growing at the same rate [45].
Single and multiple cohort studies
Cohort studies may include one sample of a defined age range and from a defined population that is followed longitudinally, or multiple samples drawn from different populations. The populations may differ with respect to age or location. Inclusion of multiple age-cohorts in a longitudinal design is sometimes referred to as an accelerated longitudinal design. Cohort studies have the advantage of being designed to answer specific research questions, allowing for inclusion of appropriate measures and the use of optimal sampling techniques.
Longitudinal studies involving more than two occasions of measurement
Statistical modelling of longitudinal studies ideally involves three or more occasions of measurement. Measurement schedules may be fixed for all participants to equal time intervals, fixed for all participants to unequal time intervals or variable for all participants [34]. Studies with fixed intervals are easier to administer and implement, but in some cases more valuable information may be obtained if there are a greater number of study waves when the sample is undergoing rapid development [46]. In practice, availability of research funding may determine the follow-up interval that is possible.
Statistical features of longitudinal data
Appropriate statistical methods for analyzing longitudinal data are often quite complex and require knowledge of specific software packages. Without consideration of the conceptual and statistical issues involved in longitudinal data analysis, much of the richness and value of longitudinal data is lost.
Autocorrelation
Most statistical methods developed for analysis of cross-sectional data assume that observations are independent of one another. However, a fundamental aspect of data obtained from longitudinal studies is that repeated measurements within participants are correlated, known as autocorrelation [47]. This fact must be considered when selecting techniques for analyzing longitudinal data. In psychiatric data, the level of a trait or existence of psychopathology will almost certainly influence the probability of this trait or psychopathology being present on subsequent measurement occasions. For example, depressive symptoms at one occasion of measurement are likely to be correlated with depressive symptoms at a subsequent occasion of measurement.
Correlations among participants from the same group
Another feature of many longitudinal studies (and cross-sectional studies) is that individuals are sampled from natural groupings such as families, neighbourhoods or schools. This results in hierarchical data structures and non-independence of participants within groups.
Patterns of correlation over time
Events occurring proximal to each other are likely to be more highly correlated that events occurring distally. For example, trauma is more likely to be associated with anxiety in the subsequent 12 months than at an occasion of measurement 20 years later. However, repeated measures analysis of variance does not take this fact into account, assuming that repeated measures are equally correlated over time and have equal variance [47]. There are many instances where individual differences increase over time. For example, individuals may differ in their response to treatment.
Covariates – fixed and time varying
One of the main goals of most longitudinal studies is to determine factors that influence normal and pathological development. These factors may either be fixed at a particular level, for example gender, ethnicity; or variable, for example physical health, treatment. Traditional statistical methods such as repeated measures analysis of variance cannot take into account the time-varying nature of covariates. There are several longitudinal methods such as survival analysis and latent growth modelling that do allow for time-varying covariates.
Missing observations and participant drop-out
All longitudinal studies suffer from both missing data and participant drop-out. Drop-out may be due to factors such as subsequent refusal to participate, participants moving and being uncontactable, participants becoming institutionalized and participants dying. In research on very old adults, expected mortality in the sample can be estimated before the study commences. Three types of missing data in longitudinal studies have been described [48]. Missing completely at random entails the probability of data being missing as equal across time. In this case, the probability is that data are missing purely due to chance occurrences such as lost records or minor illness. The second type of missing data is known as ignorable. This occurs when the reason for non-response depends on the observed data. Missing data due to patients dropping out of a study is generally ignorable because there is usually information collected that predicts drop-out. For example, severity of psychiatric disorder or older age may be strongly associated with drop-out. Patients in a placebo group may be more likely to drop out due to lack of response to treatment. Ignorable missing data can be managed by a group of statistical models called Random Regression Models (RRMs). The final category of missing data is non-ignorable. In this case, non-response depends on unobserved characteristics of the participant that would have been measured had the participant remained in the study.
Methods for analyzing longitudinal data
Plotting the raw data
In the era of sophisticated software and modelling techniques it is easy to forget the benefits of plotting raw data to understand individual differences in change over time. Plotting of raw data enables the researcher to identify outliers and possible subgroups within the sample whose developmental trajectory may differ from the main group. It will show whether some individuals are changing rapidly while the rest of the sample is following a normal developmental trajectory. The value of plotting raw data before moving onto more sophisticated analyses cannot be underestimated.
Survival analysis and time series
Survival analysis is the most important technique for analysing transitional data with discrete outcomes [34], [49], [50]. Information about the timing of onset of disorders, relapses and recovery and factors that influence these events may be examined through survival analysis. Survival techniques were originally developed to examine life expectancy [51]. They depict the cumulative probability of survival from birth. Survival functions are displayed as step functions that decrease as more of the sample reach the end point being studied. Boyle and Willms [34] define the hazard probability as ‘the chance or likelihood of a study outcome occurring during a particular risk period’. For example, in a study of recovery from depression in a sample of 100 depressed adolescents, 10 participants recovered during the first month. The hazard probability during this month would therefore be 10/100 or 0.1. The hazard probability enables the determination of peak recovery time.
The survival function is equal to 1 minus the hazard probability. Boyle and Willms (2001) define cumulative survival as ‘the chance or likelihood that a randomly selected individual from a defined population will “survive” (i.e. not experience the transition) up to a particular time point’ [34].
The statistical models used in survival analysis require certain conditions to be met in terms of assumptions about the data and measurement of information used in the model. The first is that participants lost to follow-up (who must be removed from the analysis) are lost at random. The second is that time-dependent profiles can only be obtained for the period of risk studied. Third, hazard effects are not affected by history effects. Fourth, the transition must be clearly defined, and finally the starting point must be clearly defined for each participant.
The most important feature of survival analysis is that unlike logistic regression it takes into account the variation in risk over time. The importance of this is illustrated in a classic study on recovery rates of patients with psychotic depression, compared with schizoaffective, depressive disorder [52], [53]. At 40 weeks, patients with schizoaffective disorder were more likely to have recovered, whereas at 80 weeks there was no difference between groups and at 200 weeks patients with psychotic major depressive disorder were more likely to have recovered. This complex pattern of relative findings is described using survival functions, whereas it may be obscured using methods that do not incorporate time-varying covariates or variations in risk over time [38]. Survival analysis does not require specific software and is included as an option in most regression models in commonly used software packages such as SPSS, SAS and STATA. Similar to other forms of regression, covariates (fixed or time-varying) may be included in the model to control for potential confounding factors or to explain between subject variation. Interaction effects may also be included in survival models to account for moderating effects.
Multilevel models
Multilevel models are used to analyze longitudinal data that is hierarchical in nature or that involves clusters [34], [54]. It may be used to analyze trends within schools, families or households. For example, multilevel modelling has been used to determine whether school environment affects depressive symptoms in adolescence, independent of socio-economic status [55]. Multilevel models may also be used in the analysis of outcome studies such as trials of cognitive behaviour therapy [56].
Latent growth curve models (LGCM) are another group of models (actually a subtype of multilevel models) that may be used to describe longitudinal change in continuous variables such as cognitive performance [57], [58]. Longitudinal modelling of this type uses a structural equation modelling framework and may be used to estimate change in either single variables (e.g. depression measured by the Centre for Epidemiological Studies-Depression Scale) or change in latent variables based on multiple indicators of measured constructs. An example of a latent construct that may be analyzed over time is memory, measured by three memory tests such as list-learning, a picture recall and digit recall. Change in latent constructs or single variables over time is estimated by specifying a level and slope factor within the model. An advantage of latent variables is that they separate true variance in the construct from the measurement error and can therefore estimate true change in latent variables over time. Once a growth curve model has been specified, covariates (fixed or time-variant) can be added to the model. Growth curve models can be used to answer questions about pattern and rate of change over a given period, variables that predict rate of change and correlations among individual rates of change over time.
It is important to be aware of the assumptions underlying growth curve models. First, everyone in the sample has the same developmental trajectory, but individuals may differ with respect to level of function on the parameter in question. Second, measures used need to be amenable to latent growth-curve modelling. They need to be continuous or have an interval scale, measure the same property at each occasion and have construct validity for the length of the study period being analyzed [58]. Growth curve models are flexible and can accommodate any number of occasions of measurement; measurements may be spaced unequally over time and change may be represented as a straight line or curve.
Latent growth-curve modelling can be conducted in readily available packages, some of which include AMOS [59], Lisrel [60], MLWin, Mplus [61], EQS [60] and SAS proc Mixed [62]. Examples of packages used for multilevel modelling include MLWin [63], Lisrel [60] and Mx [64].
Growth mixture models
New developments in longitudinal analysis known as growth mixture models, allow the researcher to identify subgroups within a sample that exhibit distinct patterns of change over time. Examples include the identification of subgroups exhibiting different patterns of alcohol use and behavioural outcomes such as aggression and hyperactivity in boys [65], [66].
Conclusion
Statistical methods and user-friendly software are now available to enable the non-statistician to analyze longitudinal data. Awareness of design issues and of the advantages and limitations of longitudinal studies we have reviewed in this article is essential for interpreting results from longitudinal studies. Despite the complexities they bring, longitudinal studies offer researchers far greater opportunities to describe and explain possible causes of psychiatric disorders, and the period and cohort factors that influence their trajectories.
Footnotes
Acknowledgements
Preparation of this report was supported in part by National Health and Medical Research Council grant #179805 and National Institutes of Health (National Institute of Mental Health) Grant 1R01MH061809–01A2. We thank Tim Windsor for his assistance.