
Abstract
This report summarizes the results from 1132 ISO-10328 standard tests performed on 21 different prosthetic foot models commonly utilized in the developing world. None of the tested feet passed the strictest ISO testing protocol. All but one failed at the initial Static Proof test, which simulates a single momentary overload, due to permanent forefoot deformation. In addition, all tested feet had significant internal failures that were visible when sectioned longitudinally. Static Proof testing revealed average permanent deformation of the forefoot of all feet that exceeded the optional 5 mm ISO requirement. Forefoot deformation for non-Jaipur rubber feet came closest to meeting the standard at 8.3±3.4 mm; deformation of the various types of rubber Jaipur feet was the greatest at 22.5±5.4 mm. Forefoot deformation for polyurethane (PU) feet was 13.6±5.5 mm. Forefoot deformation of the ethyl-vinyl-acetate (EVA) feet was slightly greater than the Jaipur feet at 22.8±5.7 mm. After the Static Strength test, which simulates a higher momentary overload, permanent deformation of the feet increased. The average maximum deformation for rubber SACH forefeet varied from 17 – 30 mm, and 11 – 26 mm for the heel; Jaipur forefeet 47 – 60 mm and heels 13 – 19 mm; PU forefeet 20 – 44 mm and heels 20 – 33 mm; and EVA forefeet 33 – 50 mm and heels 16 – 31 mm. After completion of the Cyclic Test the prosthetic feet were sawn in half and closely examined visually. All feet revealed internal derangements: (i) Deformation of rubber or PU foam under the keel of forefoot and/or heel: HCMC, VI, EB1, BAVI, HI Cambodia, Myanmar, Angola, TATCOT, Kingsley and CR; (ii) Delamination from the keel: Mozambique, PHN, and Pro-cirugia; and (iii) Delamination between foam layers: BMVSS, NISHA, MUKTI, and OM. The influence of the two environmental factors tested was minimal for rubber feet with respect to deformation and inconsistent for the polymer feet; in particular for the forefeet. Creep increased with humidity exposure in some feet of natural rubber. However, creep decreased with ultraviolet (UV) exposure for these natural rubber feet, as was also the case for EVA feet, whereas the creep increased for two PU feet. Comparison of the effect of humidity and UV exposure generally showed less creep with UV exposure. In conclusion, ISO-10328 testing prior to release of a new foot construction for amputee use appears to be useful in the developing countries as well as in the developed world, even though it does not simulate the wear on the plantar surface that is seen clinically in barefoot walking. Inspection of the internal structures after the laboratory testing has been shown to reveal occult failure mechanisms in all tested feet.
Introduction
Cummings (1996) scrutinized 30 years of peer-reviewed publications and found no relevant publications about prosthetic feet utilized in the developing world other than those about the rubber Jaipur foot that were authored by the group at the SMS Hospital in Jaipur, India. Repeating this literature search in 2006 in preparation for this paper did not reveal any technical publications related to testing of feet intended for developing world use apart from the thesis by Poetsma (1994). The ISO-10328 standard for testing of lower limb prostheses was first published in 1996 and revised in 2003. Technical publications related to foot performance have primarily focused on new developments in multi-axis and energy storing foot designs intended for use in the developed world. The purpose of this study was to test the feet developed and manufactured by non-governmental organizations in the developing world. One foot supplied by a western manufacturer and widely used in South America was tested for comparison purposes.
Materials and methods
This report is based on 1132 ISO-10328 standard tests performed on 21 different foot models as described in Table I and illustrated in Figures 1 through 21. A total of 14 of these were made from vulcanized natural rubber or foam rubber, and seven from polymer materials, primarily polyurethane (PU), although two were constructed from ethylene-vinyl-acetate (EVA) or polypropylene (PP)-EVA.
HCMC foot.
VI-foot.
EB-1 foot.
BAVI foot.
HI-Cambodia foot.
Myanmar foot.
Mozambique foot.
Angola foot.
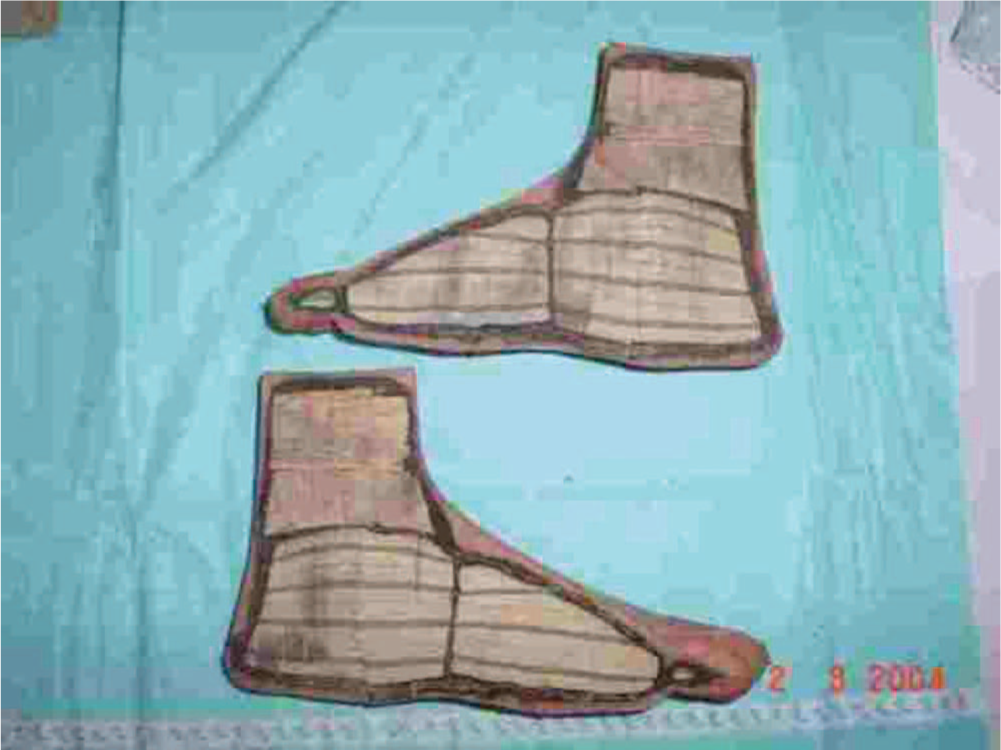
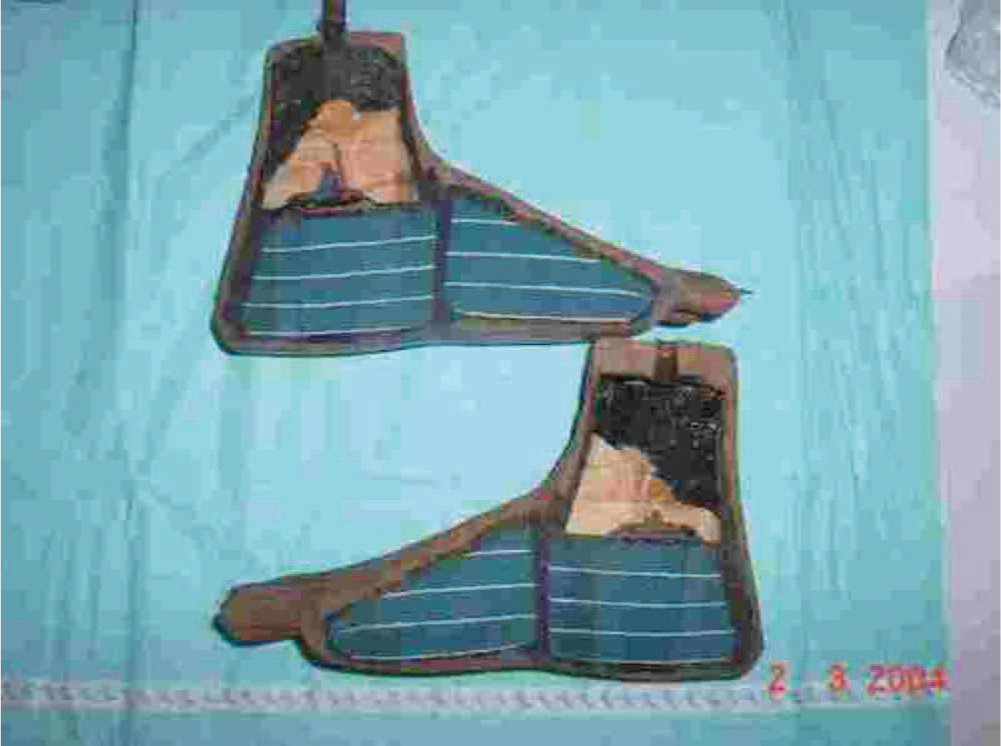
PHN foot.
TATCOT foot.
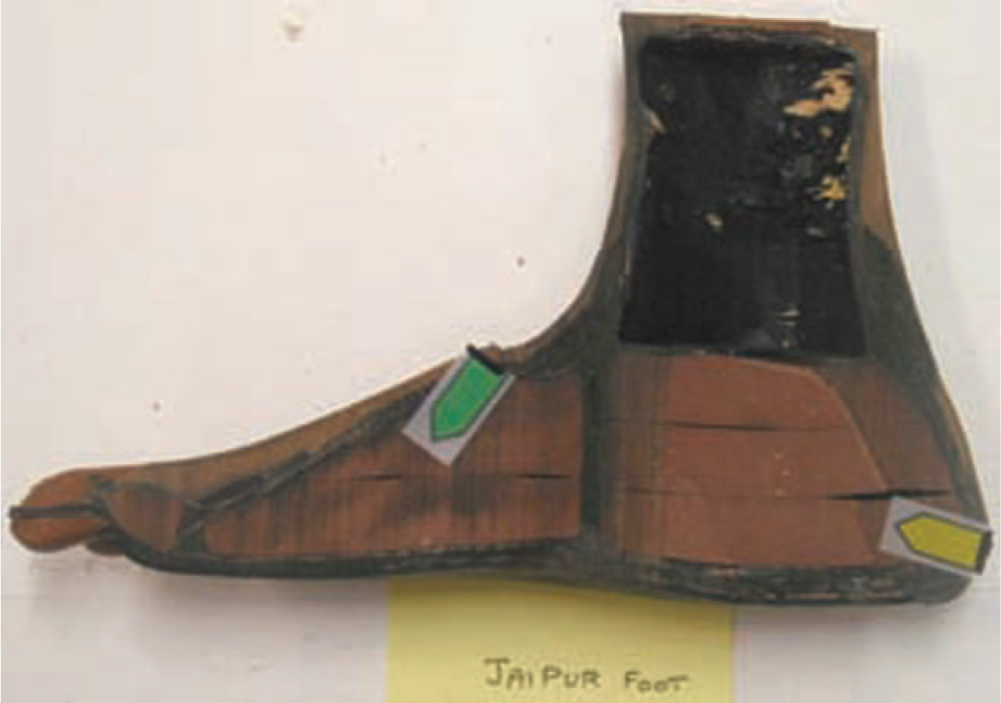
BMVSS Jaipur foot.
NISHA Jaipur foot.
MUKTI Jaipur foot.
OM Jaipur foot.
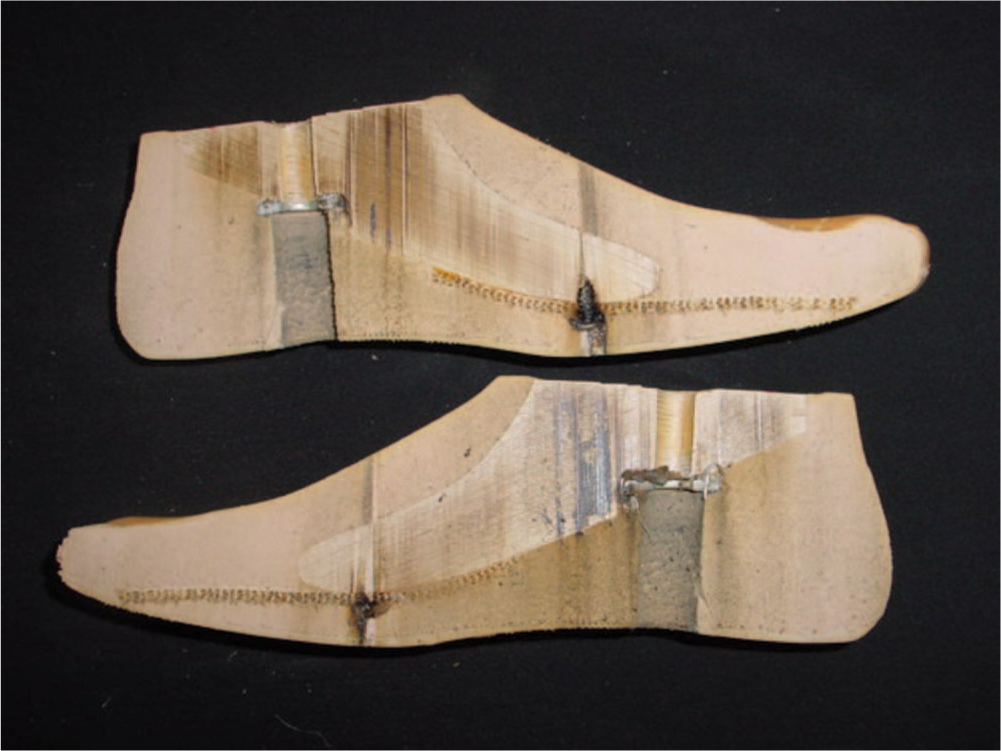
Kingsley foot.
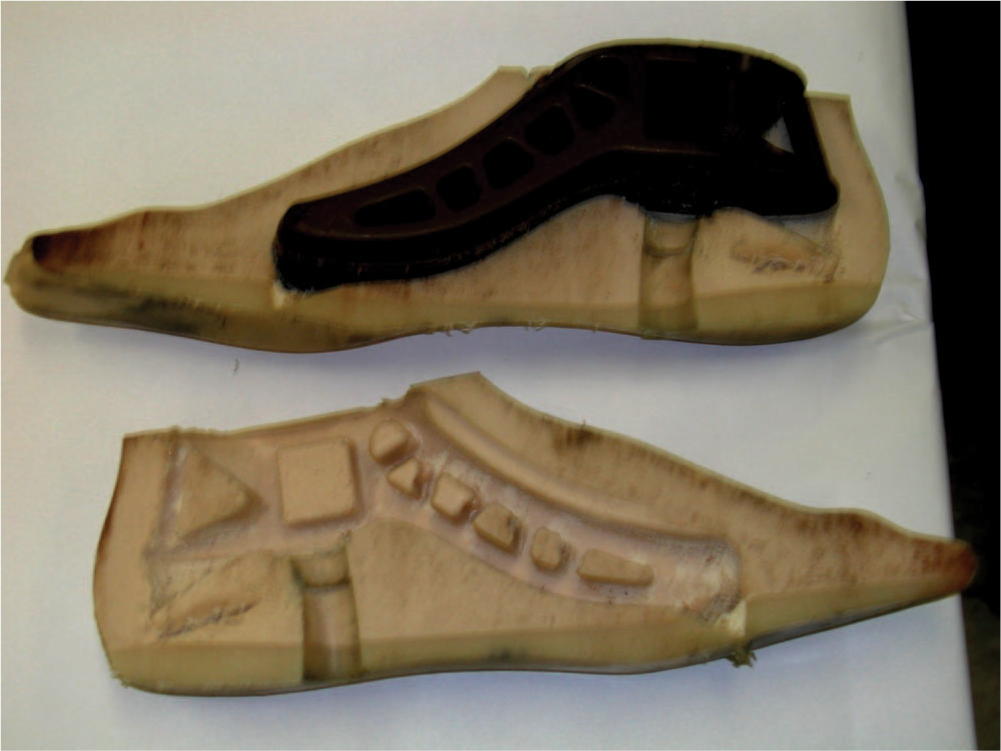
CR foot.
PF-Thai foot.
Pro-cirugia foot.
Afghan foot.
Alimco foot.
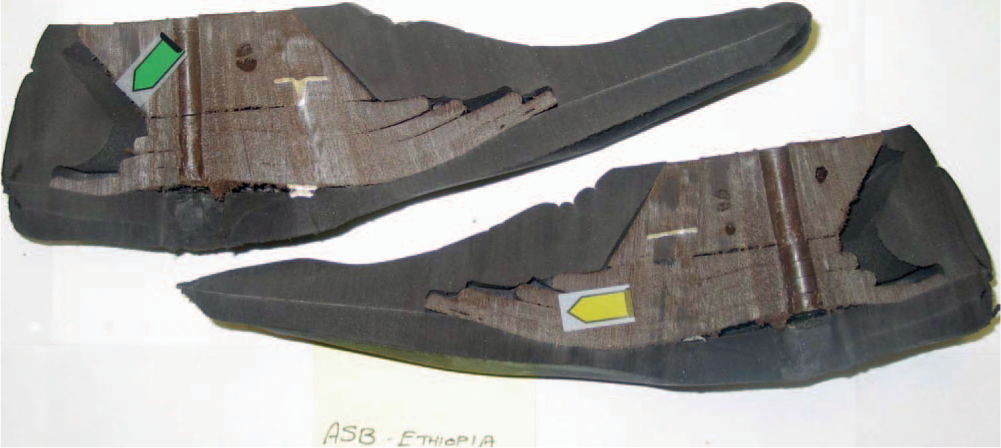
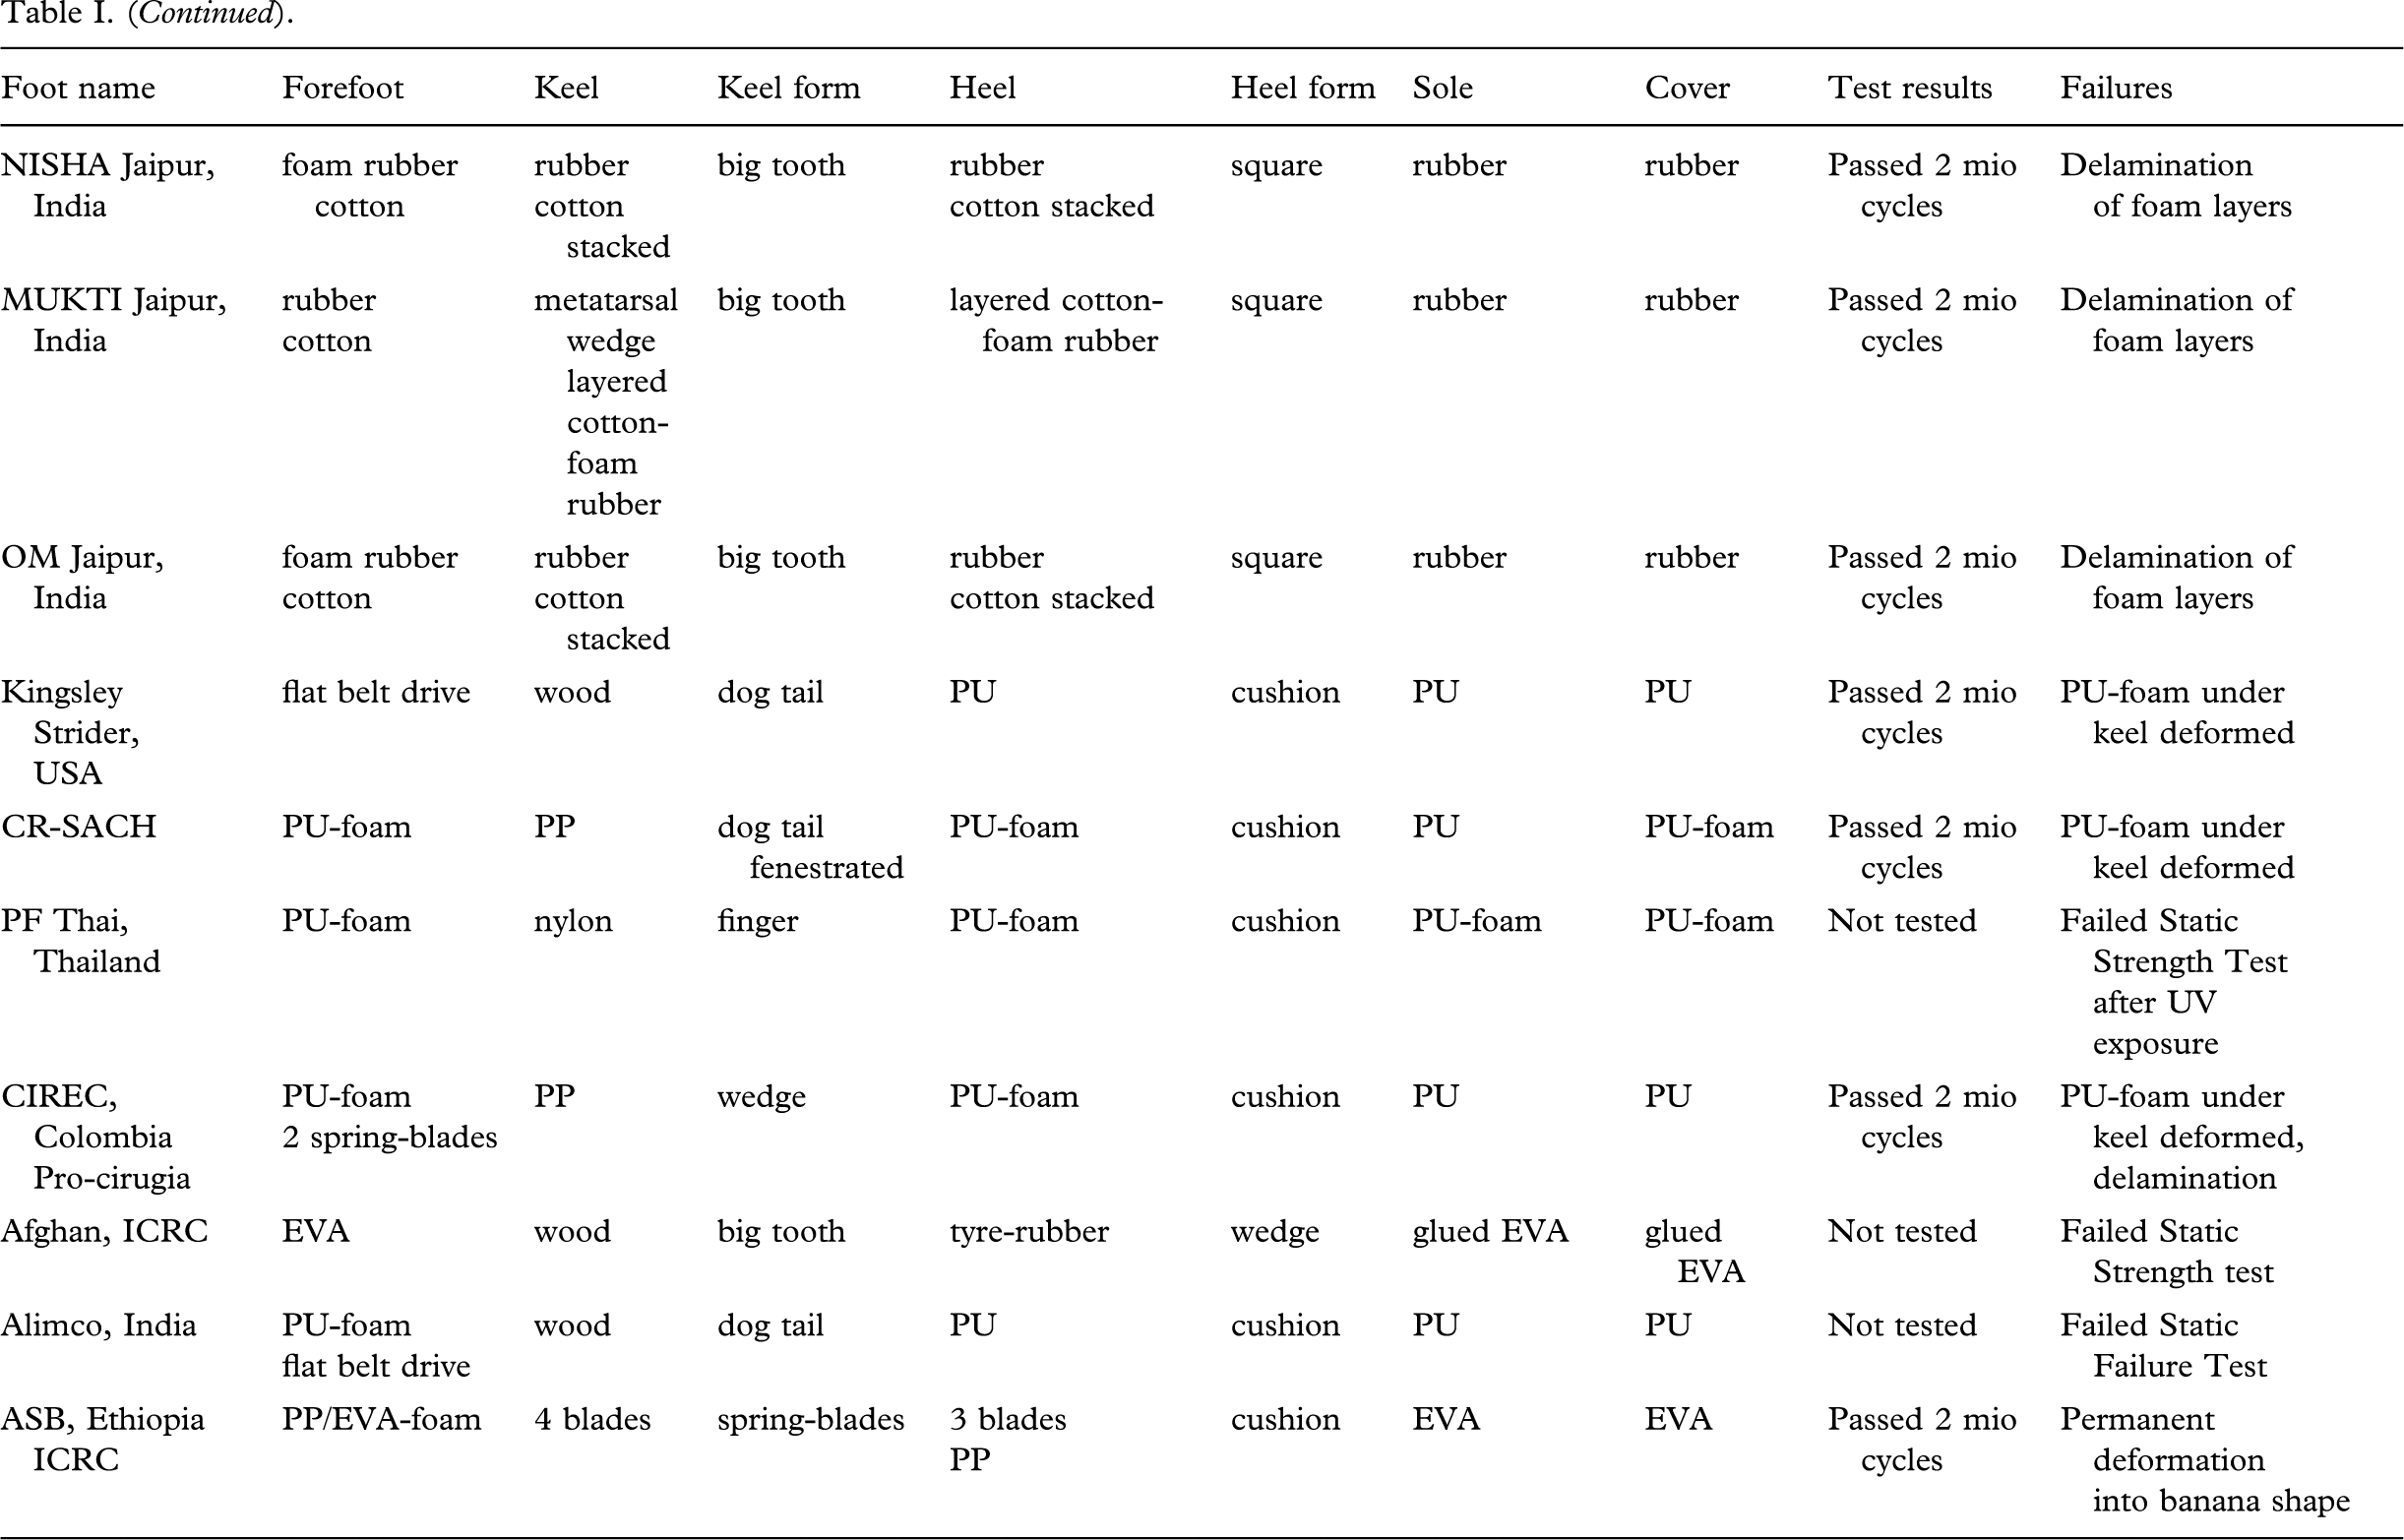
ASB foot.
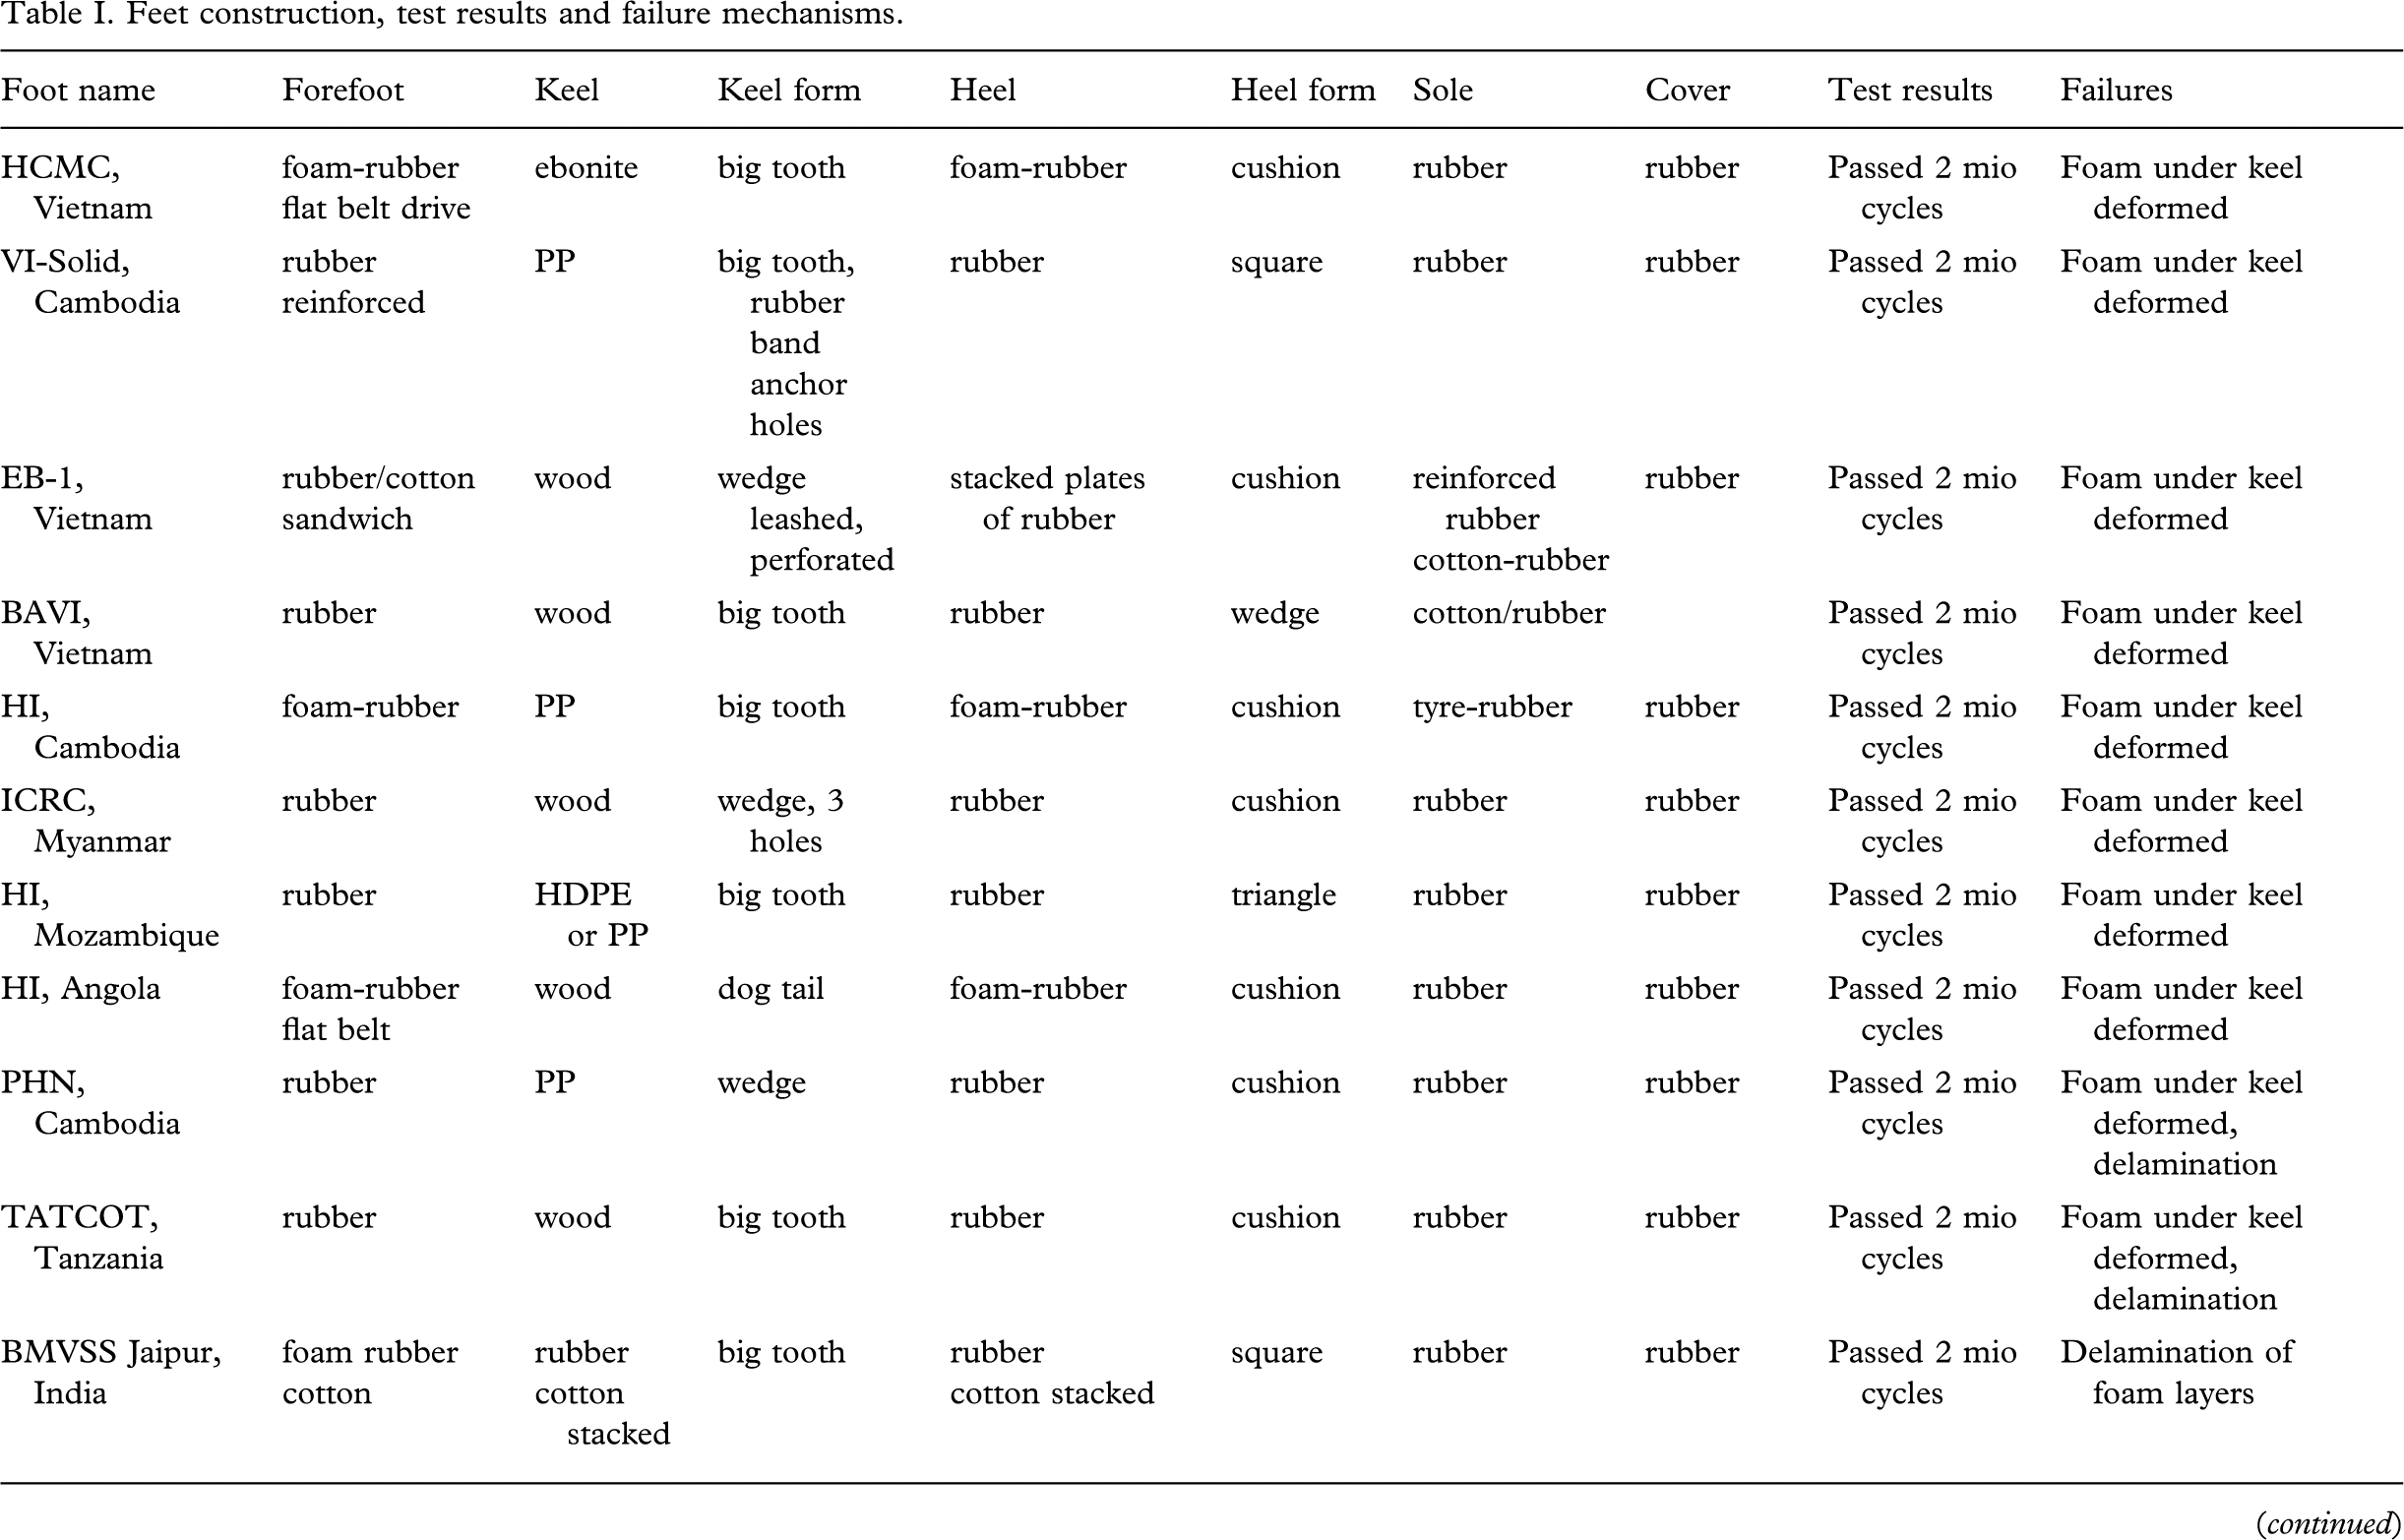
Feet construction, test results and failure mechanisms.
The tests were all conducted at the laboratories of the Department of Orthopaedic Surgery, National University of Singapore. Statistical comparisons were conducted using Student's-t test (unpaired, two-tailed, two-sample, unequal variance).
To simulate the environmental conditions in tropical areas, some foot samples were exposed for 400 h to ultraviolet (UV) light (315 – 400 nm) at 55±3°C for 20 weeks in a specially designed chamber. This exposure simulates 8 h of intense sunlight per day for 365 days. Another subset of feet were kept at high humidity of 98 – 100%PH and a temperature of 38°C in an Envirotronics (Michigan, USA) SH8 chamber for 20 weeks. At the end of these exposures, these feet were subjected to the ISO-10328 static tests only.
ISO 10328 static tests
Mechanical testing of the prosthetic feet used in this study was conducted using the Instron (8874) test machine in accordance with the ISO specifications. The angles between the load line and the load application plates simulate the attitude of human's feet at key points in the stance phase of walking. This was achieved by mounting the feet in a jig with an inclination of 20° and 15° for testing of forefoot and testing of heel respectively. ISO test loading level P5 was applied, which is based on data from a wide range of amputees including a few whose body mass exceeded 100 kg.
Static proof test
The prosthetic feet were tested in two sessions, one for the forefoot and one for the heel. In the Static Proof Test, a load of 2240 N was applied to the forefoot. This proof load represents an occasional momentary overload that can be sustained by the foot unit without significant loss of function. After testing of the forefoot, the heel was then tested with the same load. The specified loading was applied at a rate of between 100 N/s and 250 N/s. The null-point for measuring deformation was recorded when the load had reached 50 N. After the maximum load of 2240 N was reached for both the forefoot and heel, this load was held for 30±3 sec and then removed. The deformation at the maximum load was measured, as was the permanent deformation after unloading to 50 N.
In Static Proof testing of the forefoot and the heel, if any areas fractured during the testing or were unable to reach the specified maximum load, or if the permanent deformation exceeded 5 mm, the foot will have failed the Static Proof Test (ISO-10328, clause 16.2.1.2).
Static strength test
The configurations of the forefoot and heel were the same as those used in the Static Proof Test but the maximum load specified in the Static Strength test is 4480 N. This load is applied at a rate of between 100 and 250 N/s. As before, if any areas fracture during the testing or are unable to reach the specified maximum load, the foot will have failed the Static Strength test. After the maximum load of 4480 N was reached for both the forefoot and heel, it was immediately unloaded. The deformation after this maximum load was measured as well as the permanent deformation after unloading to 50 kN.
The Ultimate Static Load, by loading the foot to the point of structural failure after the conclusion of the Cyclic Testing, determines the maximum single load that can be sustained. This test was omitted to permit inspection of the internal foot elements immediately following the Cyclic Test.
Cyclic foot testing
The testing machine applied dynamic loads to the forefoot and the heel up to the specified maximum load of 1330 N followed by unloading to 50 N. The cyclic loading was performed at a speed of 1 Hz for two million cycles using two computer-controlled hydraulic pistons. The loads are transmitted at the same angular position relative to the prosthetic foot (forefoot: 20°, heel: 15°) through load application plates, which contain multiple bearings to minimize the friction between the plates and the the foot. As before, the loading was carried out at the rate of between 100 and 250 N/s and if any of the areas fracture or are unable to reach the specified maximum load, the foot fails the Cyclic Test.
At the end of the cyclic testing period, all prosthetic feet were sliced into half longtitudinally to permit visual examination of the internal structural morphology.
Results
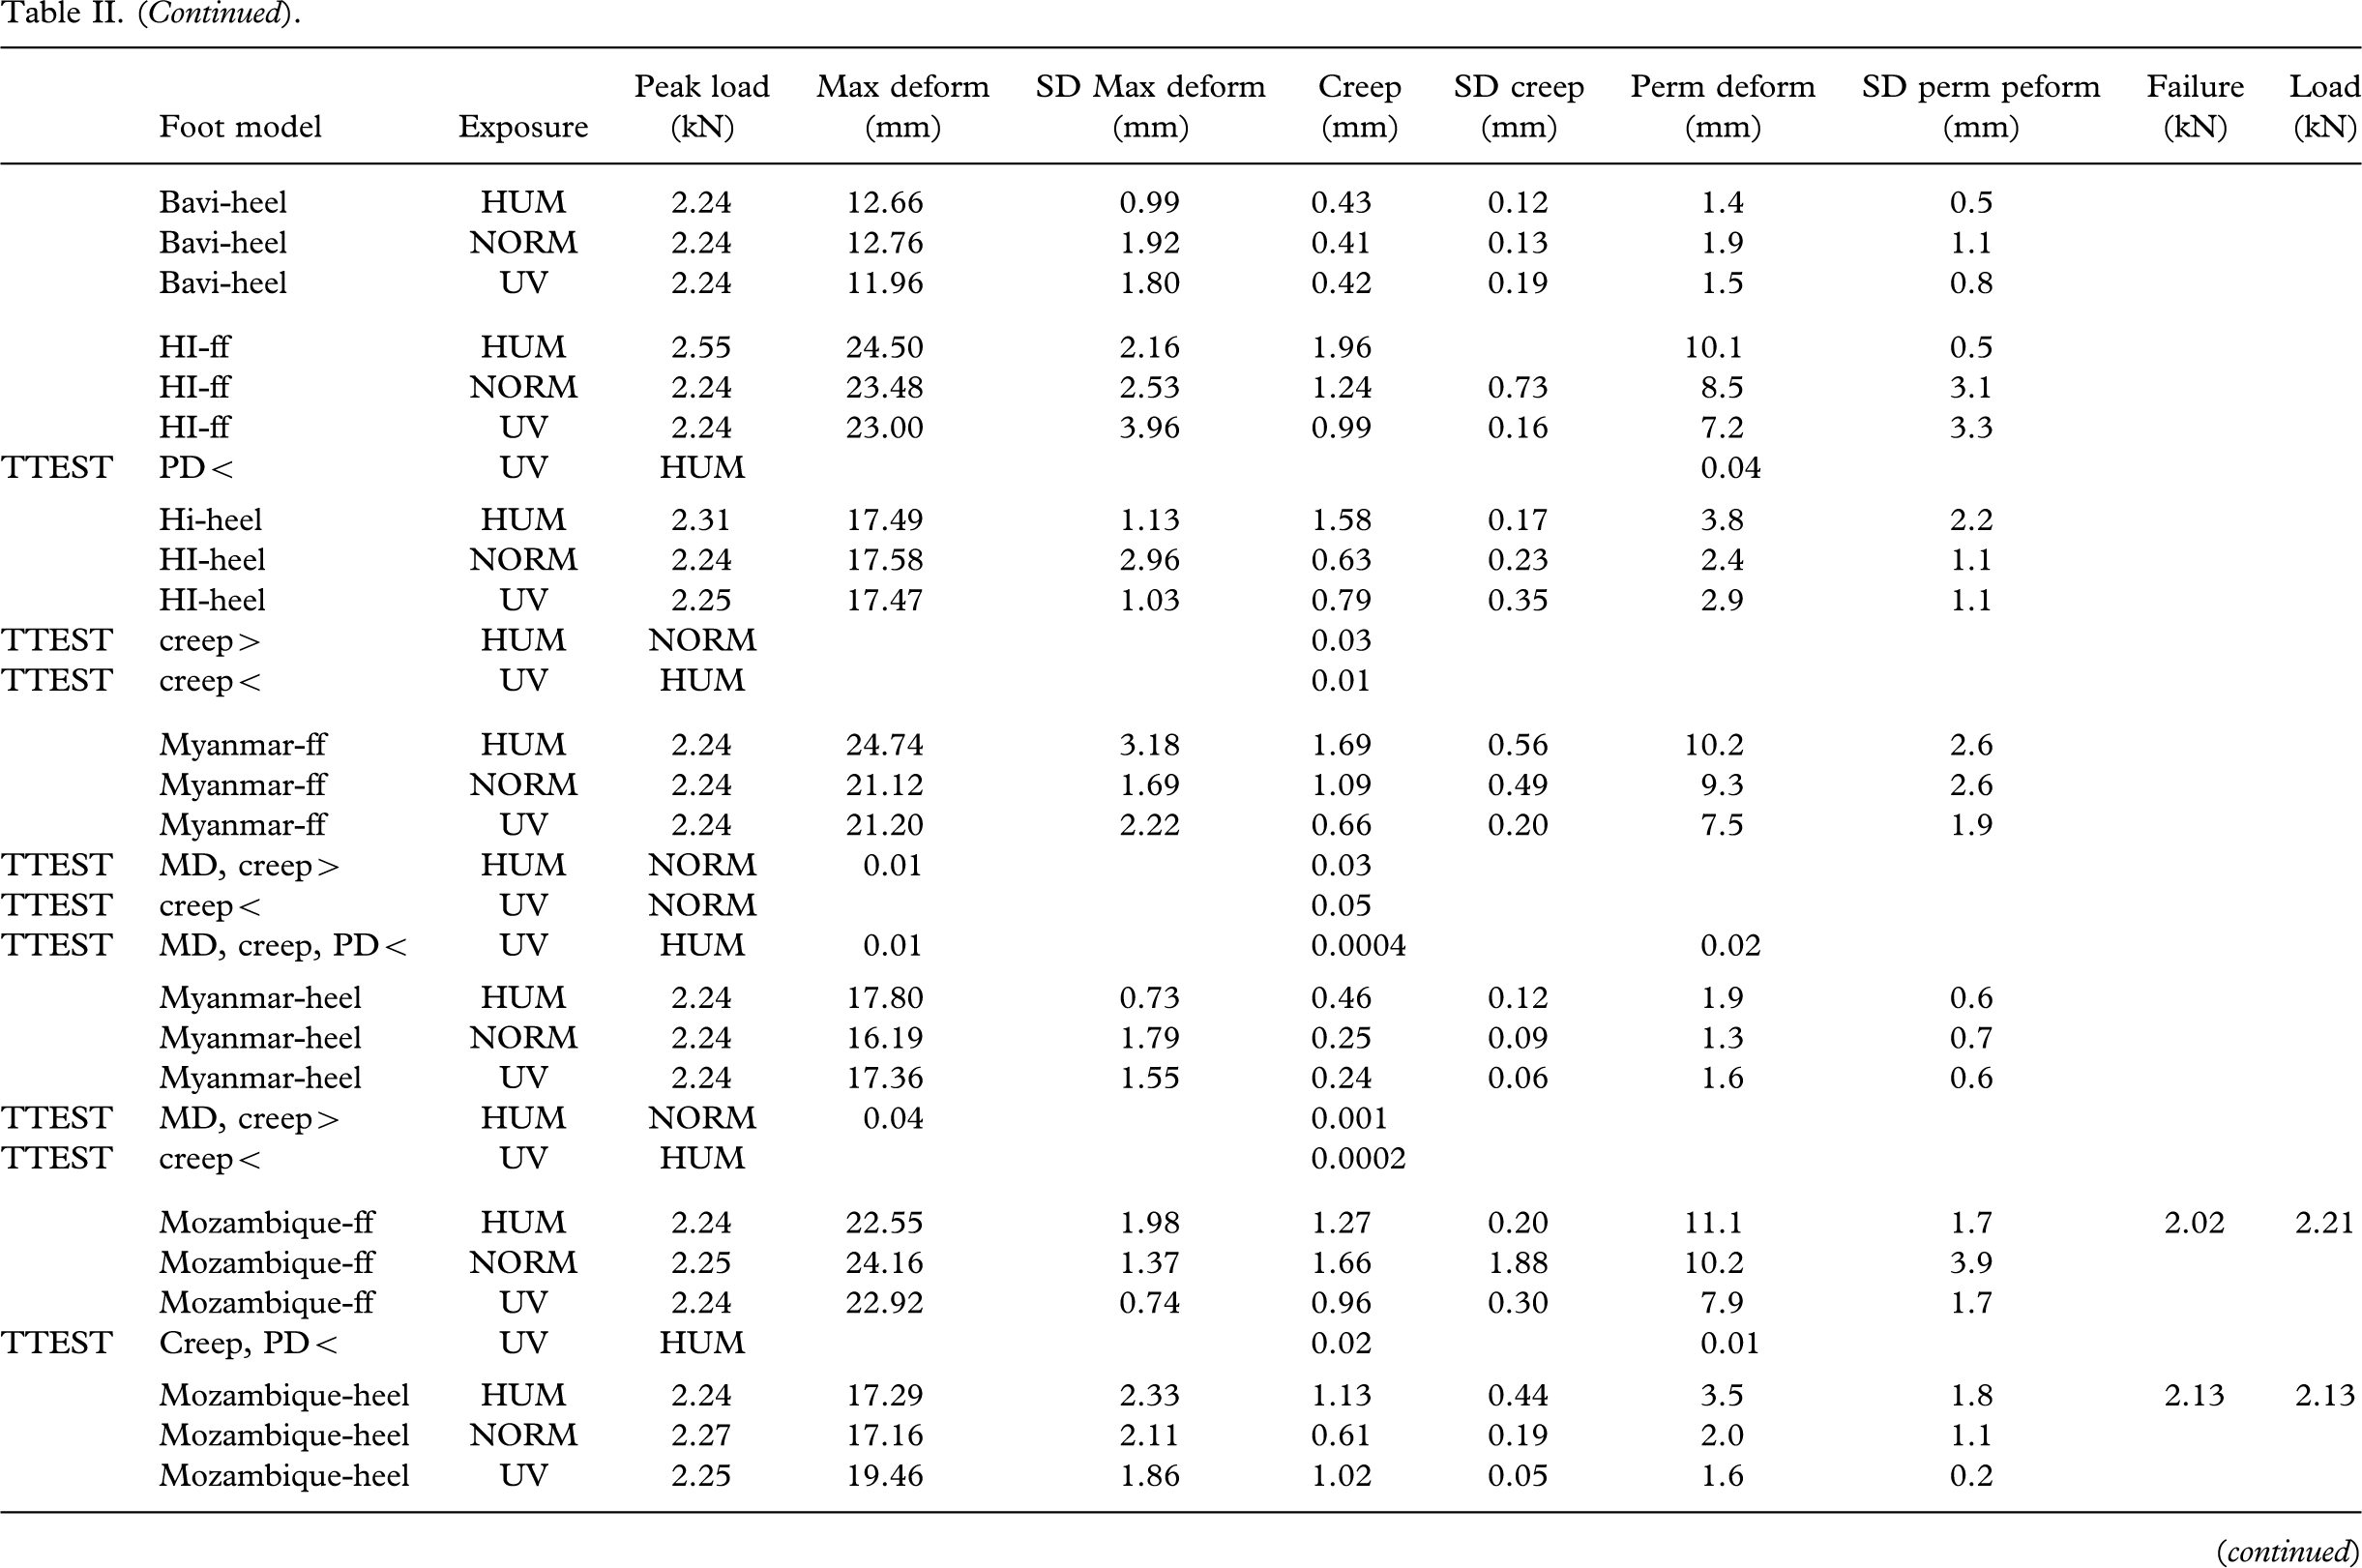
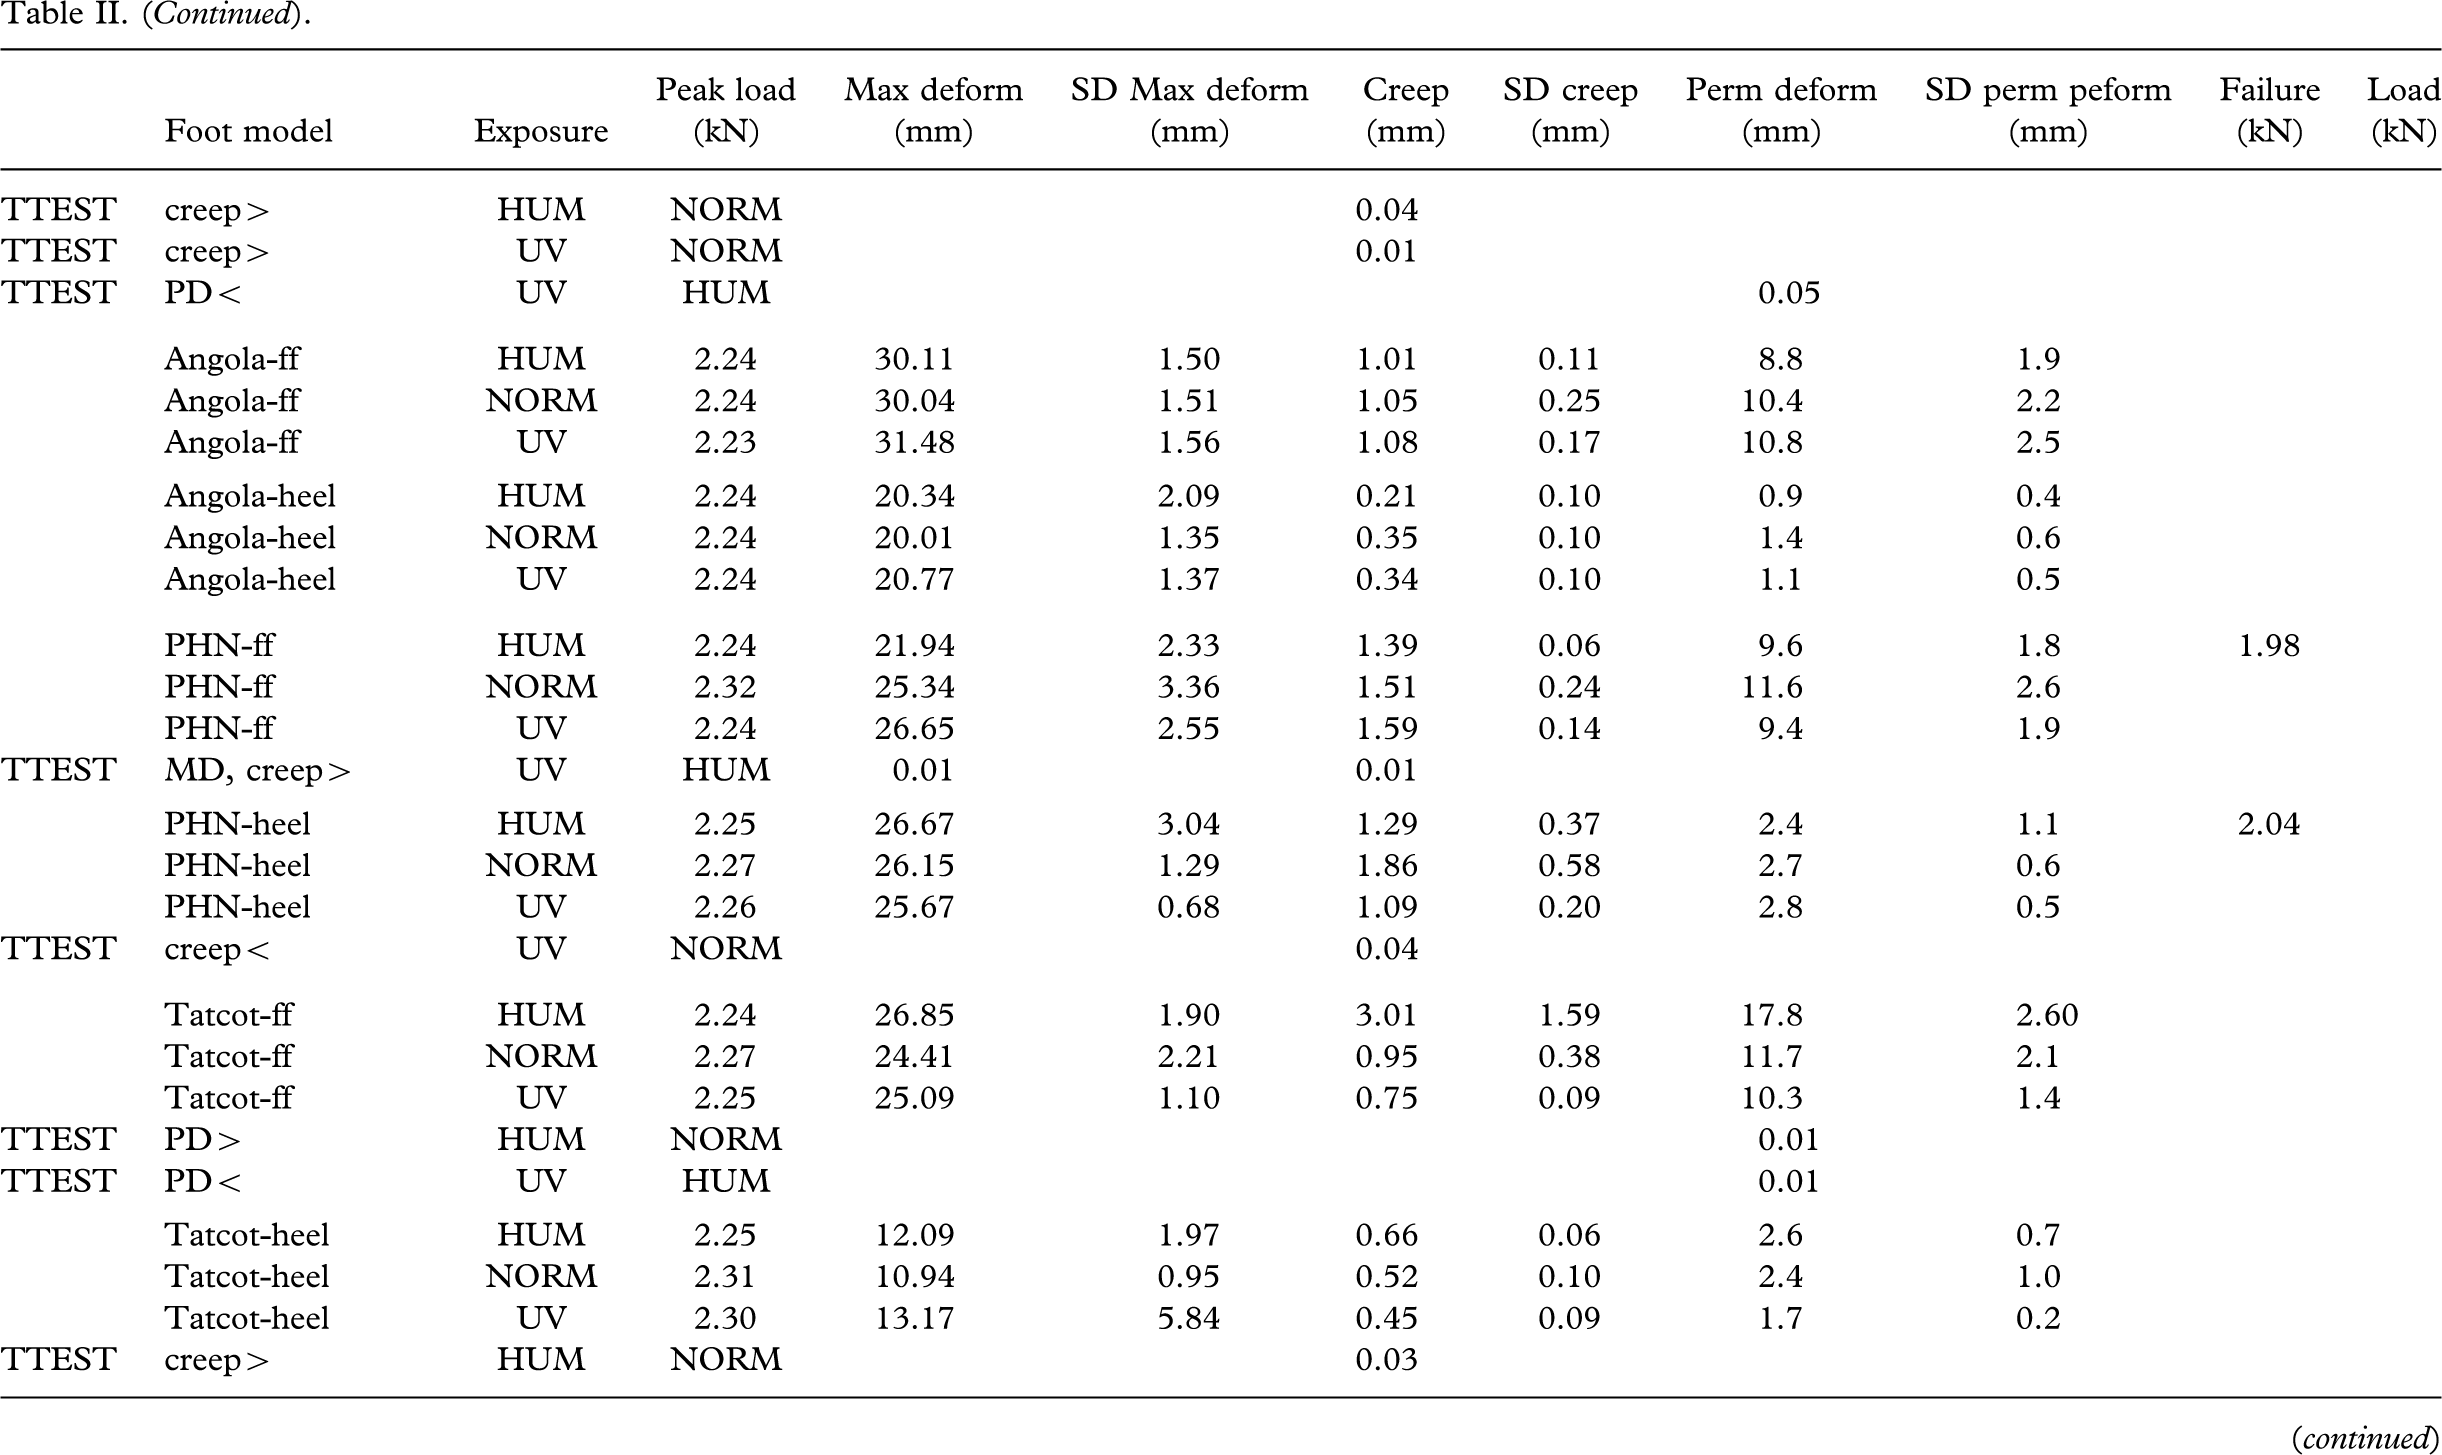
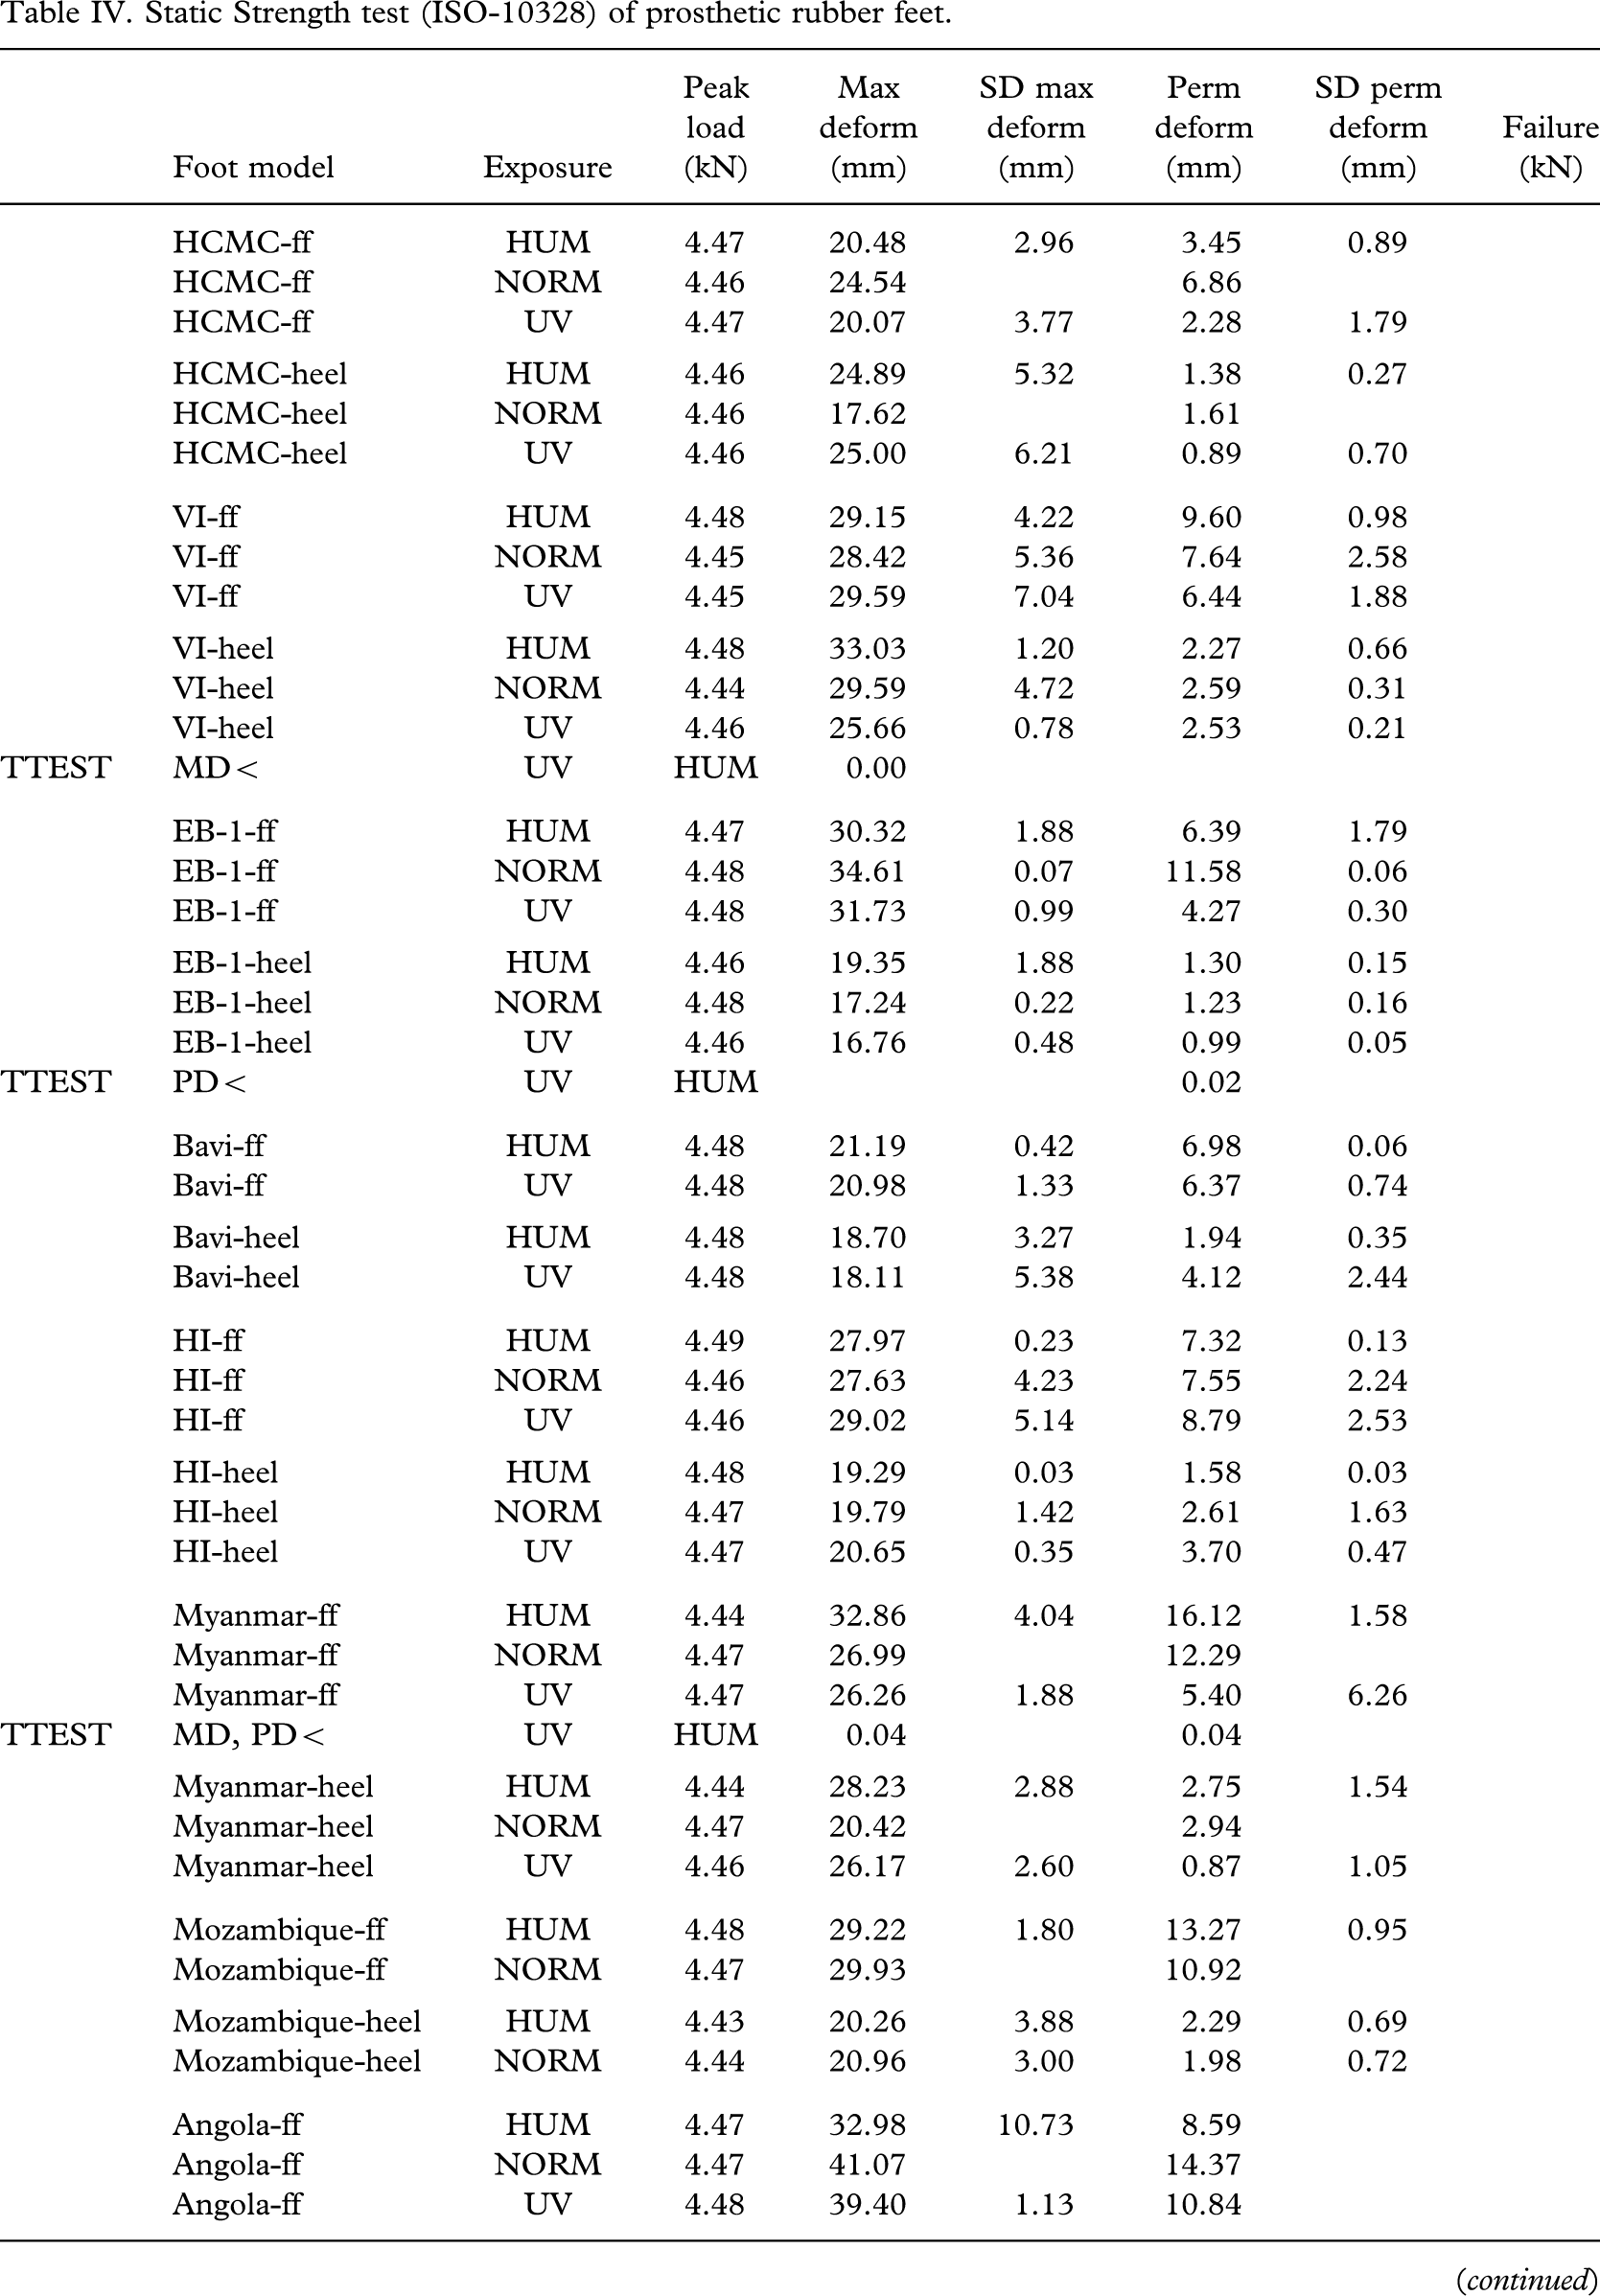
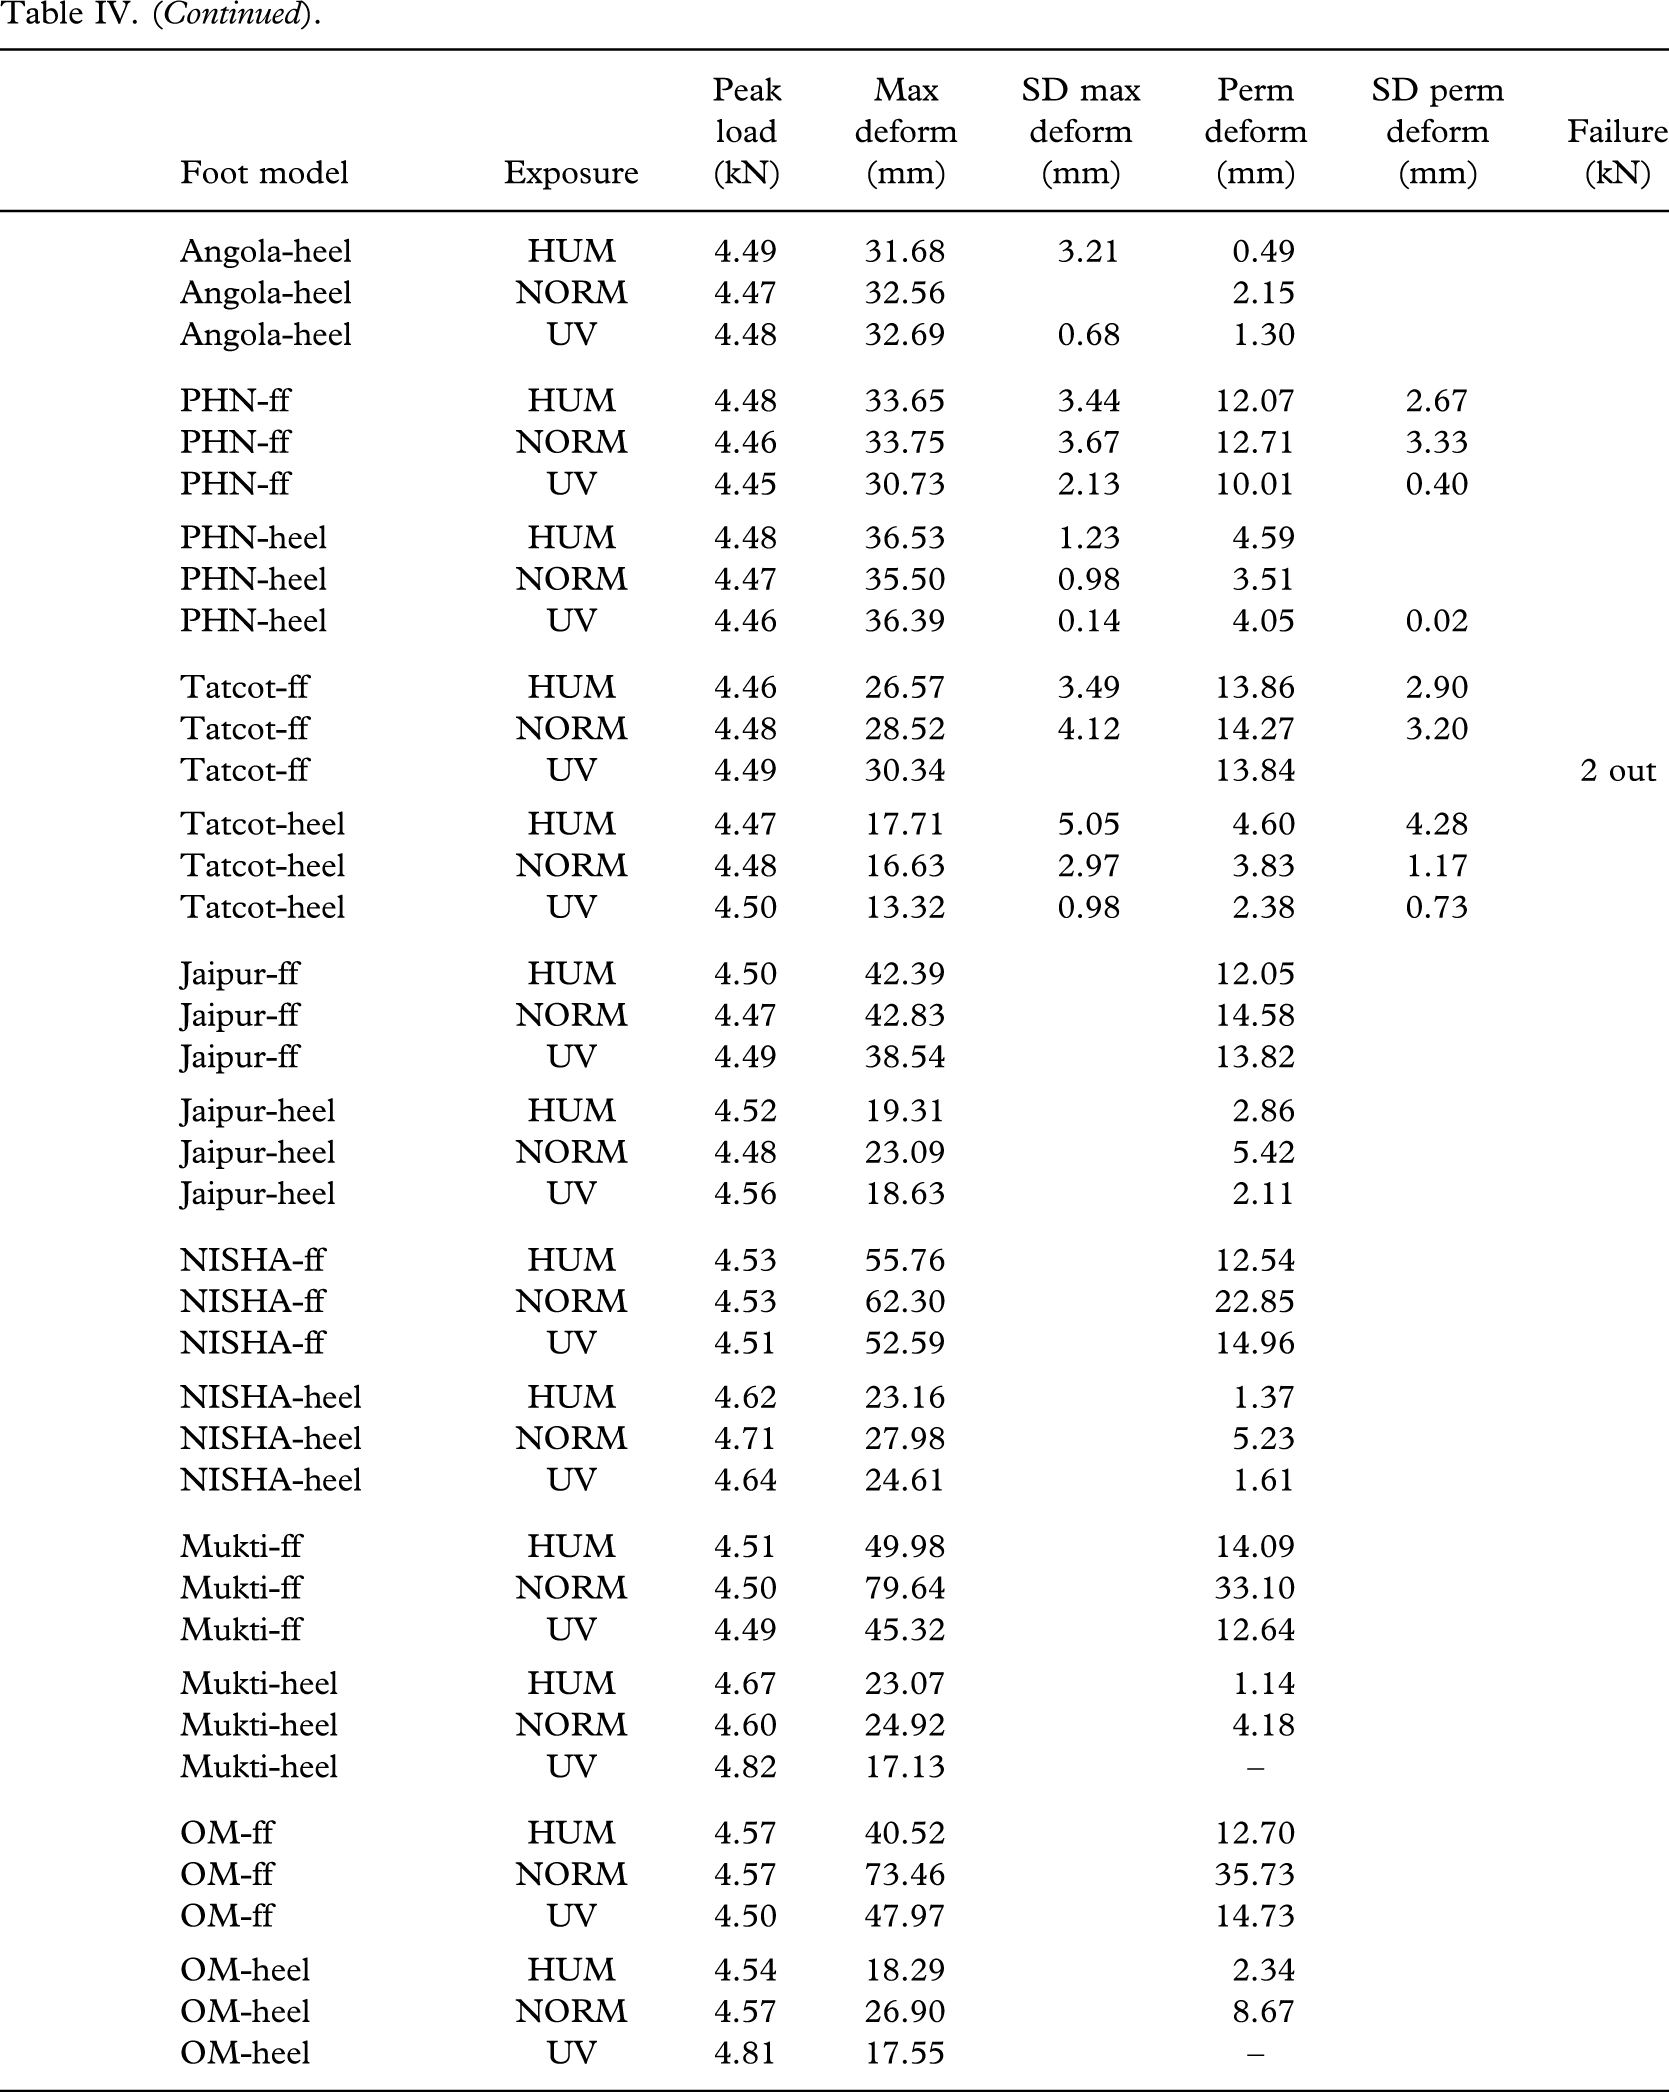
Failure to reach the required load of 2240 N in Static Proof testing was demonstrated in 8 rubber feet after humidity exposure and 1 after exposure to UV light (Table II) and in 3 PU feet from Alimco, India after UV exposure (Table III). The Static Failure strength test to a load of 4480 N was not passed by 2 TATCOT rubber feet after UV exposure (Table IV), and by 1 Alimco foot after humidity exposure (Table V). One PF-Thai forefoot fractured at this level of loading.
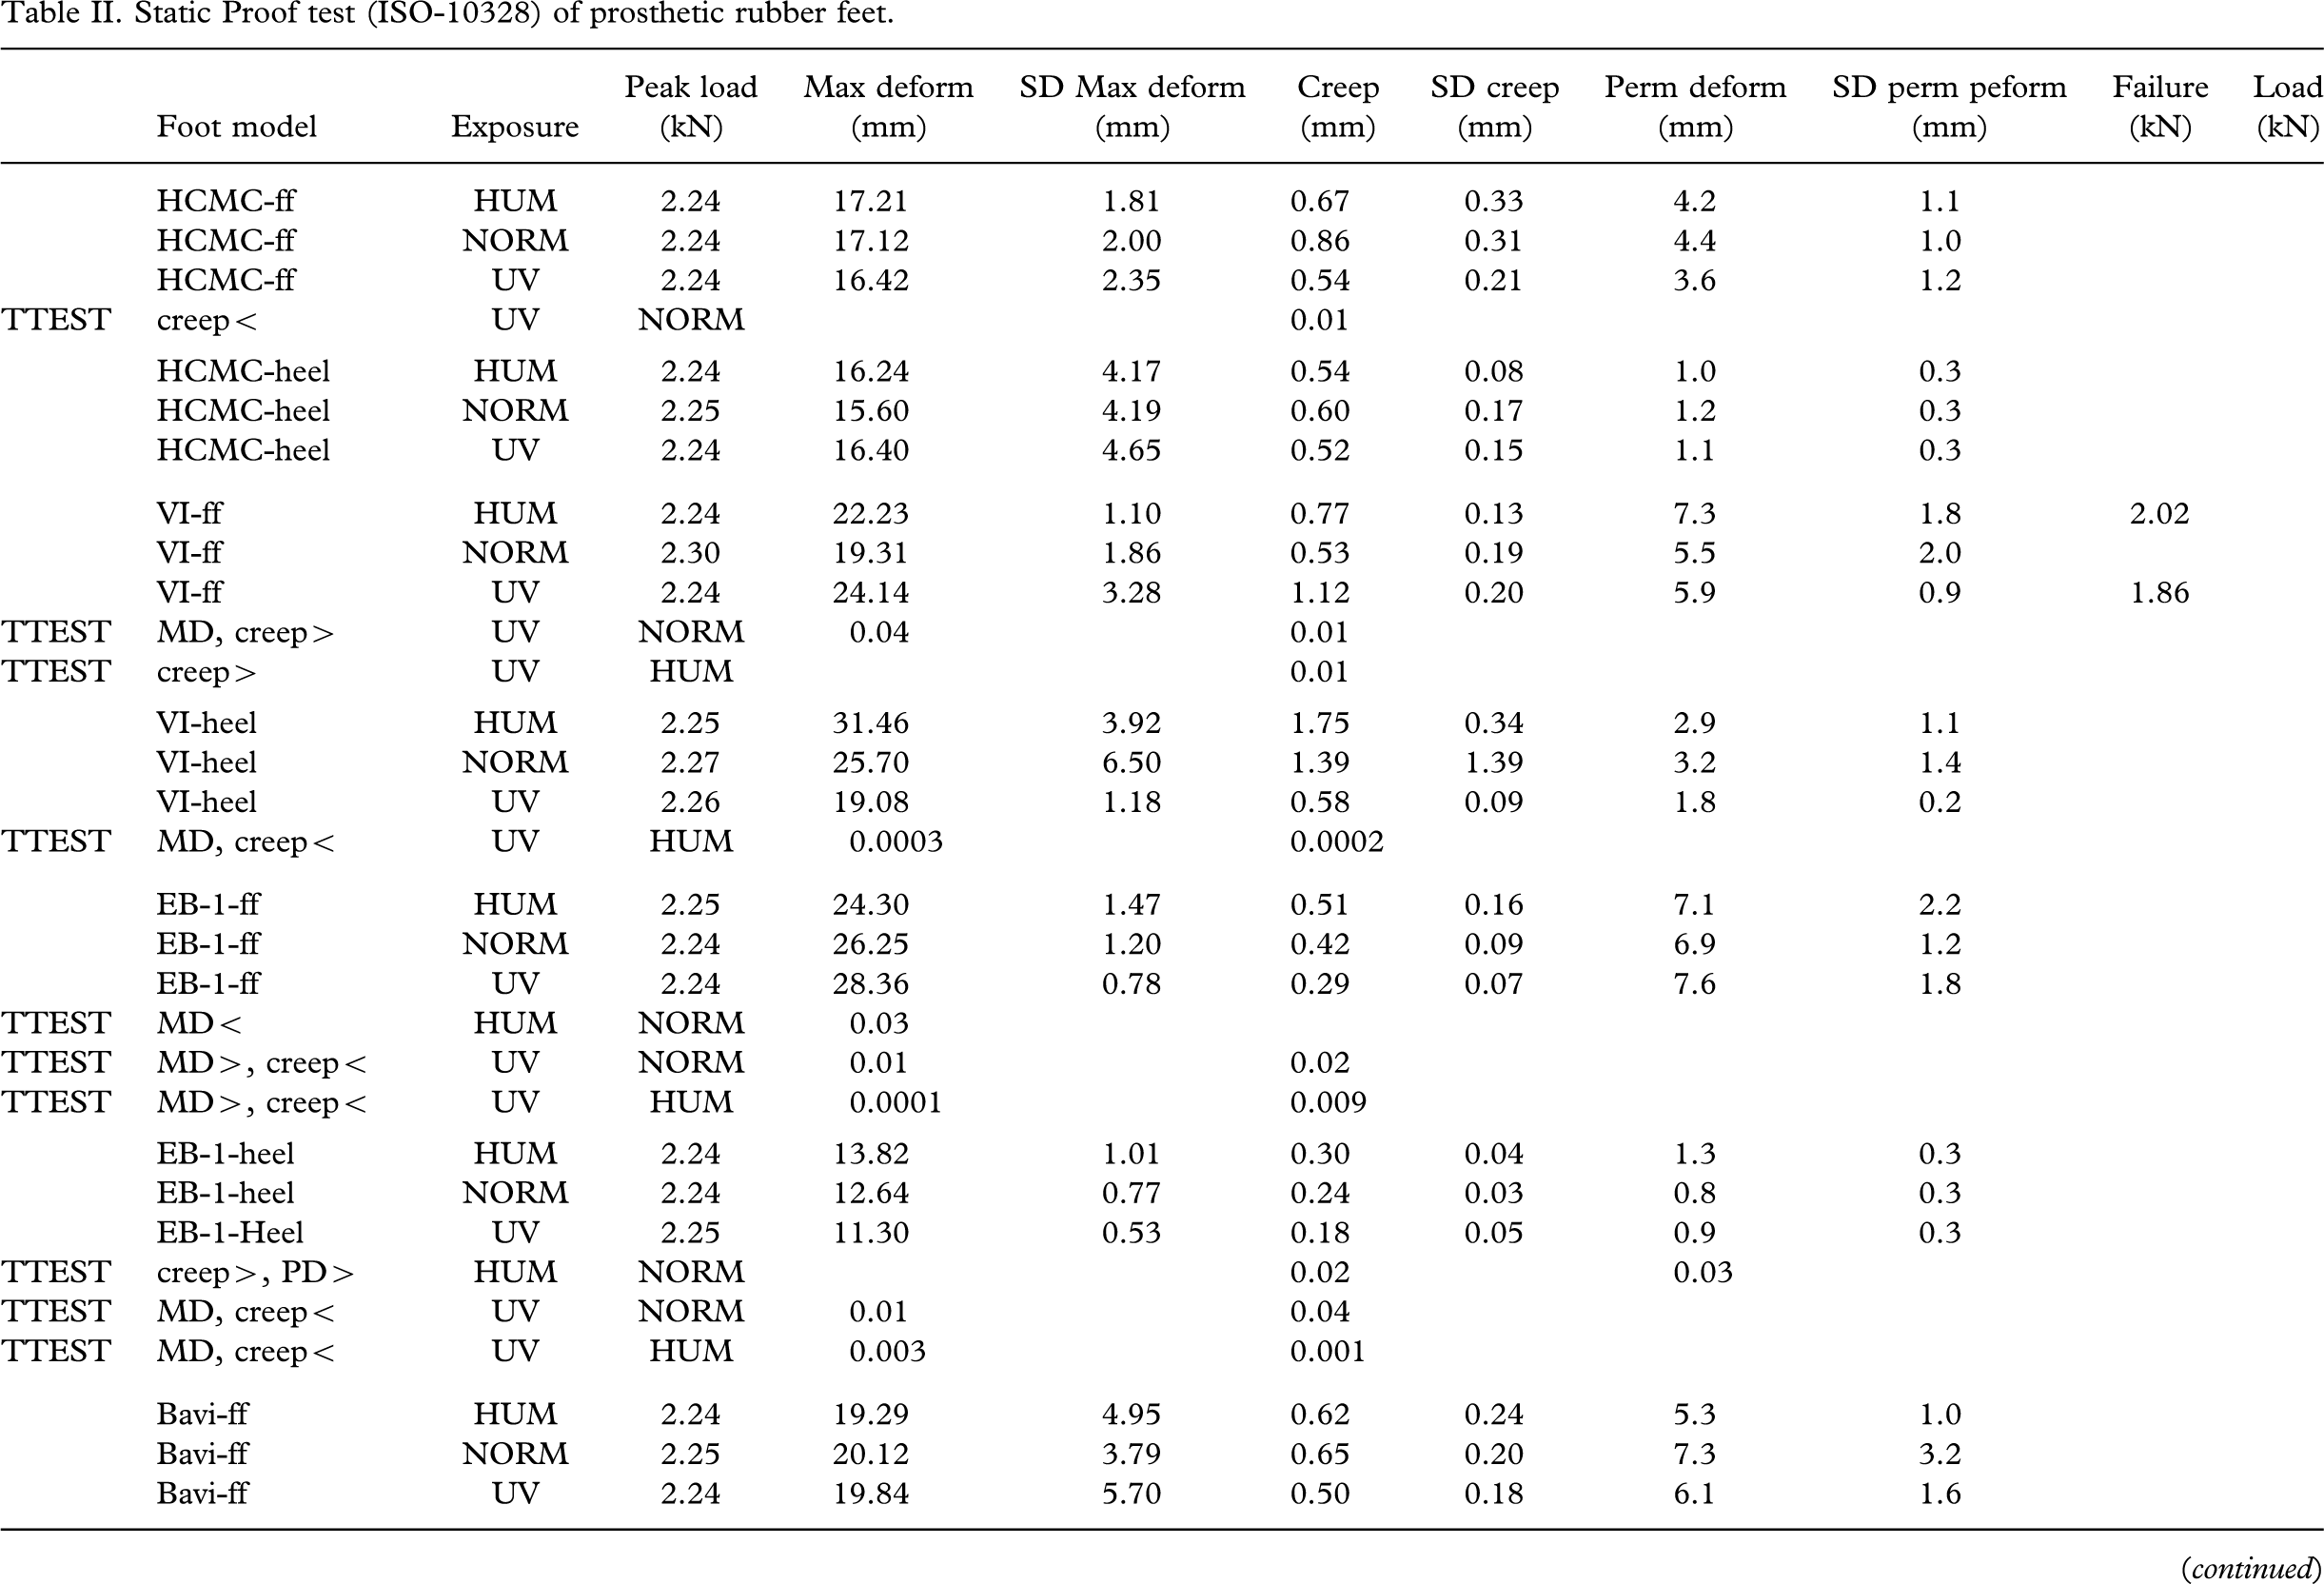
Static Proof test (ISO-10328) of prosthetic rubber feet.
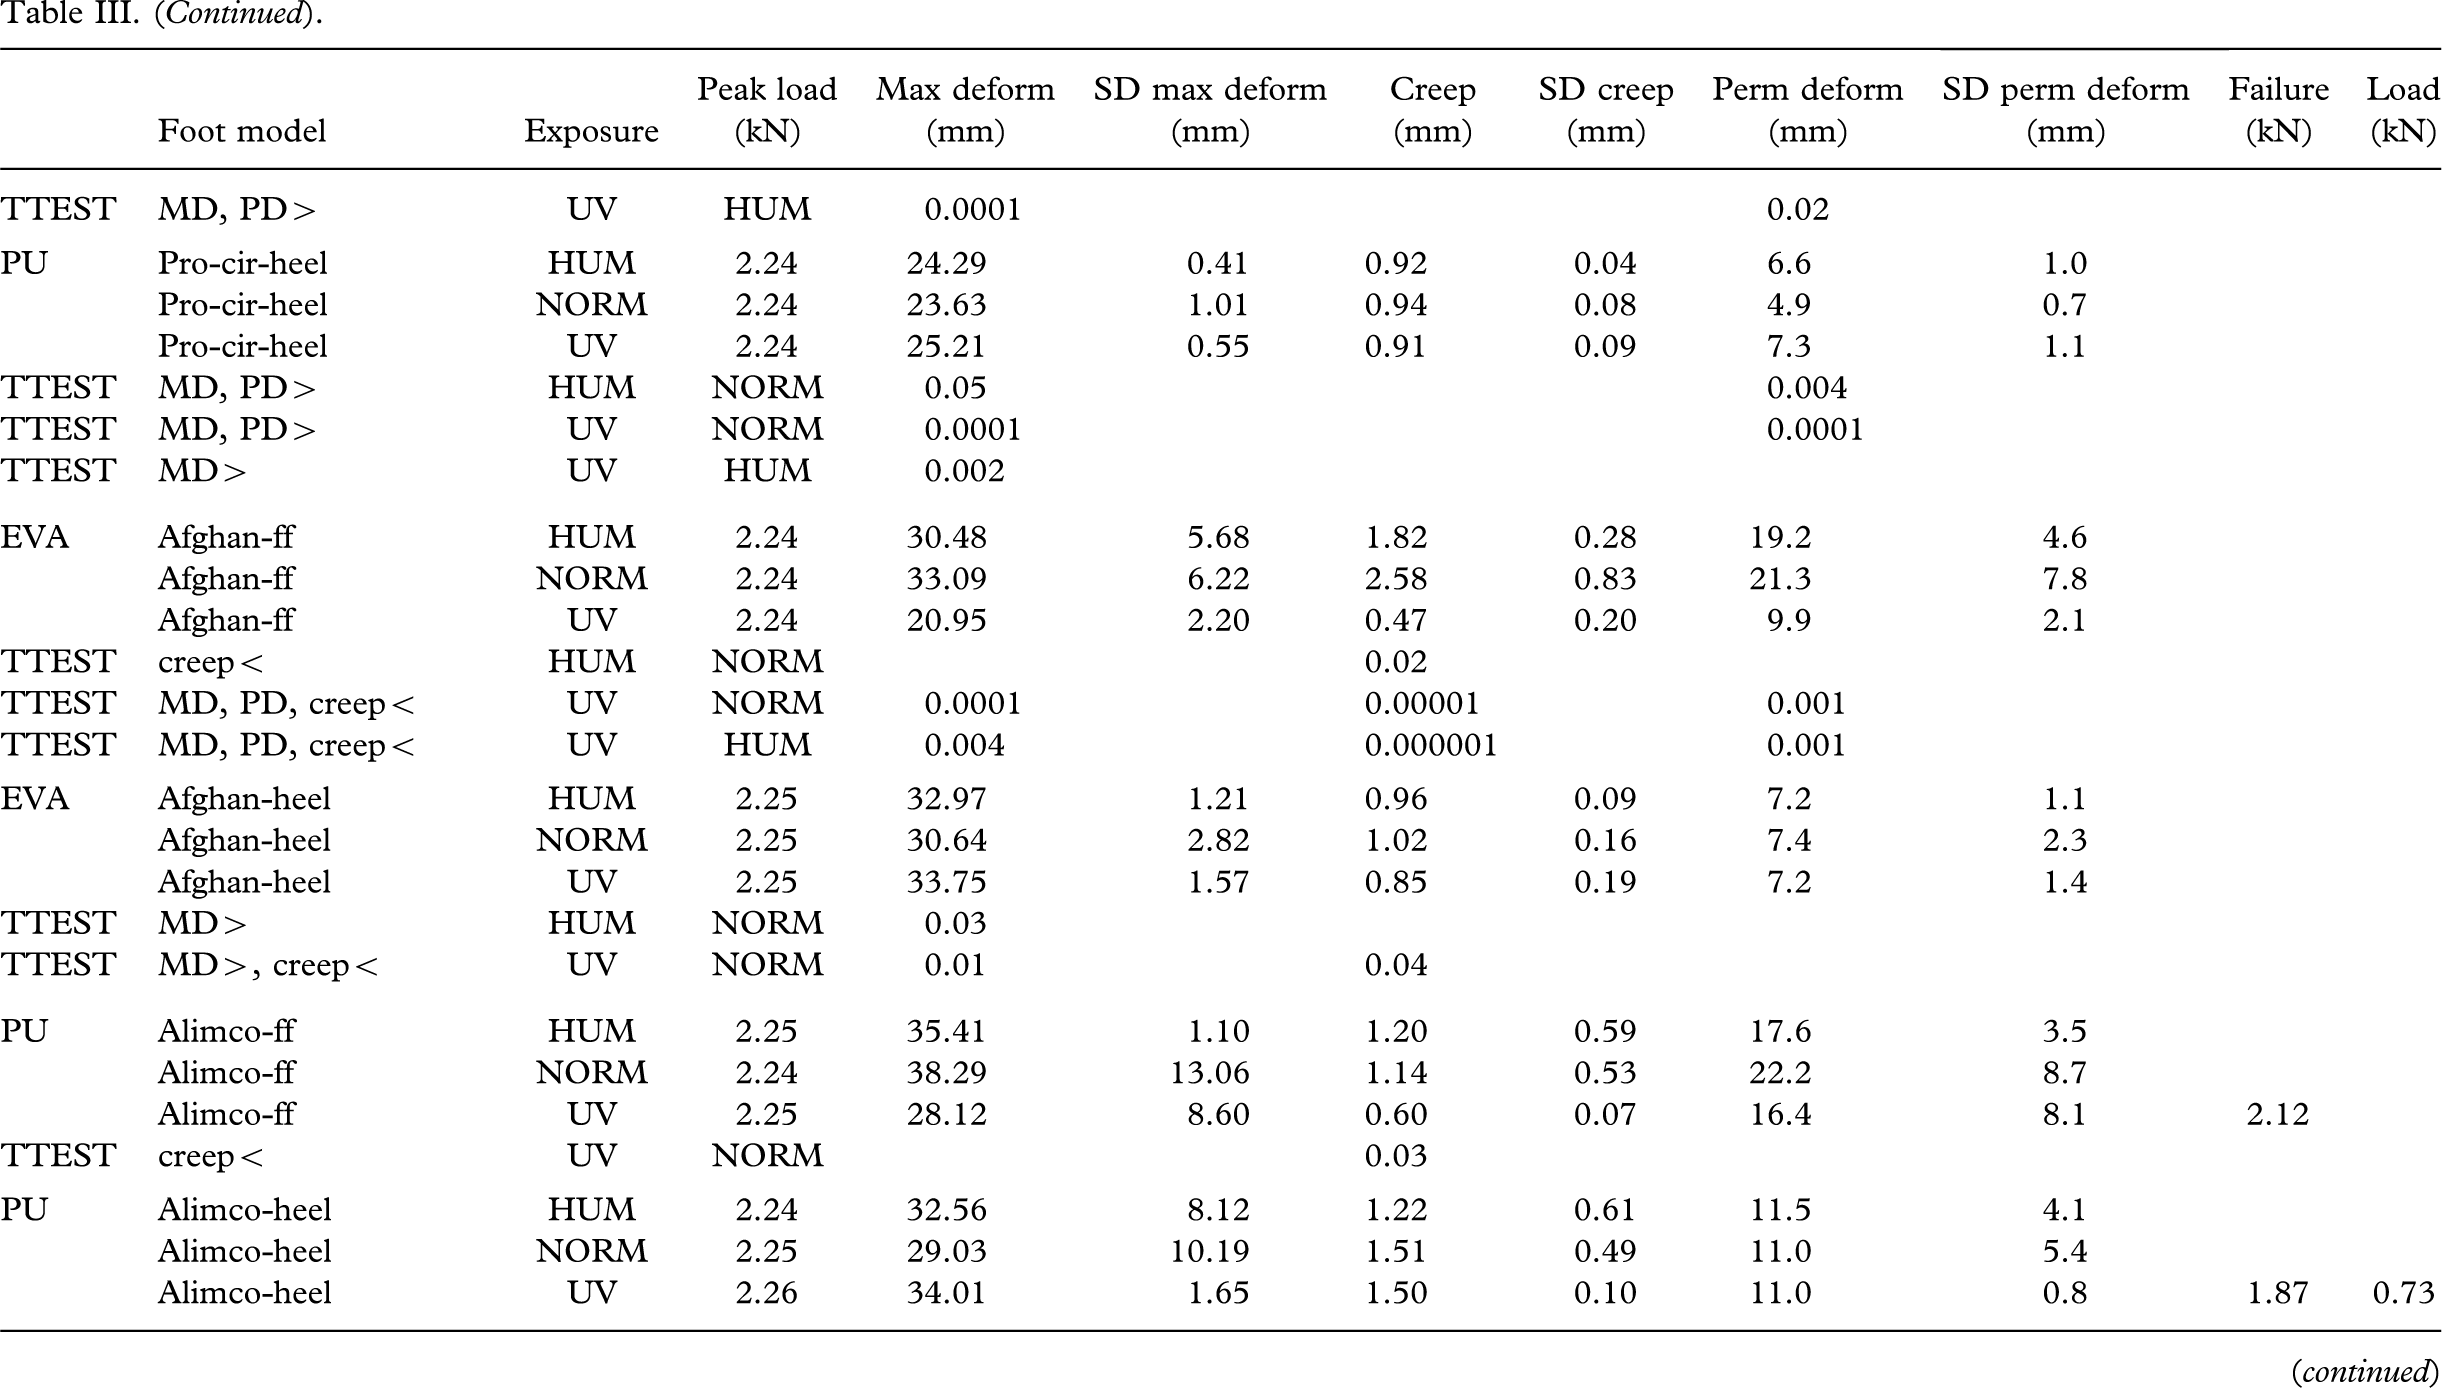
Static Proof test (ISO-10328) of prosthetic polymer feet.
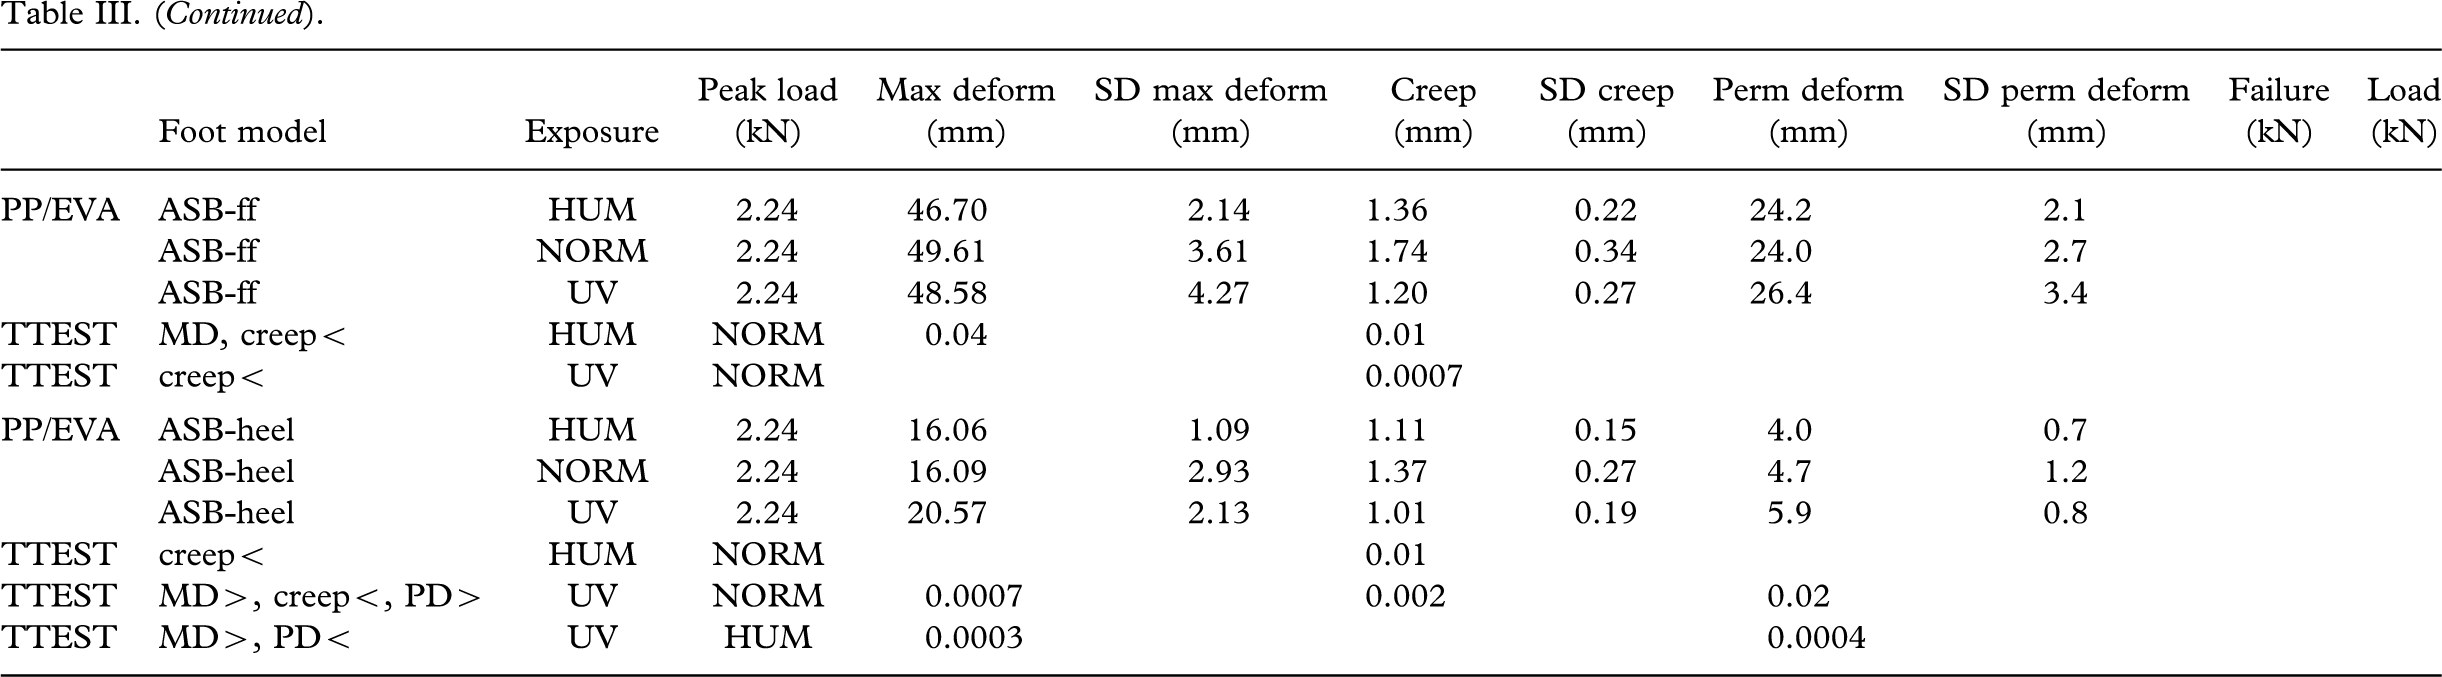
Static Strength test (ISO-10328) of prosthetic rubber feet.
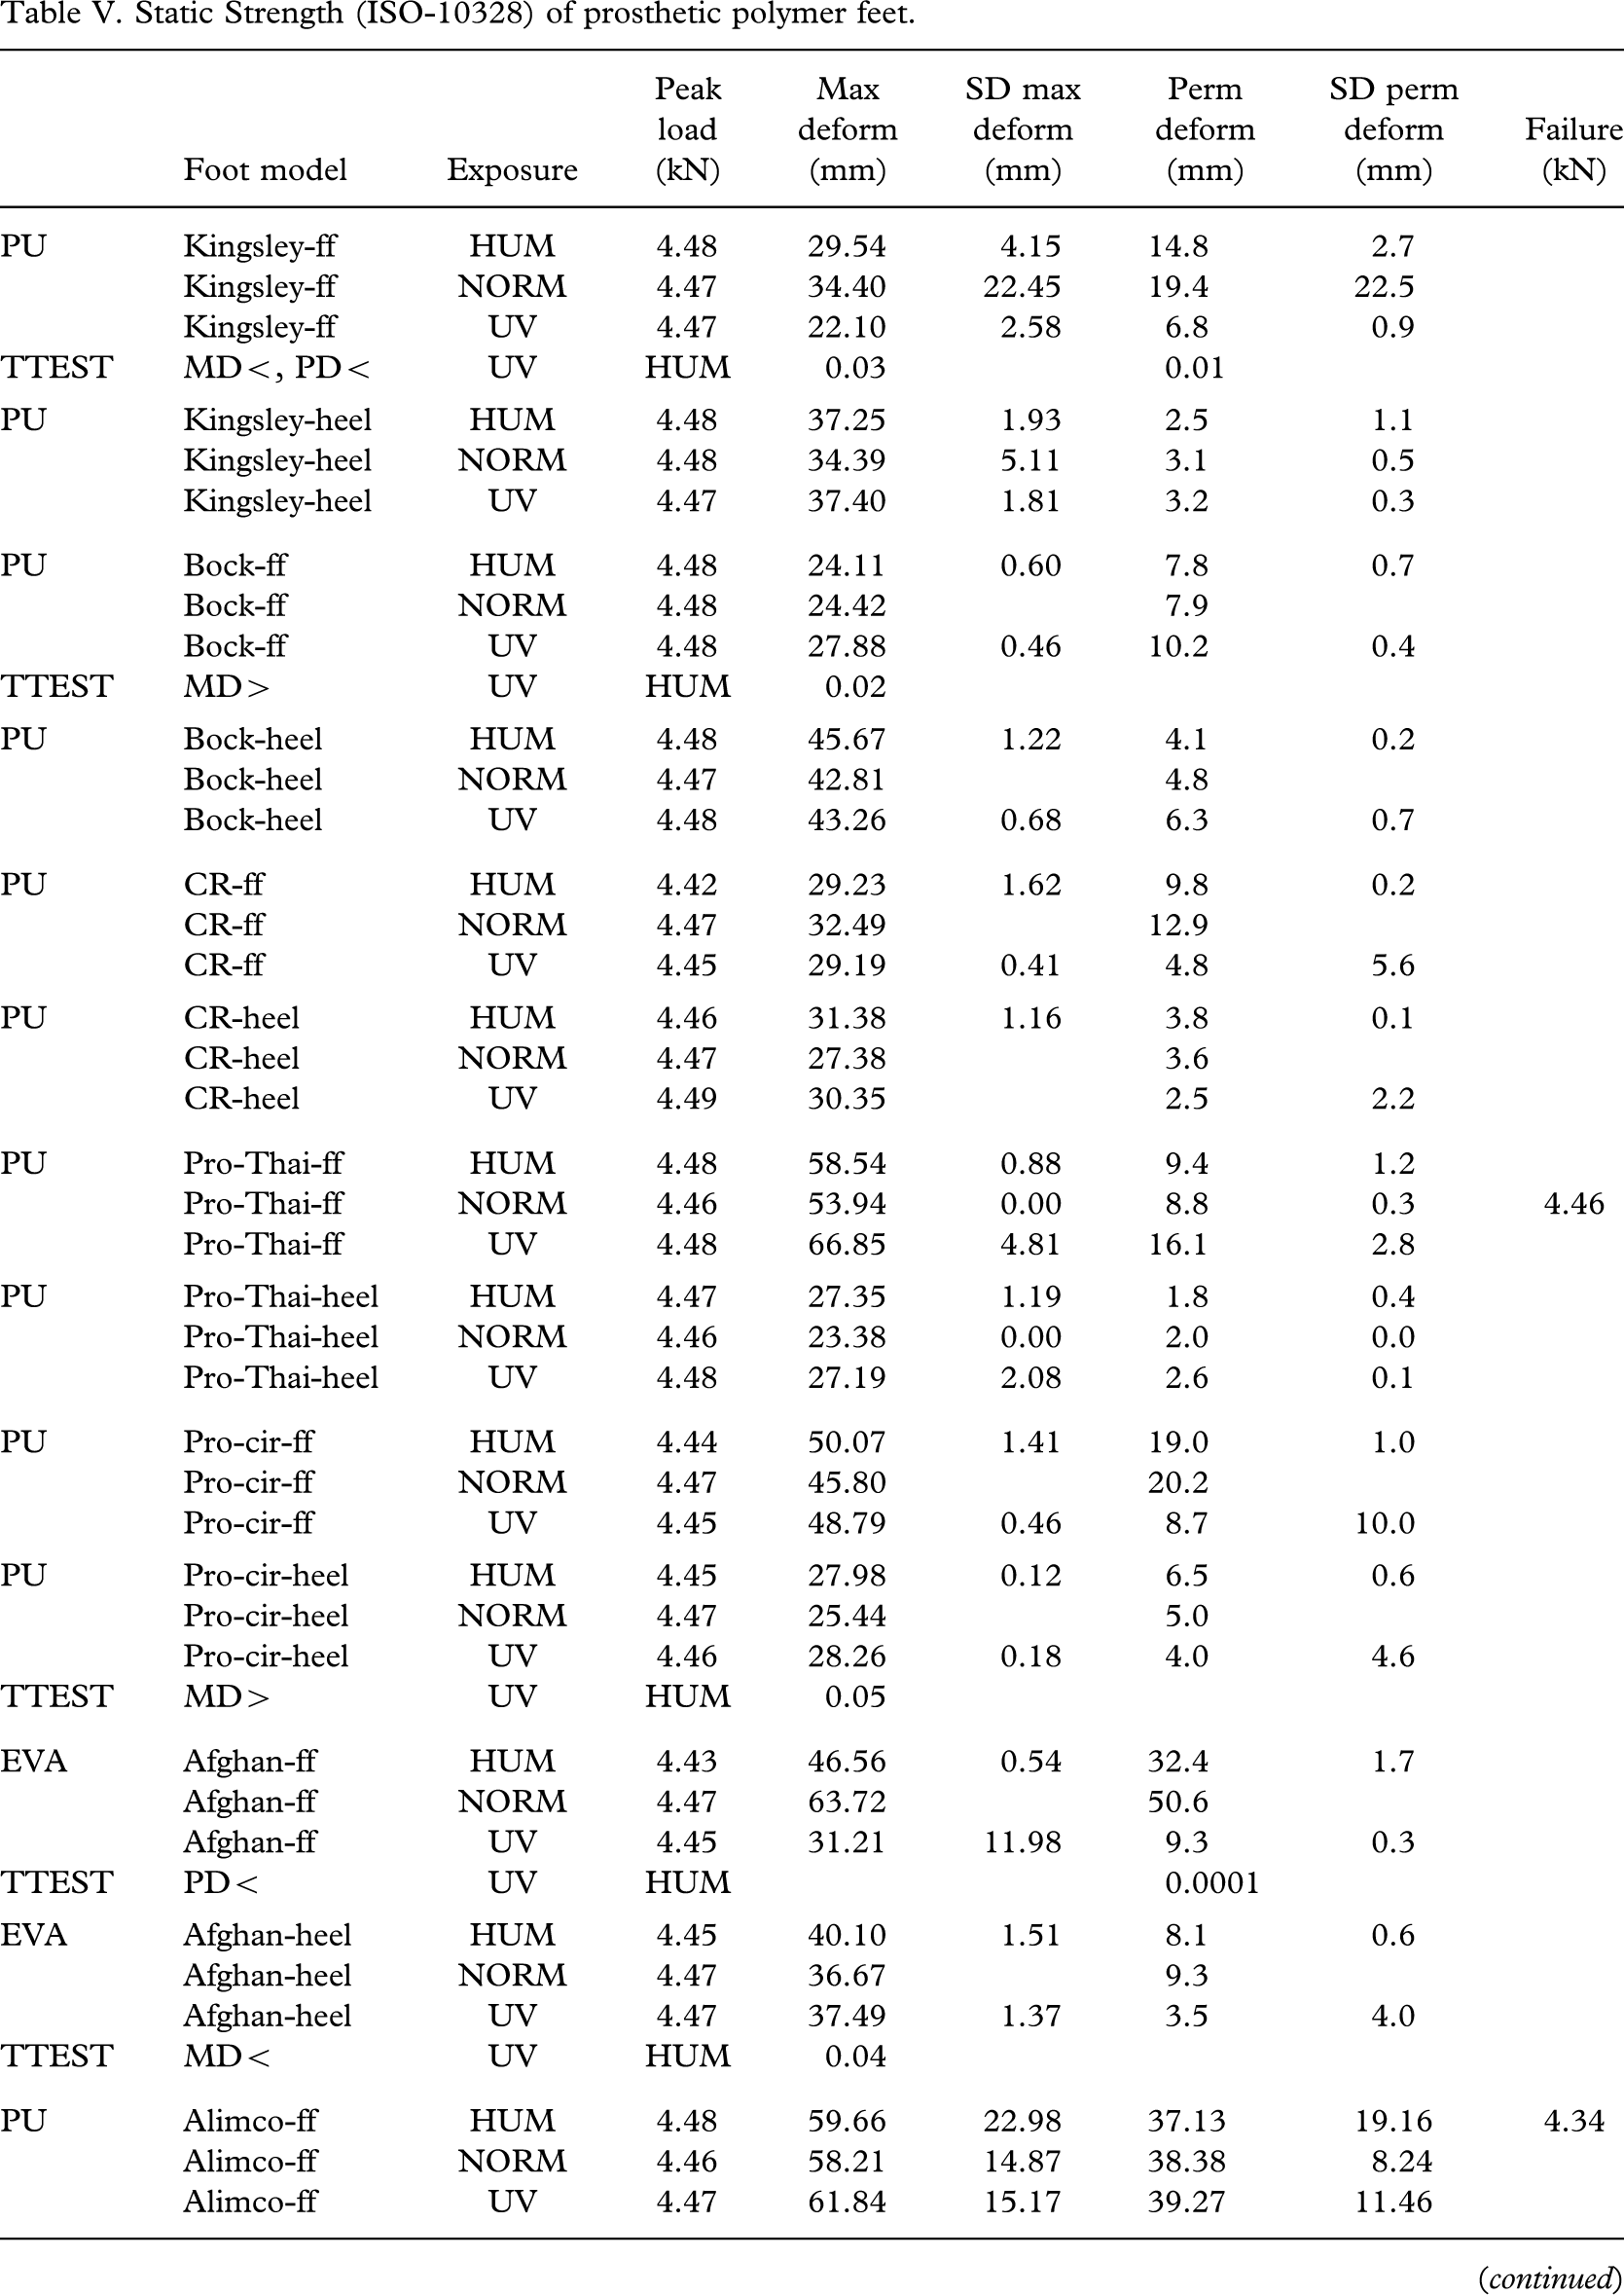
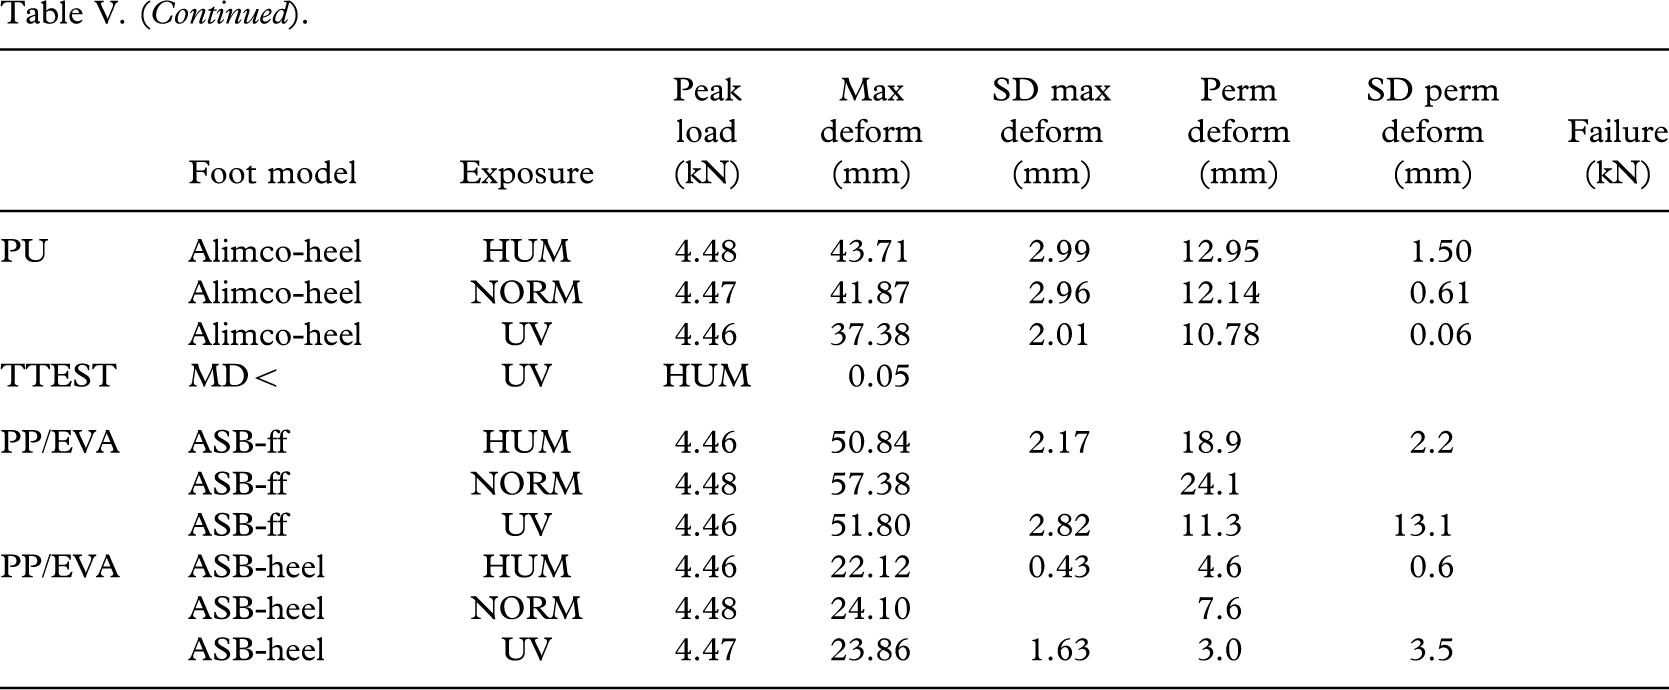
Static Strength (ISO-10328) of prosthetic polymer feet.
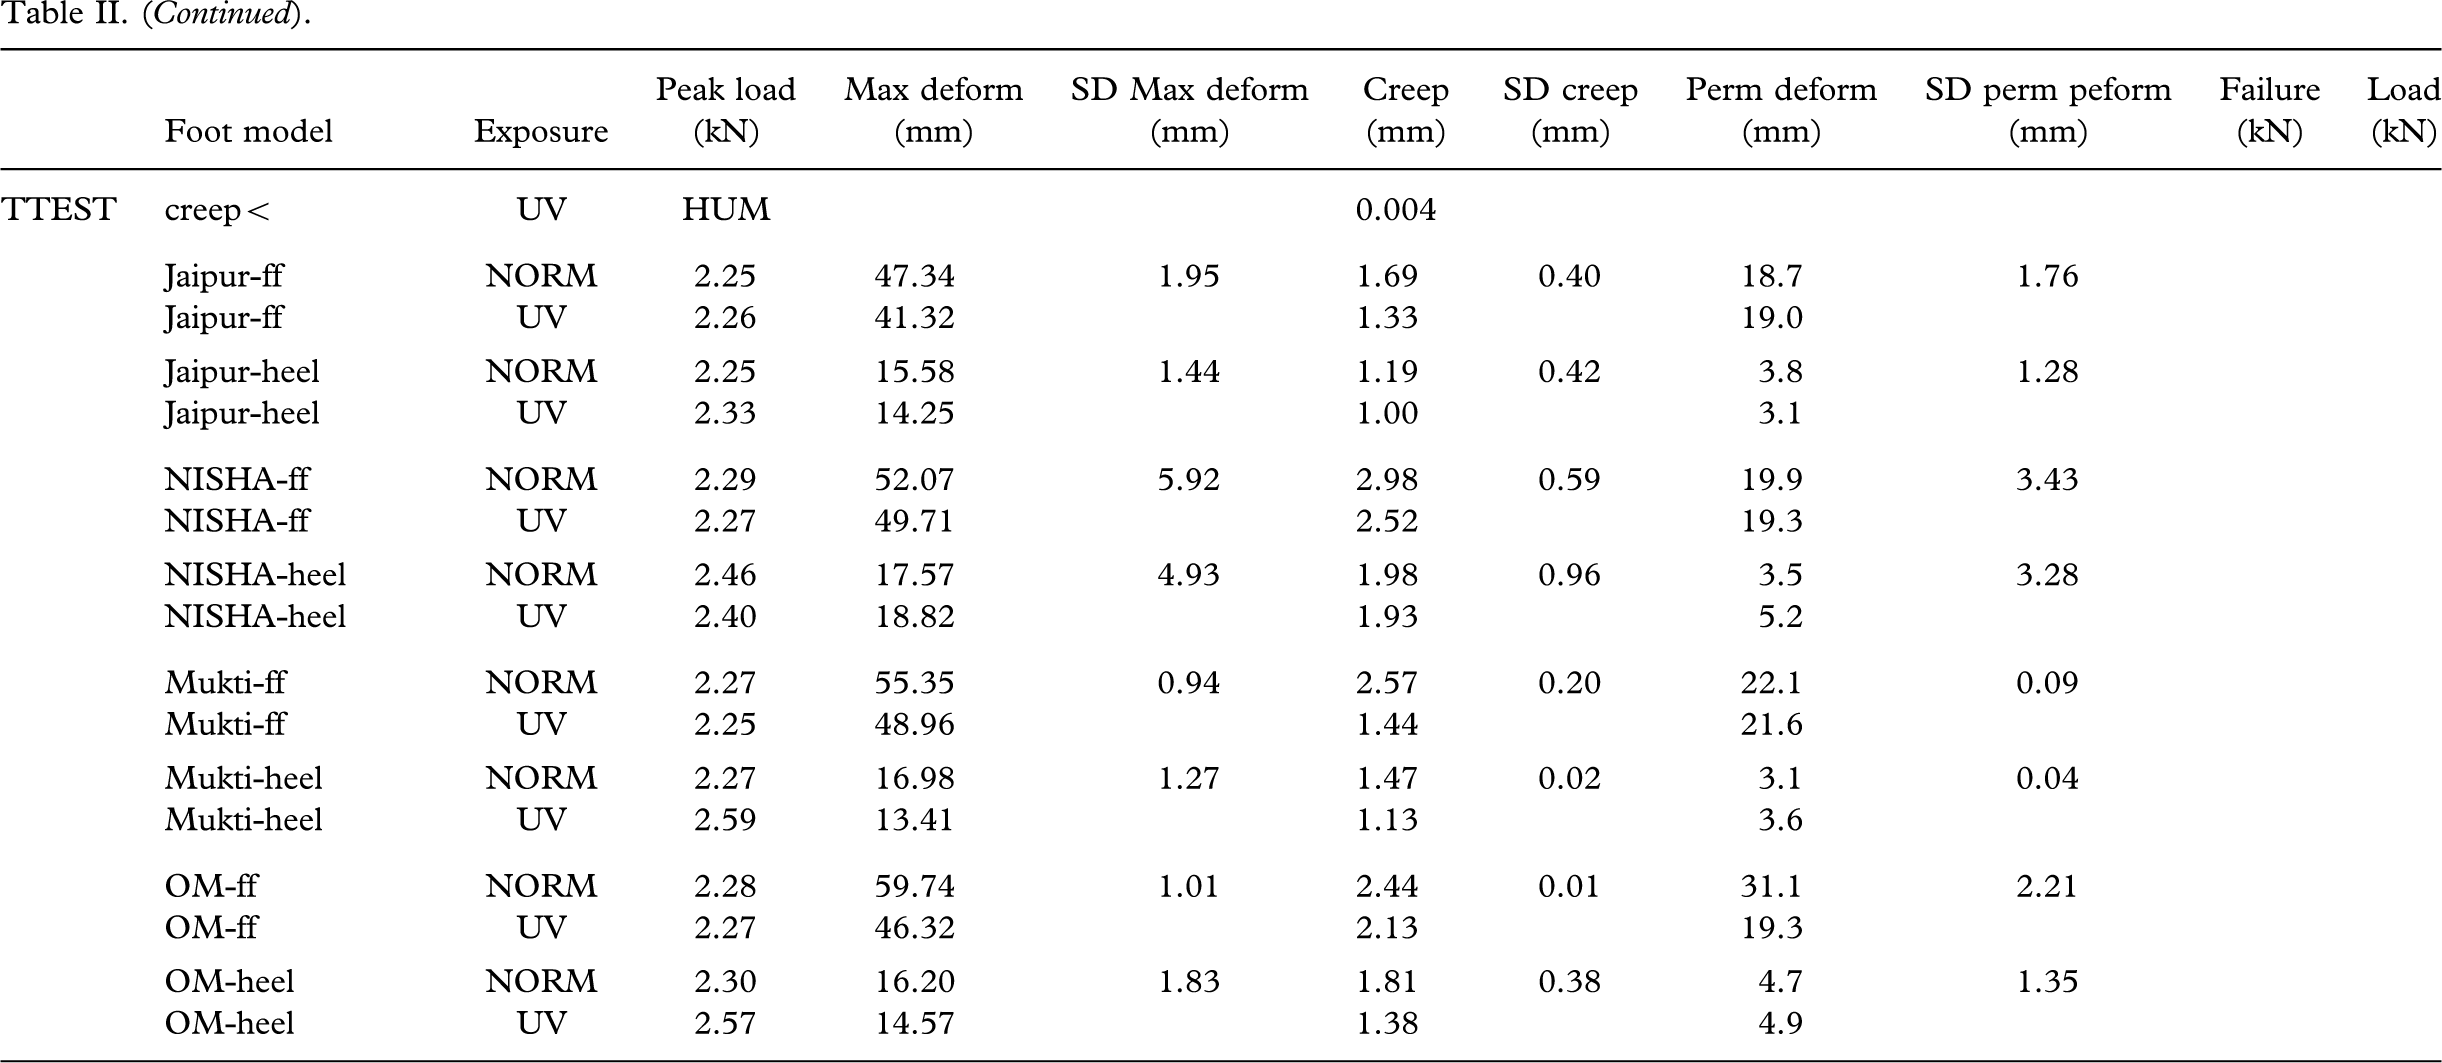
The maximum deformation varied with the Jaipur foot models from 47 – 60 mm at the forefoot and from 13 – 19 mm at the heel (Table II). The remaining SACH rubber feet had a maximum forefoot deformation of 17 – 30 mm and a heel deformation of 11 – 26 mm. The heel generally deformed less than the forefoot with the exception of the VI and PHN feet. The average maximum deformation was considerably less with 22.4±4.1 mm for the rubber forefeet than the 52.9±5.6 mm with the Jaipur forefeet (p < 5E-08, Table VI). For the heel cushion, 17.5±4.9 mm was measured for the non-Jaipur rubber heels as compared to 16.5±2.2 mm for the Jaipur heels (NS).
Relationship between prosthetic feet of different materials and deformation at static proof test.
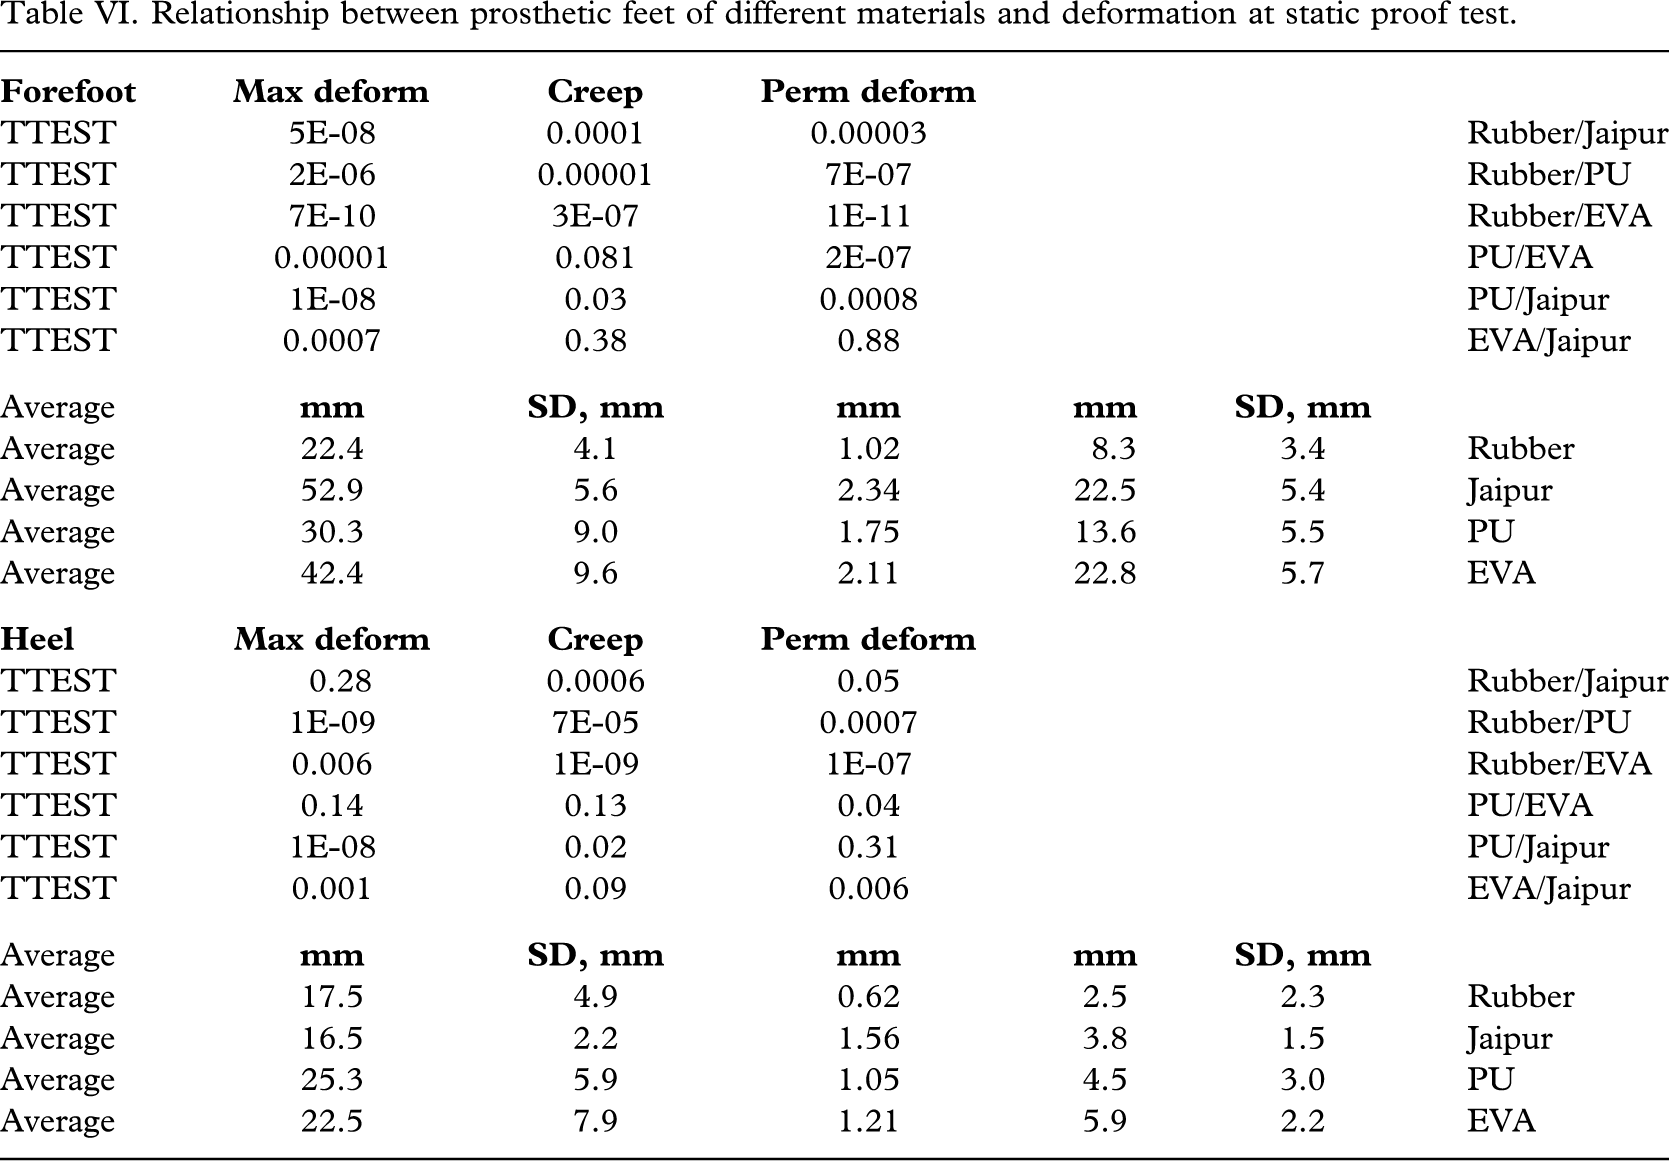
Only the HCMC foot passed the Static Proof test (Table II); all other tested feet demonstrated permanent deformation of more than 5 mm. The average permanent deformation for non-Jaipur rubber forefeet of 8.3±3.4 mm was significantly (Table VI) less than for Jaipur forefeet 22.5±5.4 mm (p < 0.00003). The average permanent deformation of non-Jaipur rubber heel cushions was also less with 2.5±2.3 mm than for the Jaipur heel 3.8±1.5 mm (p < 0.05).
Exposure to humidity (Table II) resulted in a higher permanent deformation with the EB-1 heel and TATCOT forefoot, a higher maximum deformation with the Myanmar foot and a lower maximum deformation with the EB-1 forefoot. Creep increased with the Myanmar foot, and the heel cushions of the EB-1, HI Cambodia, Mozambique and TATCOT feet.
UV exposure resulted in a higher permanent deformation with the VI forefoot, a higher maximum deformation with the EB-1 forefoot and a lower maximum deformation with the EB-1 heel. Creep increased with the VI forefoot and Mozambique heel, but became less with the EB-1 and Myanmar feet, the HCMC forefoot and the PHN heel. During physical inspection after the UV exposure, these 3 models all revealed small crack lines at the surface, especially around the forefoot area. For the Angola foot the colour became lighter and the skin alligator-like.
The influence of UV exposure compared to humidity showed a decreased permanent deformation for the Mozambique foot, and the HI and TATCOT forefeet. The maximum deformation increased for the EB-1 and PHN forefeet, but decreased for the Myanmar foot, the EB-1 heel and the VI heel. The creep increased with the VI and PHN forefeet, but became less with the EB-1 and Myanmar feet, the Mozambique forefoot, and the heel cushion of the VI, HI Cambodia, TATCOT and PHN feet.
Because only one foot of each Jaipur model was tested without UV or humidity exposure, statistical comparison was not possible. However, it appears that UV exposure resulted in less maximum deformation and creep.
The Static Strength of rubber feet (Table IV) was minimally influenced by the tested environmental challenges. UV exposure resulted in less maximum deformation (Myanmar forefoot and VI heel) or less permanent deformation (Myanmar forefoot, EB-1 heel) than humidity exposure.
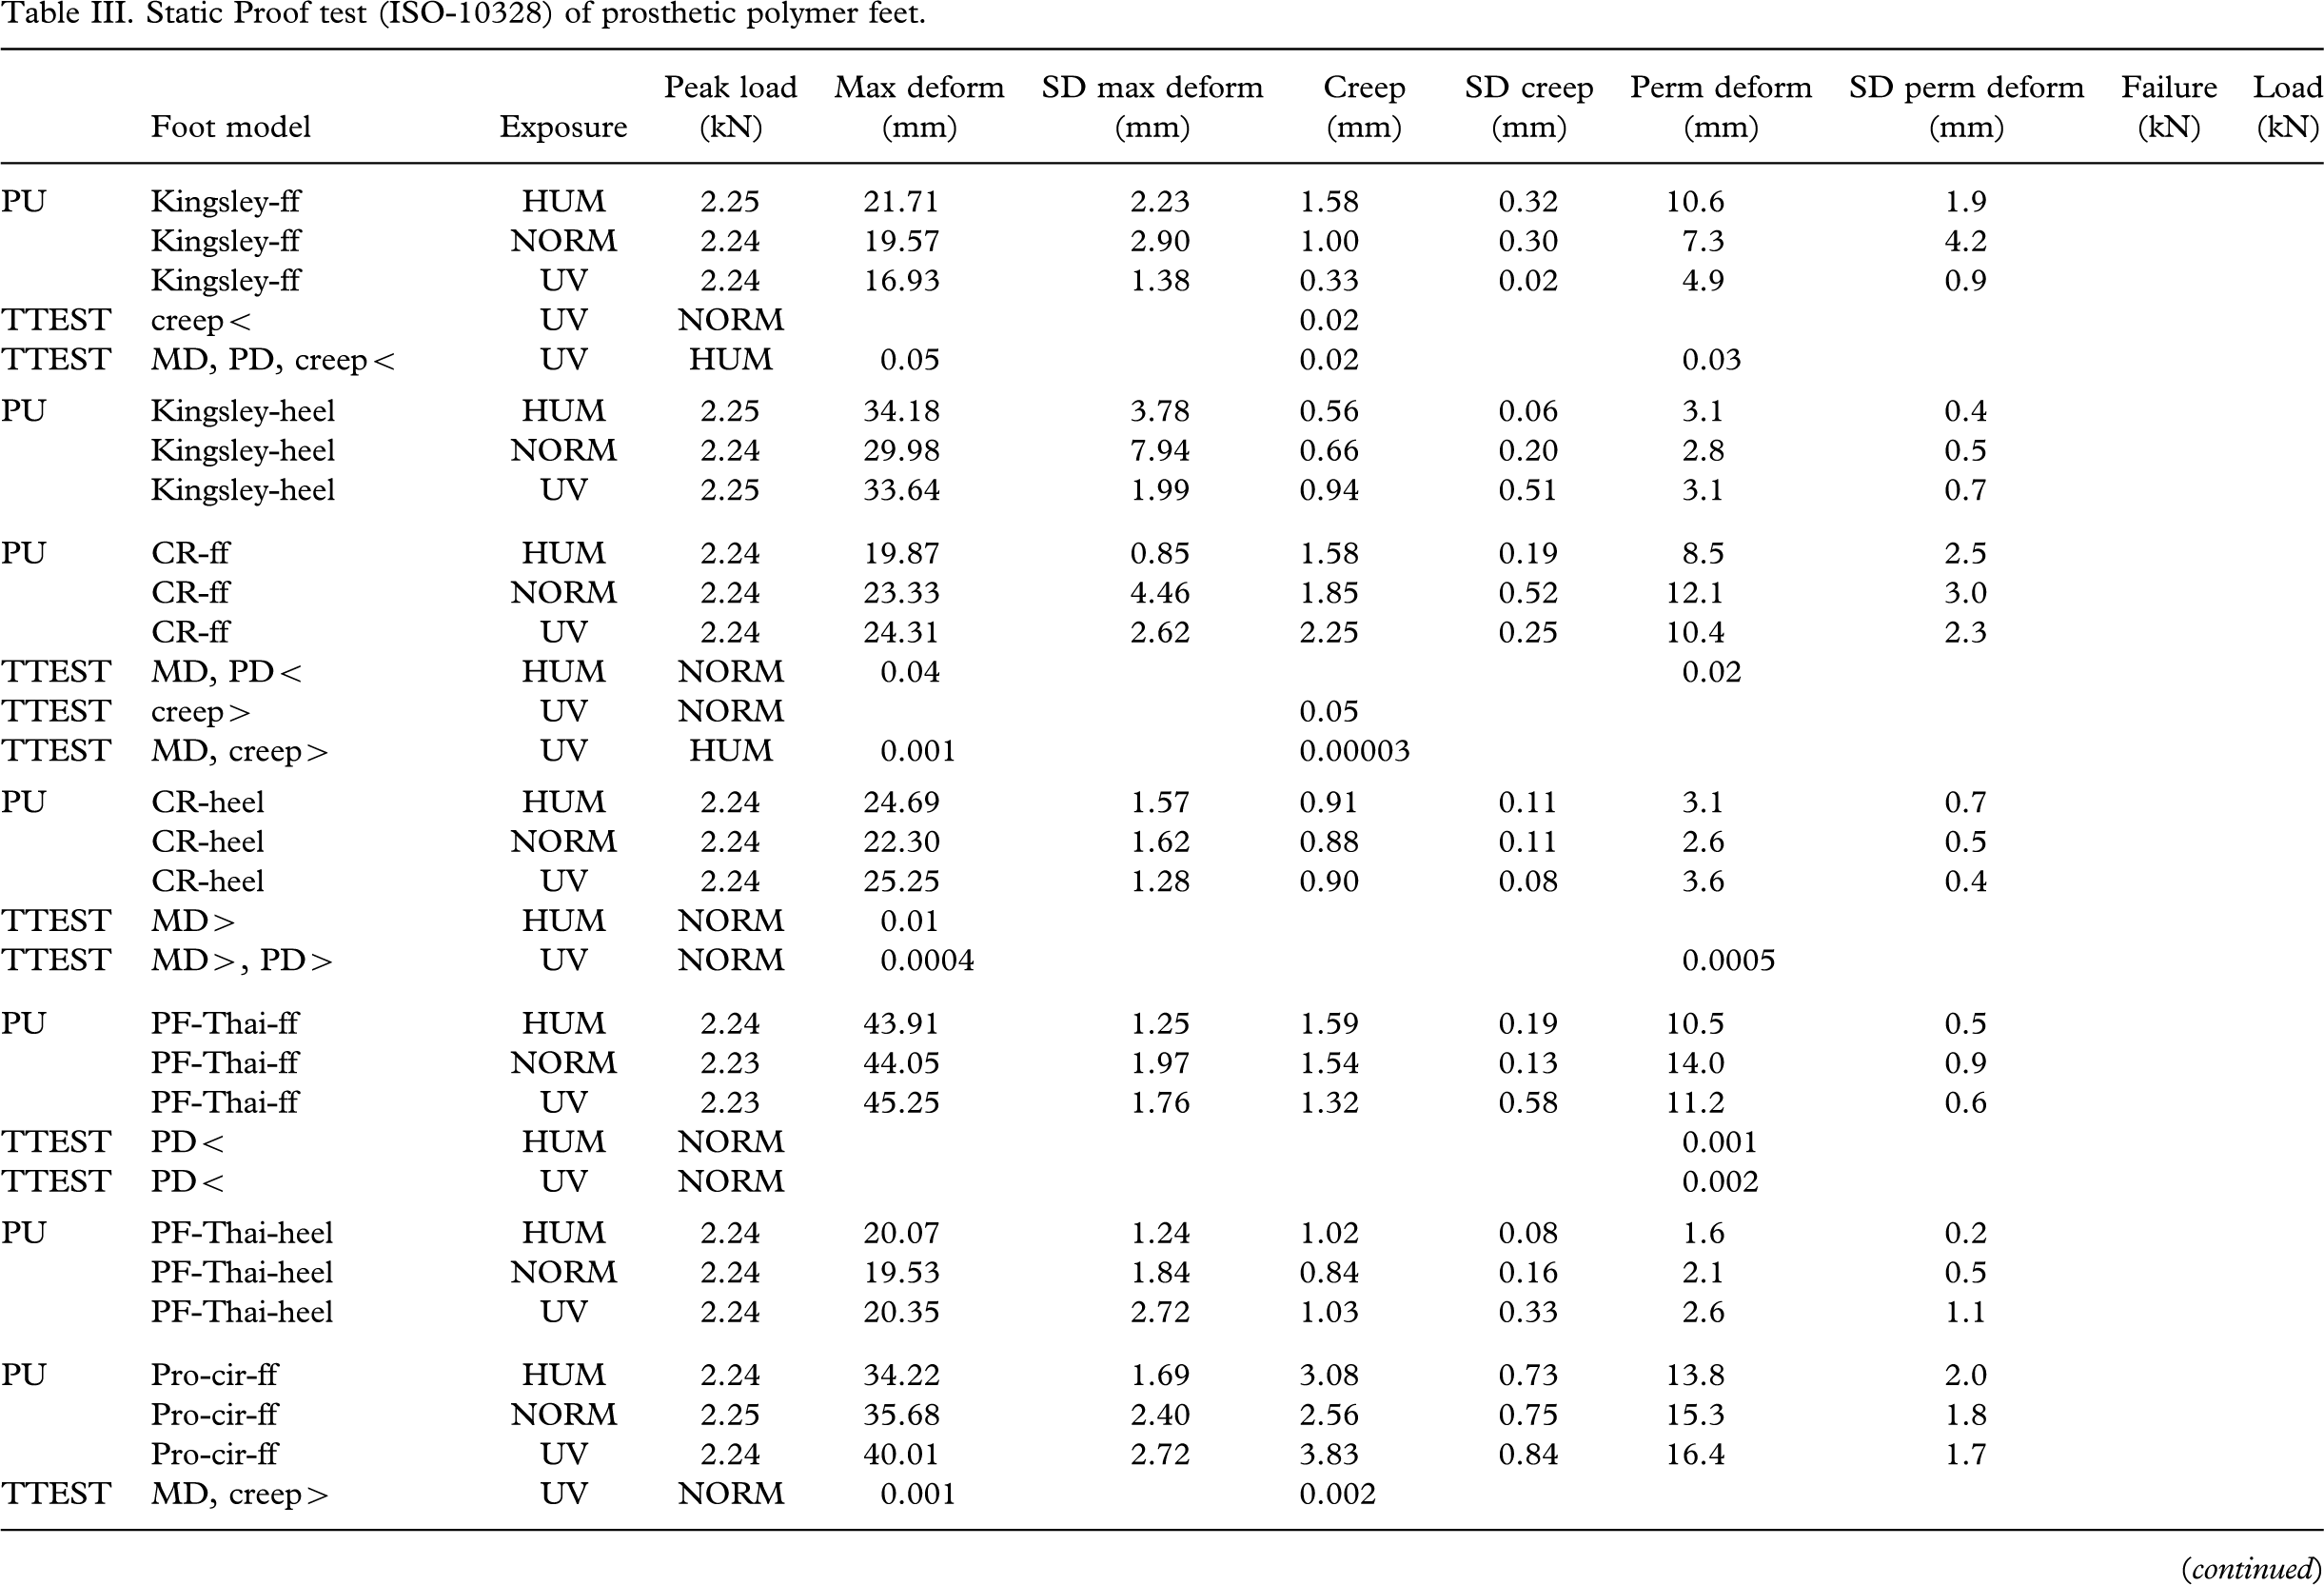
The maximum deformation of the PU forefeet varied from 20 – 44 mm and for the heels 20 – 30 mm at Static Proof test (Table III), which is higher than most of the rubber feet (p < 2E-06, Table VI), although less than the deformation encountered with Jaipur feet (p < 1E-08). The maximum deformation of EVA forefeet was 33 – 50 mm, and for the heel 16 – 31 mm. The rubber forefeet were the least deformed, and Jaipur forefeet the softest (Table VI). PU forefeet deformed less than EVA (p < 0.00001), but Jaipur more (p < 0.0007). The heels of polymer feet deformed the most while rubber and Jaipur were similar as was PU versus EVA (Table VI).
None of the polymer forefeet (Table III), including the commercially available foot from the USA, passed the most rigorous version of the Static Proof test, since permanent deformation after 30 sec loading with 2.24 kN exceeded 5 mm in all cases. The average permanent deformation (Table VI) of 13.6±5.5 mm for the PU forefeet was significantly less than the 22.8±5.7 mm recorded with the EVA forefeet (p < 2E-07), and likewise for the heels with 4.5±3.0 mm for PU and 5.9±2.2 mm for EVA (p < 0.04). Rubber forefeet were less susceptible to static proof loading than PU (p < 7E-07) and EVA forefeet (p < 1E-11) as well as PU heels (p < 0.0007) and EVA heels (p < 1E-09). There were no differences between Jaipur and EVA forefeet, but the EVA heel deformed more (p < 006).
All feet were susceptible to environmental changes. Humidity exposure resulted in higher maximum deformation for the heel of the CR, Pro-cirugia and Afghan feet, but decreased for the forefoot of the CR and ASB feet. The permanent deformation increased with the heel cushion of the CR and Pro-cirugia feet, but was less with the forefoot of CR and PF-Thai feet. The Creep became less for the ASB foot and the Afghan forefoot.
UV exposure resulted in increased maximum deformation for the Pro-cirugia and Afghan feet, and the heel cushion of the CR and ASB feet. The permanent deformation was higher for the heel cushion of the CR, Pro-cirugia and ASB feet, but decreased for the Afghan foot and the PF-Thai forefoot. More creep was encountered with the CR and Pro-cirugia forefeet, but less with the Afghan and ASB feet as well as the Kingsley forefoot. UV exposure resulted in brownish discolouring of the CR, Pro-cirugia and Kingsley feet and spotlike burns of the Afghan foot.
The effect of UV exposure as compared to humidity was higher maximum deformation with the Pro-cirugia foot, the CR forefoot and the ASB heel. The permanent deformation of the Pro-cirugia forefoot increased, but was lower with the Kingsley and Afghan forefeet and the ASB heel. More creep was encountered with the CR forefoot, but less with the Kingsley and Afghan forefeet.
In the static strength for polymer feet (Table V), exposure to UV as compared to humidity affected the maximum deformation, which increased with the Pro-cirugia heel, but decreased for the Kingsley forefoot, the Afghan heel and the Alimco heel. Exposure to UV as compared to humidity also affected permanent deformation, which decreased for the Kingsley and Afghan forefeet.
The results from Cyclic testing are also reported in Table I. There were a few models not subjected to cyclic testing, mostly because they had failed the static failure test; all the others passed 2 million cycles. There were no externally visible changes apart from the ASB foot that was deformed into a banana shape, and visible abrasion of the foot sole in some feet.
After completion of the Cyclic Test, the prosthetic feet were sectioned and closely examined. All feet revealed internal derangement:
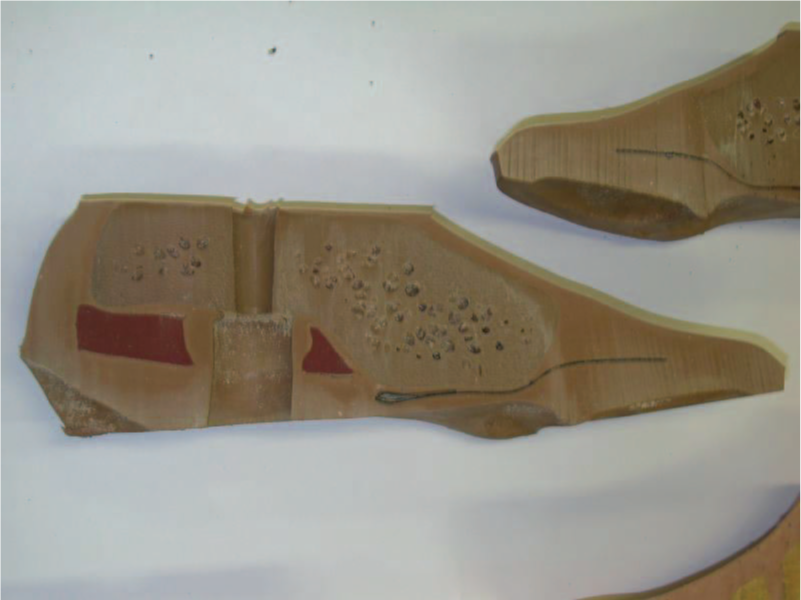
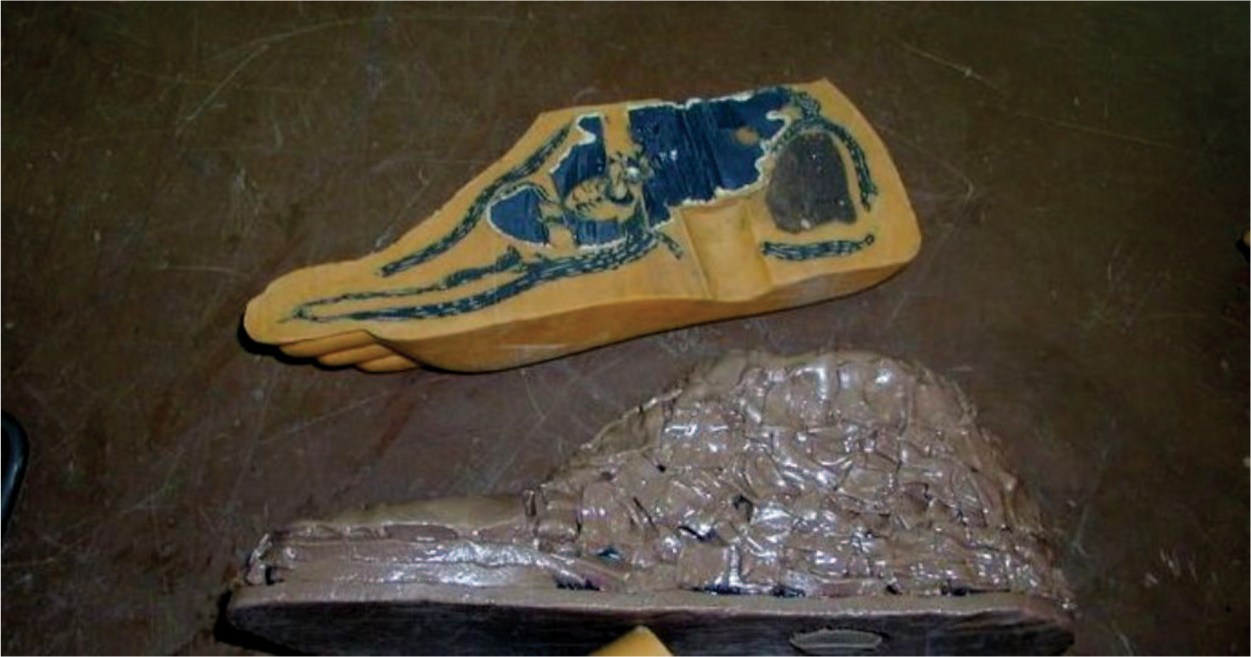
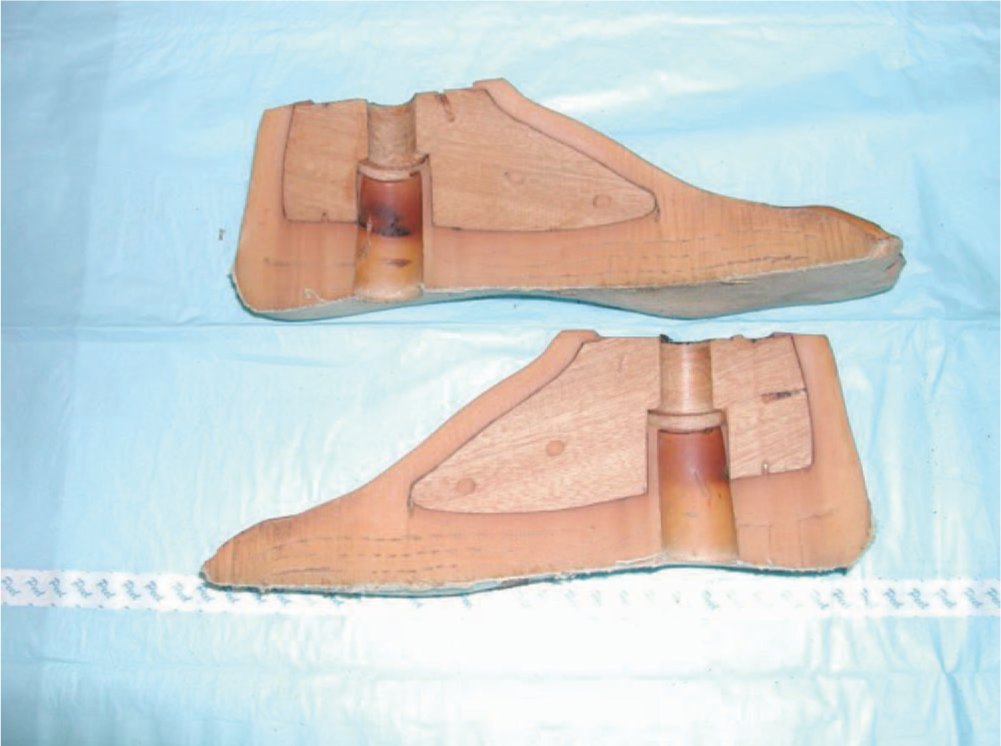
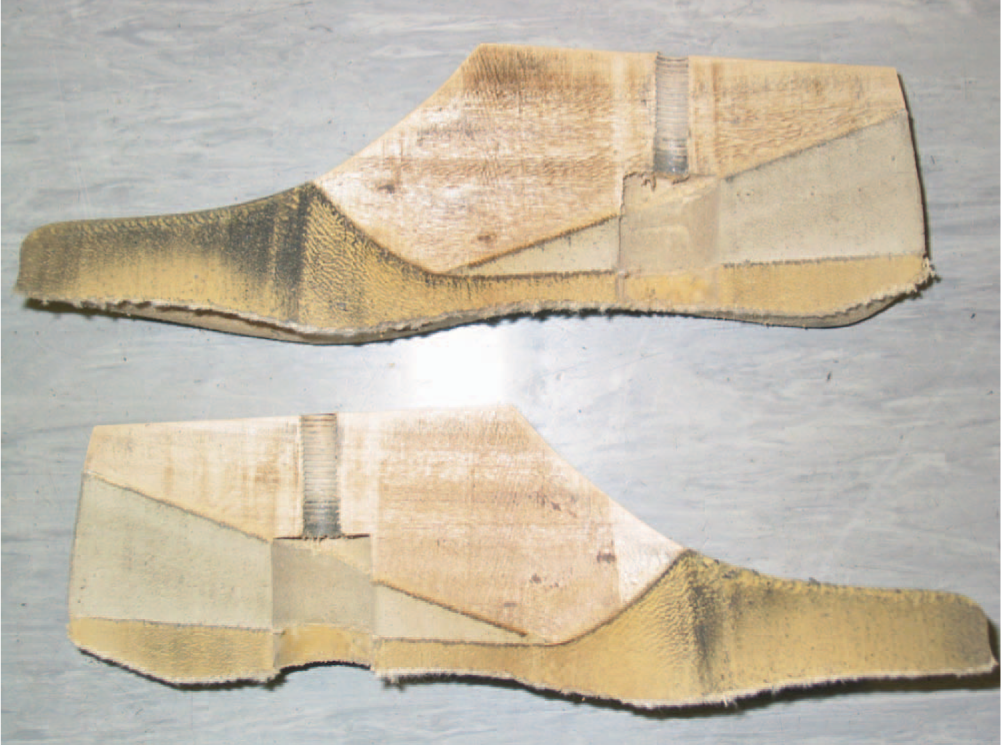
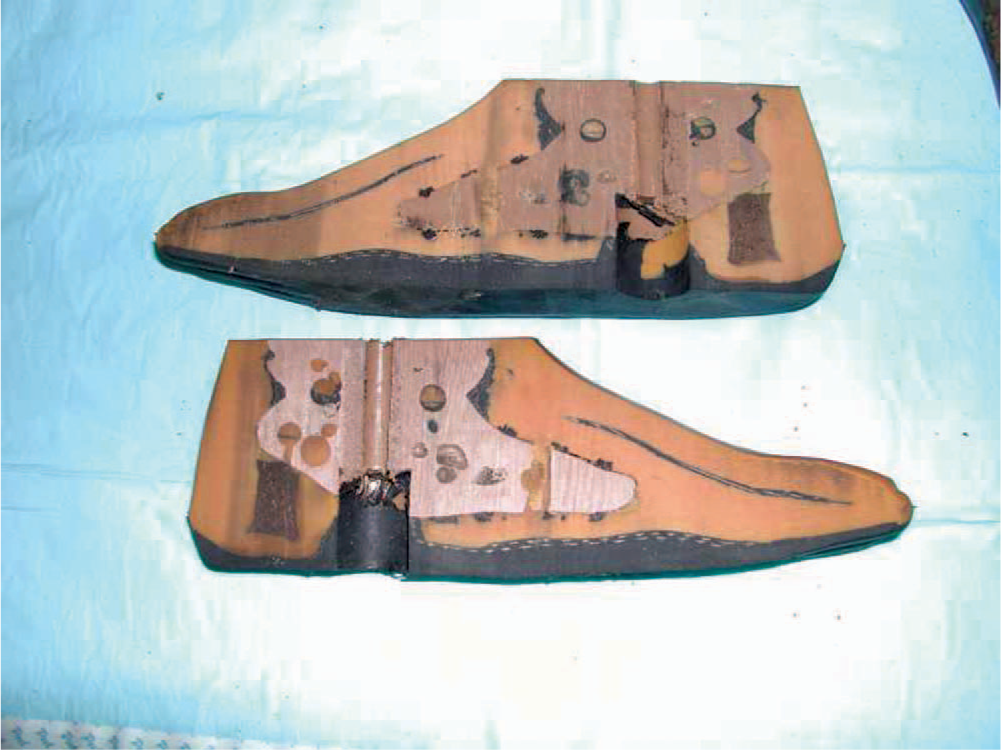
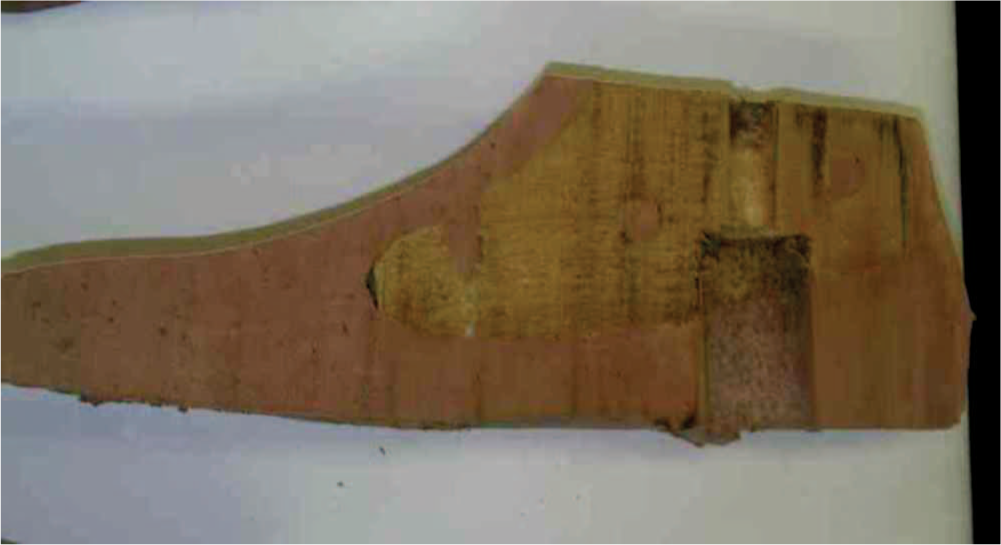
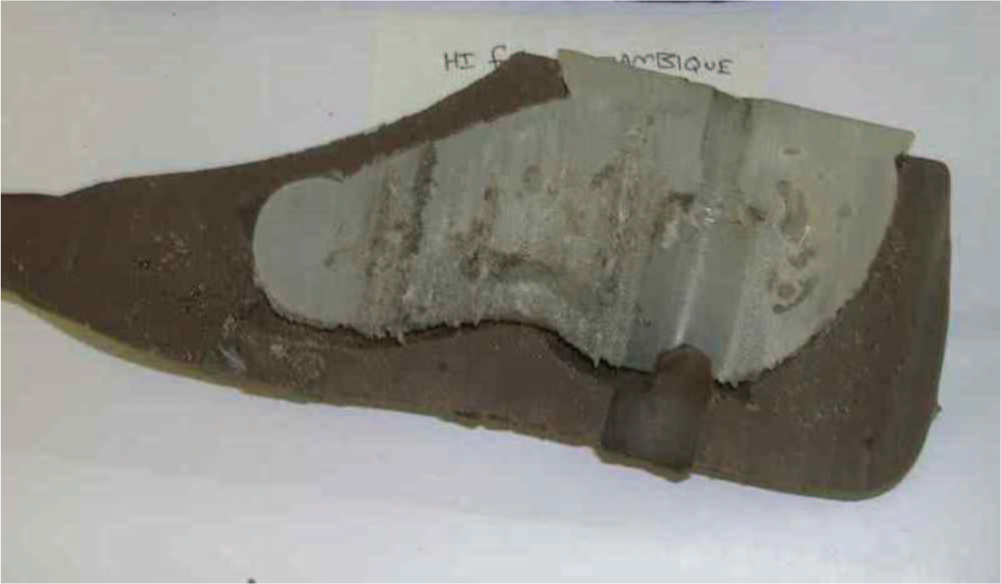
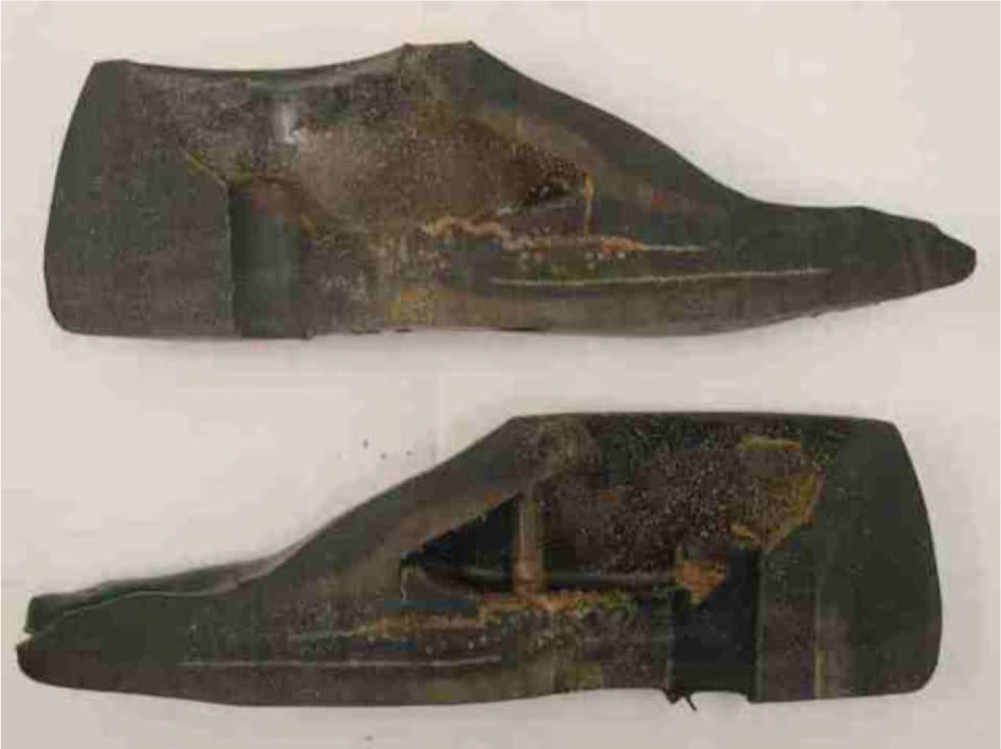
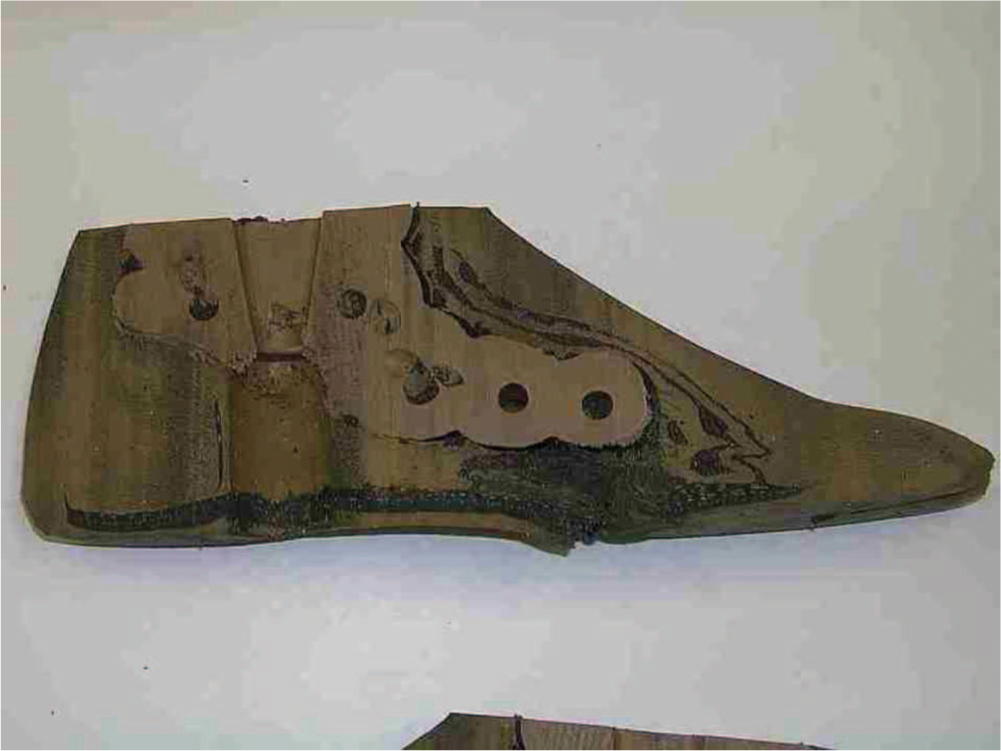
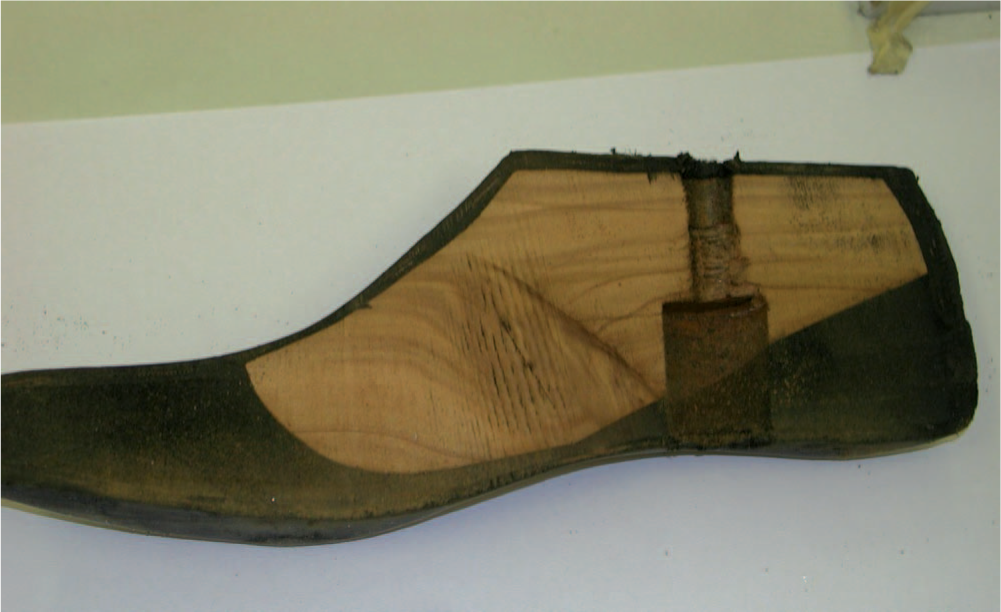
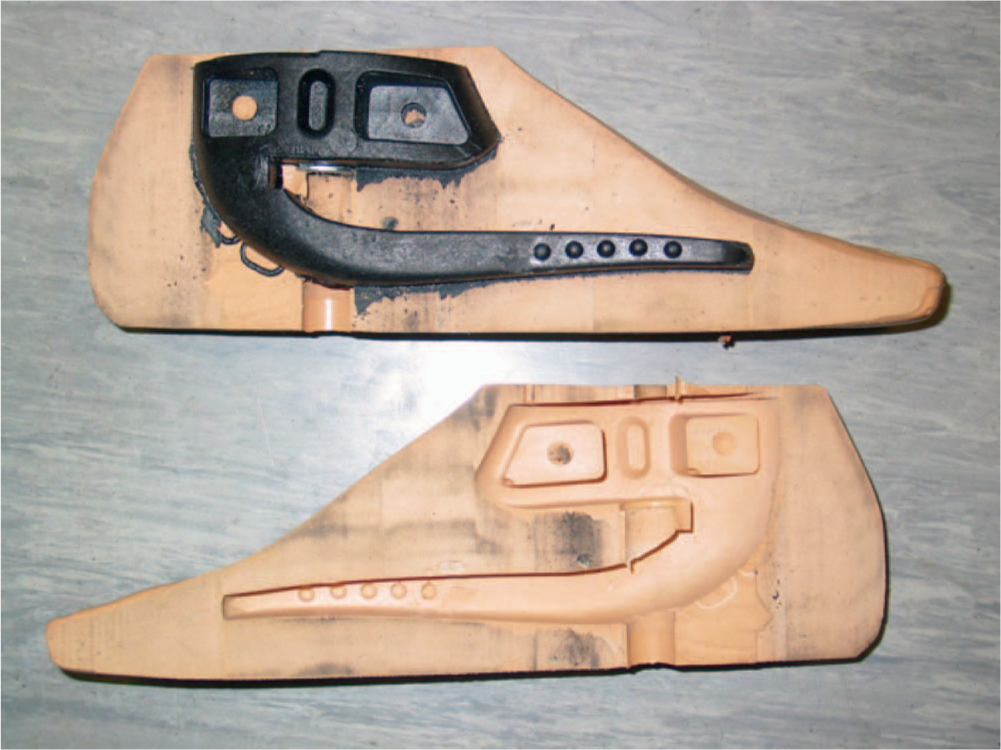
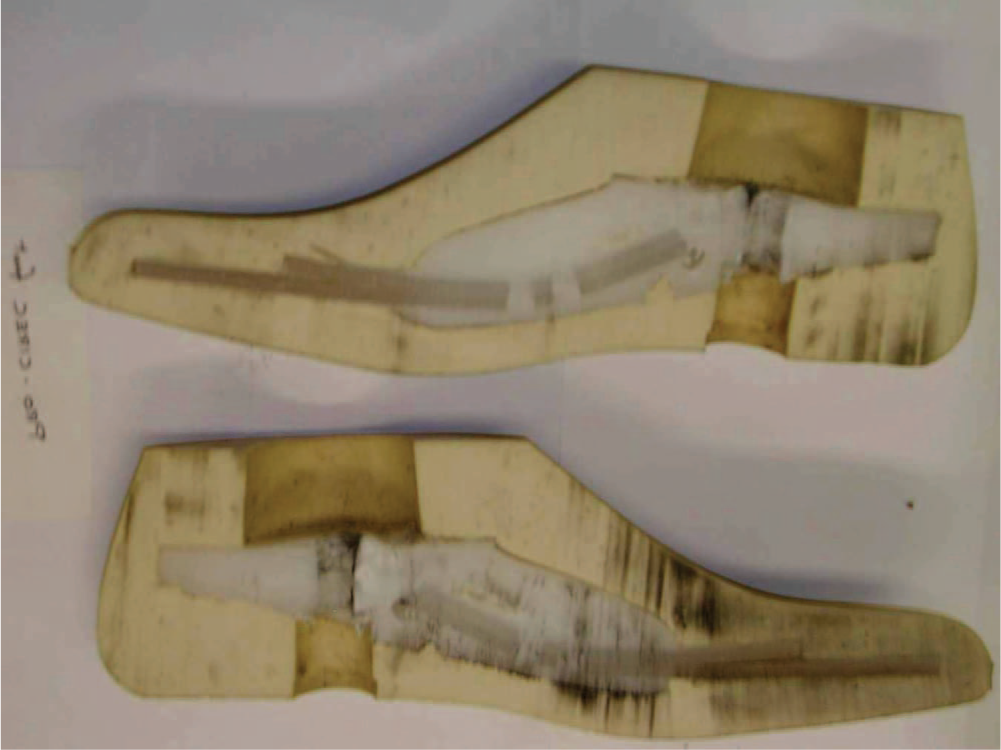
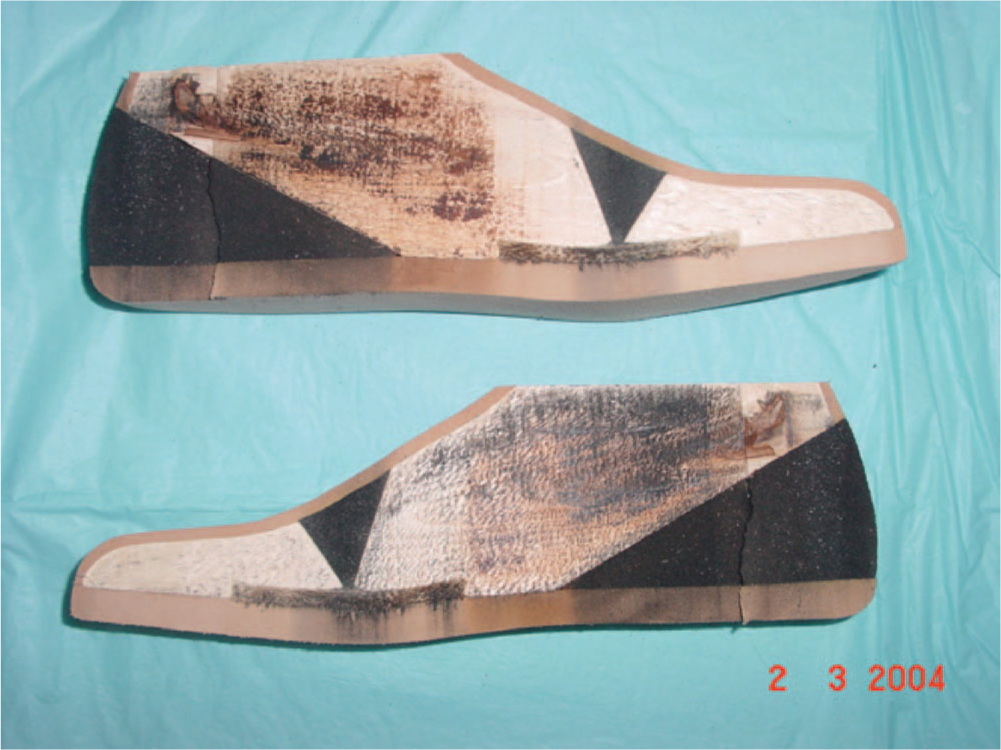
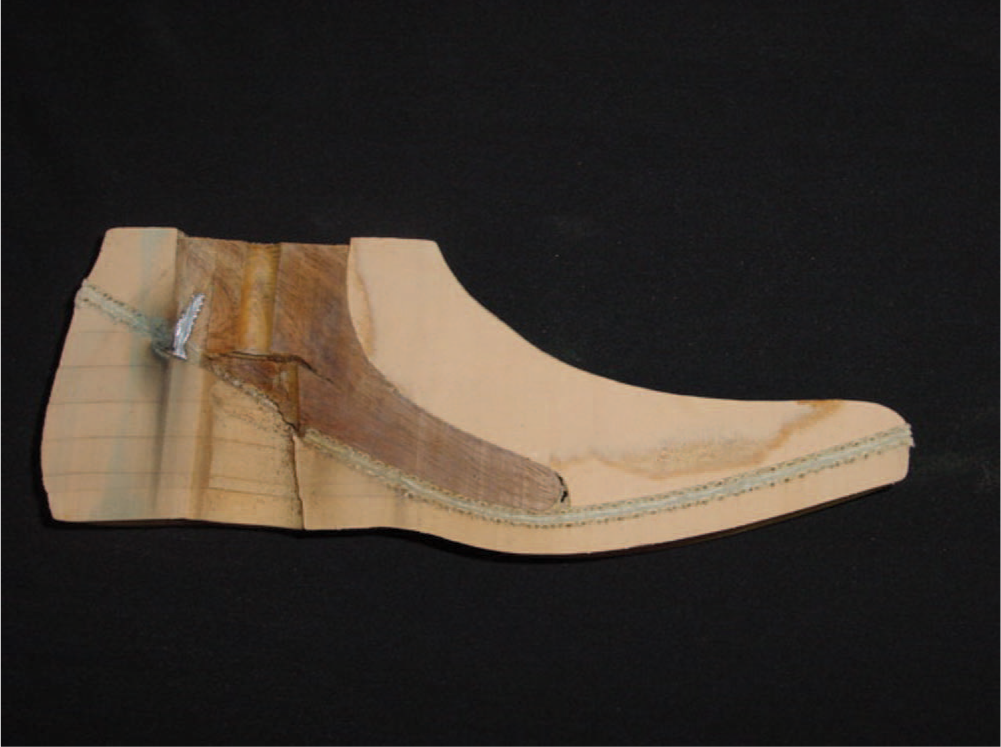
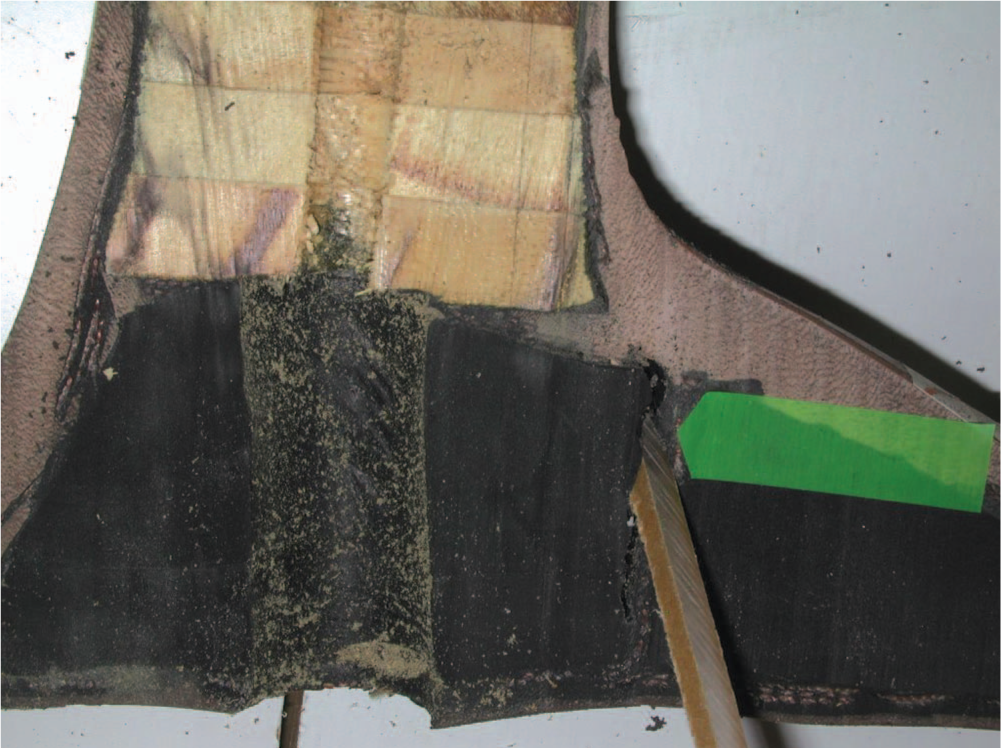
Deformation of rubber or PU foam under the keel of forefoot and/or heel: HCMC, VI, EB1, BAVI, HI Cambodia, Myanmar, Angola, TATCOT, Kingsley and CR. Figure 22 shows with arrows that the PU foam has been compressed at both the forefoot and the heel, the latter being further illustrated in Figure 23. Delamination from the keel: Mozambique (Figure 7), PHN (Figures 9 and 24, which also shows penetration of the foot sole), Pro-cirugia (Figure 18). Delamination between foam layers: BMVSS (Figures 11 and 25), NISHA (Figure 26), MUKTI, and OM.
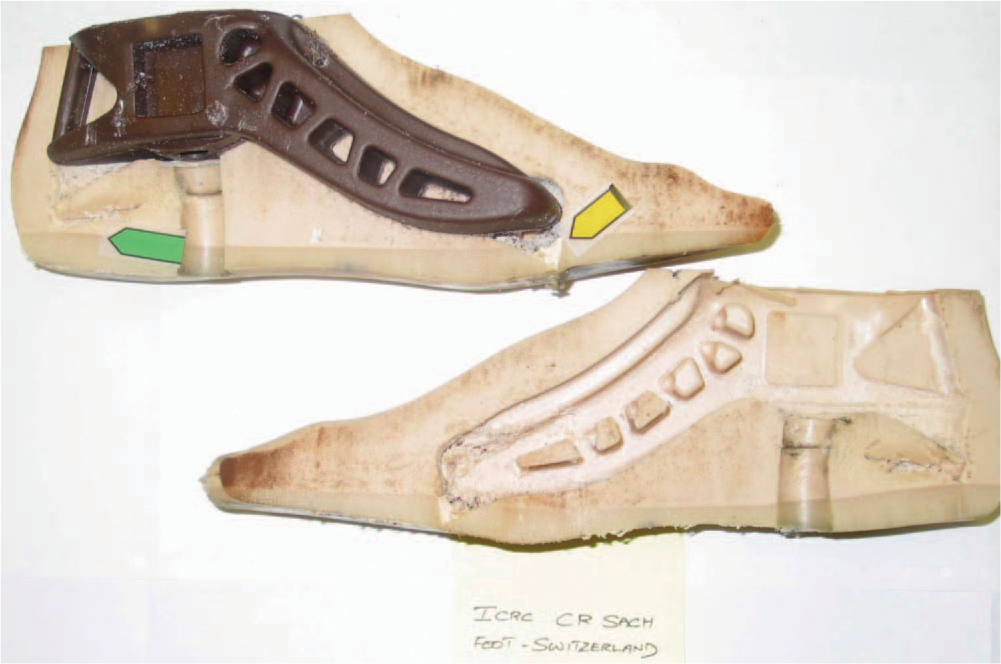
Failure of CR foot.
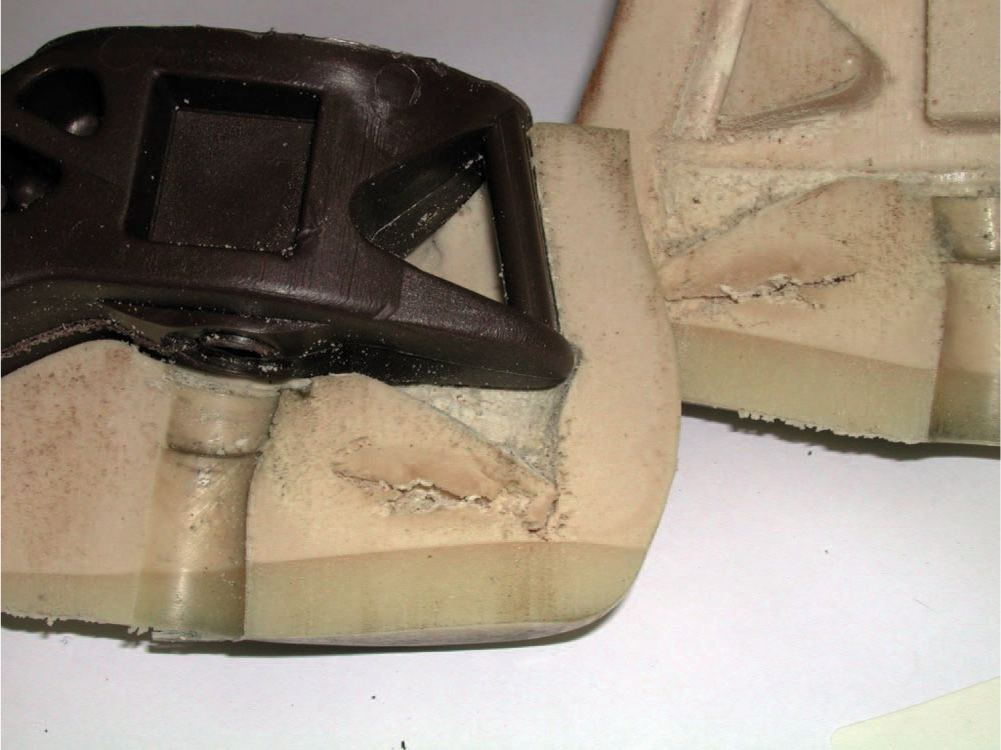
CR failure of heel.
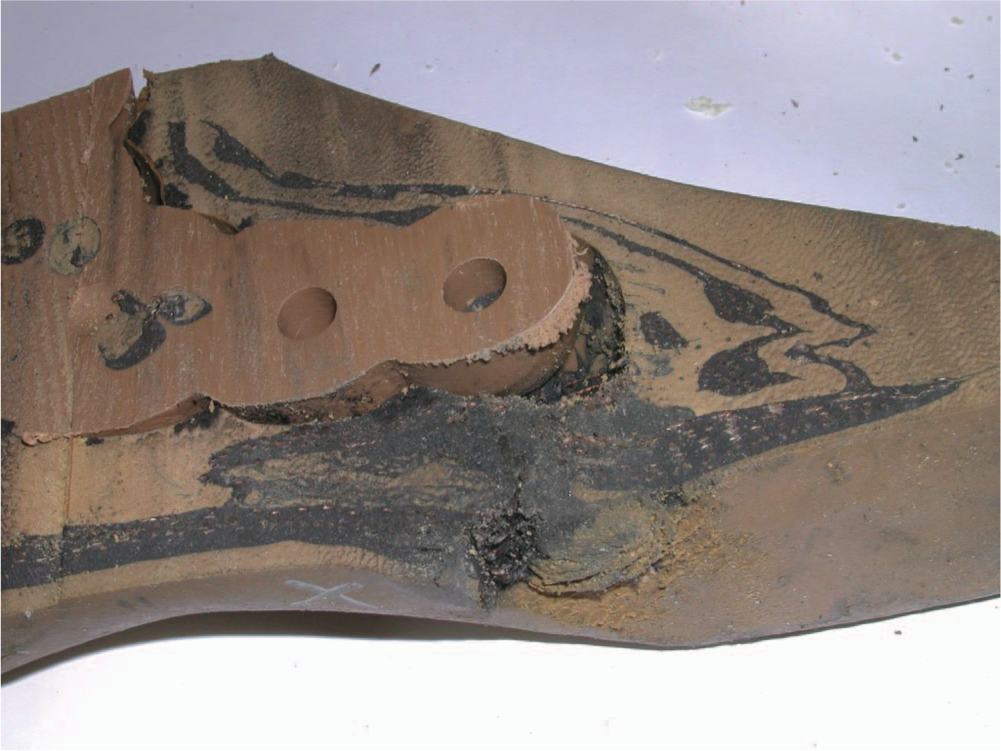
Failure of PHN foot.
Delamination of BMVSS Jaipur foot.
Failure of NISHA Jaipur foot.
Discussion
The standard for permanent deformation <5 mm the Static Proof test was based on section 16.3.2 of the ISO-10328 standard. However, it is permissable to use section 17.2.2 for single component testing instead. The performance requirement is still that the test force must be sustained for 30±3 sec, but there is no requirement for resistance to permanent deformation so all of the feet would have passed this alternative standard. The permanent deformations of 22.5±5.4 mm for Jaipur rubber forefeet, 22.8±5.7 mm for EVA forefeet and even 13.6±5.5 mm for PU forefeet may be cause for concern since loss of forefoot support can lead to early knee flexion during walking and knee collapse for persons with amputation proximal to the knee joint. However, no major gait deviations of this type were noted in any of the clinical field tests previously reported.
According to Cochran (1982), the ground reaction force at heel strike and toe-off peaks at 1.1 – 1.2 times body weight, which corresponds well with the figures in Poetsma's thesis (1994). The proof load of 2.24 kN therefore represents a safety factor of about 2 based on these estimates.
The influence of environmental challenges were surprisingly small for rubber feet with respect to deformation and rather inconsistent for the polymer feet, especially the forefeet. Creep increased after exposure to humidity in some feet of natural rubber. However, creep decreased by UV exposure for these natural rubber feet, as was also the case for EVA feet, whereas the creep increased for two of the PU feet. Comparison between humidity and UV exposure showed less creep with UV exposure in most instances. Neither exposure in this testing resulted in the crumbling and deterioration of the foot cover of the CR feet that was expeerienced in clinical field testing (Jensen et al. 2006a).
The Static Strength testing was on one sample for most feet, making meaningful comparison impossible. However, UV and humidity exposure had, by and large, the same effect as in the Static Proof testing.
According to Murdoch and Donovan (1988), amputees walk on average 2498 steps per day or slightly under 1 million steps per year. The cyclic loading with a load range of 1.28 kN and 2 million cycles simulates 2 years of use for an individual of about 100 kg. That should theoretically be a realistic test even though the effect of environmental exposures are not taken into account.
According to the ISO-10328 standard the sequence of foot testing should be Cyclic testing followed by final Proof testing with the same compliance requirements of 2.24 kN to be sustained for 30±3 sec. However, we decided to refrain from the last step and instead sectioned the feet into half to examine the effect of the cyclic loading on internal structural integrety. Because we have previously performed a number of clinical field tests that included similar sectioning of failed feet, this permits comparison between the laboratory findings and the clinical findings.
One key observation was that the laboratory testing showed little wear to the foot sole, which in clinical practise represents a high proportion of the failures. This is likely due to the ball bearings in the loading plate which are designed to remove friction that might affect the other loads being measured.
The cyclic foot testing of the VI forefoot resulted in deformation of the rubber under the keel. The maximum deformation was 19 mm and the permanent deformation 5.5 mm. In clinical follow-up of 31 feet for an average of 26 months, wear of the sole after 26 months was encountered in one case that was also the one and only failure (Jensen et al. 2006b).
The EB-1 forefoot also showed deformation of rubber under the keel. The maximum deformation was 26 mm and the permanent deformation 6.9 mm. In the field (Jensen et al. 2006b), 41 feet were followed for 20 months. Severely worn soles were observed in 6% and keel failures in 24%.
The HI-Cambodia forefoot showed deformation of rubber under the keel. The maximum deformation was likely to take place in front of the keel and amounted to 23 mm and the permanent deformation was 8.5 mm. In the field, 30 feet were followed for 10 months (Jensen et al. 2006b). Severely worn soles were observed in 3% and keel failures in 13%.
The PHN forefoot showed delamination and severe deformation of rubber under the front of the keel to the point of penetration (Figures 9 and 24). The maximum deformation of 25 mm would take place with the front of the keel as a fulcrum and resulted in a permanent deformation of 11.6 mm. In field testing of 38 feet for 15 months (Jensen et al. 2006b), severe wear of the sole was encountered in front of the keel in 7% and keel failure was observed in 10%.
The TATCOT forefoot showed delamination and deformation of the rubber under the keel. The maximum deformation of 24 mm is probably located around the rounded front of the keel. The permanent deformation amounted to 11.7 mm. In field testing of 27 feet for 20 months (Jensen et al. 2006b), severe wear of the sole was recorded in 3% and keel failure in 6%, which is far less than expected from the laboratory testing.
The BMVSS-Jaipur rubber forefoot showed delamination between the horizontal foam rubber layers (Figure 25). The maximum deformation was 47 mm and the permanent deformation 19 mm. In the field follow-up (Jensen et al. 2004) of 172 feet after 35 months, severe wear of the sole was recorded in 17% and keel failure in 15%.
The NISHA-Jaipur forefoot also showed delamination (Figure 26), a high maximum deformation of 52 mm and a permanent deformation of 20 mm. In clinical practice (Jensen and Raab 2006), there was keel failure in 35% of 40 feet followed for 15 months.
The MUKTI-Jaipur forefoot again showed delamination, a maximum deformation of 55 mm and a permanent deformation of 22 mm. Somewhat surprisingly, it performed better in the field (Jensen and Raab 2006) with 2% severe sole wear and 12% keel failures due to delamination in 41 feet followed 16 months under the same circumstances as the NISHA feet.
The Kingsley forefoot showed deformation of the PU foam under the keel, and had a maximum deformation of 20 mm, which with the construction (Figure 15) is likely to take place in front of the keel. The permanent deformation was 7 mm. In the field testing (Jensen et al. 2006a) of 33 feet over an average of 17 months, severe wear of the sole was recorded in 27% and keel failure in another 27%.
The CR forefoot also showed deformation of the PU foam both under the keel anteriorly and posteriorly (Figures 22 and 23). The maximum deformation was 23 mm and the permanent deformation 12 mm. In the field testing (Jensen et al. 2006a) of 55 feet followed for 18 months, a total of 73% failed. A major problem was crumbling of the foot cover and slight wear of the sole in 33%, which would not be discovered by the ISO-testing. Severe wear of the sole at the front of the keel accounted for 29% failures and keel failure with penetration of the sole for another 11%.
The Pro-cirugia forefoot again showed delamination and PU foam deformation under the keel (Figure 18). The maximum deformation was 36 mm and the permanent deformation 15 mm. This could be a good explanation for a keel failure rate of 25% with 20 feet followed for 18 months (Jensen et al. 2006a).
Altogether there is a reasonably good congruity between the clinical observations and the visual examination of internal derangements after ISO testing, this requires invasive examination. It is not possible to single out the poorly performing feet by cyclic testing measurements alone. Whether that would be possible by the terminal Proof testing to failure is unknown, as we did not perform that aspect of the ISO testing.
It does appear that more emphasis should be given to the Proof testing and to the amount of maximum deformation and permanent deformation. There is not a linear relationship between deformation rates and failures of keel, major wear or even penetration of the sole, but a tendency towards increasing failure rate with increasing deformation was present. This could explain some of the delamination issues as being due to differences in flexibility of materials. Furthermore, there is a relationship between internal architecture and failure (e.g. Jaipur feet) and materials selection (e.g. CR foot). In general, non-Jaipur rubber forefeet were the least deformable and performed the best in clinical practice.
In conclusion, ISO-10328 testing would be helpful prior to releasing a new foot design for patient use in both developed and developing countries. Invasive inspection of the internal structures after the laboratory testing was useful in identifying mechanisms of failure even though this precluded use of the Final Proof test to structural failure.
Footnotes
Acknowledgements
The prosthetic feet for testing were donated by the manufacturers. The test program was conducted at the Department of Orthopaedic Surgery, National University of Singapore, under the supervision of Professor James Goh. The study was supported by the Leahy War Victims Fund, United States Agency for International Development (Grant No. HRN-G-00-00-00015-00). The opinions expressed in this paper are those of the authors and ISPO, and do not necessarily reflect the views of USAID.