
Abstract
In this study, the evolution of the electrical resistivity of metal powders during densification and the resulting current flow through punch, powder compact, and die is investigated. The evaluation of the accompanying Joule heating identifies the graphite punches as main heating element providing more than 90% of the heat. The high electrical resistance of the punches and the low resistance of the graphite die as parallel electrical load to the specimen determine the current flow in the tool. For powder particles with intact oxide layers, virtually no current flows through the compact. On the other hand, for a powder resistivity below
 Ωcm about 50% of the current flows through the compact. This fraction is constant despite further decreasing resistivity of the compact during densification. A constant current through the specimen has important implications for the microscopic temperature distribution and the understanding of the so-called ‘spark plasma effects’.
Keywords
Introduction
‘Spark Plasma Sintering’ (SPS) is the most common name for a powder consolidation technology that uses a pulsed electric current to heat the powder compact and simultaneously accelerates its densification by applying an uniaxial mechanical pressure. As both the existence of sparks and plasma have been questioned [1, 2] and with densification being attributed to plasticity and creep [3–6], many other names have been proposed, like field-assisted sintering technology (FAST), pulsed electric current sintering (PECS), and so on [7]. Even though this publication will, together with two following parts, show that there is indeed neither spark nor plasma, the term SPS is nevertheless used as it is the one name everybody active in this field immediately recognises.
Two recent books [8, 9] give an overview of materials that have been synthesised using SPS and related technologies, technological aspects, proposed mechanisms involved in densification and recent innovations. The application of mechanical pressure during densification makes the process comparable to hot pressing (HP) but with much higher heating rates of up to
 K min
K min
 , compared to ≈ 5–10 K min
 in HP. Simultaneous pressing and sintering allows the fast densification at lower temperatures and in shorter times compared to conventional sintering, often leading to improved properties of the materials produced [7]. The high heating rates in SPS can reduce material transport by surface diffusion during heating, which eventually hinders densification [10], and also retain a microstructure favourable for densification by creep. But, in some cases, consolidation temperatures more than 100 K lower compared to HP have been reported [11,12]. To explain the lower sintering temperatures, a ‘spark plasma effect’ has been introduced by the Japanese group around Tokita in the 1990s [13]. This effect includes the occurrence of sparks [14,15], the generation of plasma, vapourisation, and melting of the particle surfaces, and the generation of an impact pressure leading to the convergence of the particles when a single millisecond-long current pulse stops. Later, next to plasma formation a multitude of other constituents have been proposed by other researchers, e.g. electro- and thermomigration [16], fast nucleation of phases [17,18] or accelerated diffusion by an increased concentration of defects induced by the electric current [19,20] or an increase in defect mobility [20,21]. While many of these effects are well known, e.g. from microelectronic devices (where electromigration usually including thermomigration is a common failure mechanism [22,23]), the conditions under which these mechanisms are active have to be compared to those during SPS consolidation. Electromigration becomes relevant at current densities of
 –
–
 A cm
A cm
 and ‘process times’ of years, while SPS works with
 A cm
A cm
 , of which only a fraction flows through the powder compact. Consequently, enhanced diffusion could not be observed in real SPS experiments by other researchers [24,25]. Obviously, the relevant conditions depend on the relative neck radius of the particle–particle contacts, i.e. the ratio between neck radius and particle radius. The electric current is being forced through the contact area between the (conducting) particles, leading to a locally amplified current density that is supposed to be accompanied by a higher temperature in the contacts. It has been claimed that the consequences of this effect can be local melting, evaporation or even plasma formation [26]. A local melting would of course lead to an instant, at least partial densification. A plasma is also said to clean to powder particles from surface oxides [27,28]. At least the formation of plasma is more and more questioned [1,2,29] and should be irrelevant if the applied voltage is below 25–50 V [30](about ten times the typical SPS voltage), if a conductive die is used [31], and if at least some mechanical pressure is applied [32]. The breakdown of surface oxide films is more likely happening due to plastic deformation and reduction at higher temperatures [33], possibly in conjunction with the presence of carbon [34]. A multitude of experimental observations [35,36], analytical estimates, and finite element simulations [37–40] even come to the conclusion that with less than 1 K no relevant temperature difference between particle–particle contacts and the centre of the particles exists.
Therefore, in a first step to resolve contradicting results, this paper presents and discusses experimental data of (i) the electrical resistivity of different powders and how it changes during initial compaction at room temperature and during sintering, (ii) the current and voltage evolution during compaction for different sets of tools, and (iii) the fraction of current flowing through the powder compact, punch, and die. From these data, the generation of Joule heat in the different parts of the setup with its resulting macroscopic temperature distribution can be derived. The understanding of these parameters is highly relevant not only for understanding and optimising the process but it is a prerequisite especially to critically discuss the impact of different constituents of the ‘spark plasma effect’ on a microscopic scale in a following publication [41]. Finally, the question to what amount pulsing the current influences the process will be discussed. The second paper to be published in the same journal will initially discuss the microscopic temperature distribution during pulsed current heating. Eventually, the quantity of mass transport, e.g. by electromigration or thermomigration will be assessed and it will be discussed how this mass transport can or cannot accelerate densification. The last of the three papers will describe the most relevant processes of densification by plastic deformation and creep by comparing experimental shrinkage curves for different values of temperature and pressure with analytical models and results from finite element simulations.
Materials and methods
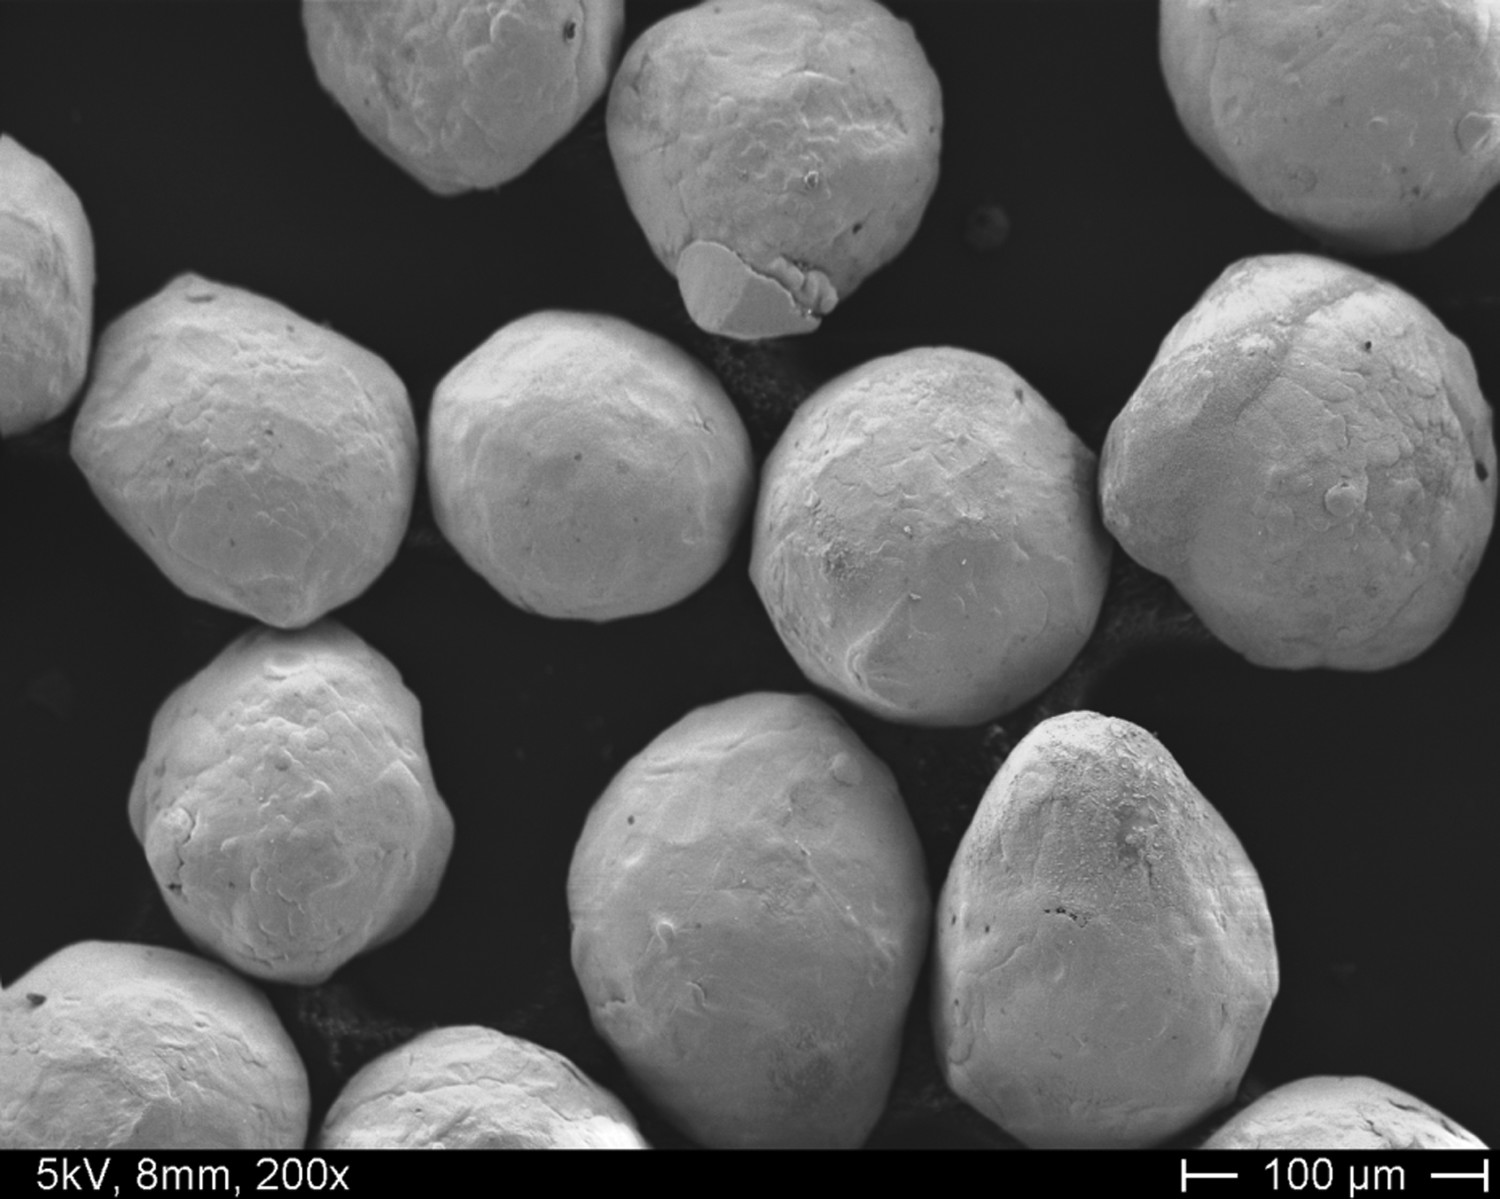
Spherically shaped copper and stainless steel powders as shown in the scanning electron microscopy images in Figures 1 and 2 were used in this study. The copper powder was received from Ecka Granules (Fürth, Germany), air atomised with a purity of 99% and a particle size (particle radius R) distribution from 5 to
as-received with oxygen inside the particle and a surface oxide layer; powder (1) after chemically removing the surface oxide layer using citric acid for 10 min; powder (1) heat treated in hydrogen for 30 min at 450
powder (3) with a 30 nm oxide layer obtained by heat treating in air (140
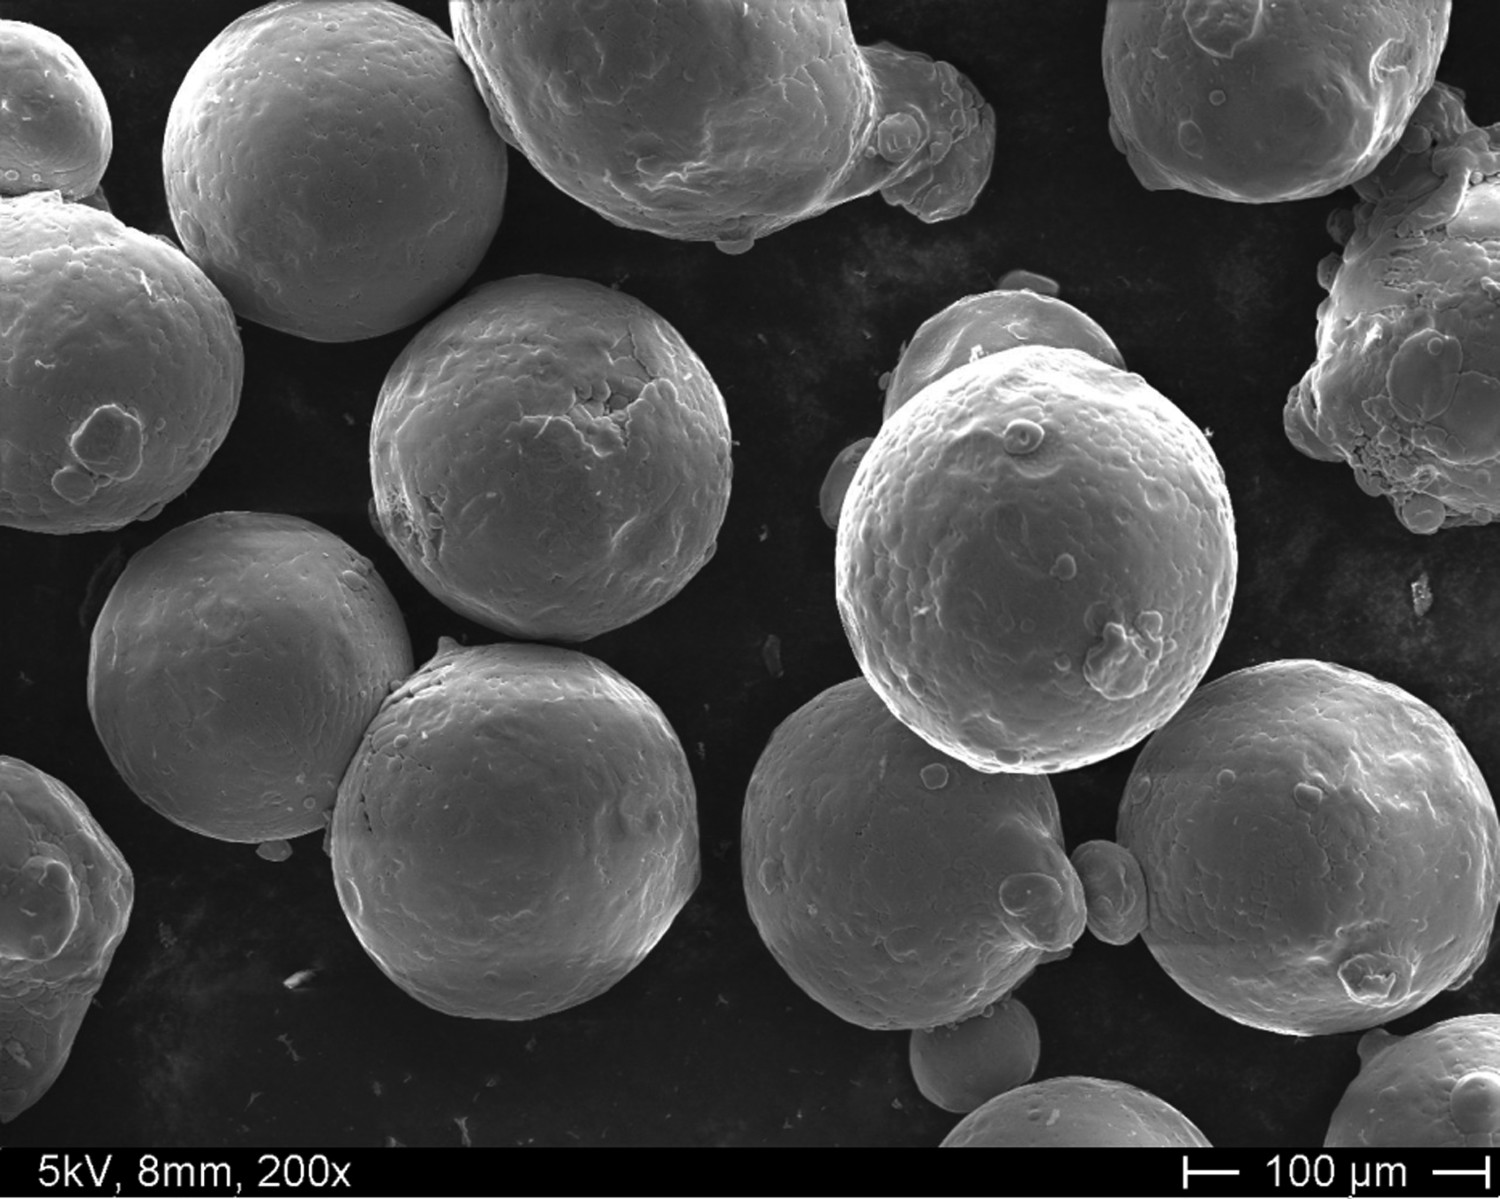
 m. The stainless steel powder (X5CrNi18-10, AISI 304) was inert gas atomised by the TU BA Freiberg (Freiberg, Germany) and had a particle size distribution from 2 to
 m. From both powders, only the R=50–
 m fraction was used. To asses the influence of oxygen on the electrical resistivity, the copper powder was used in the four following conditions:
 C to completely remove oxygen;
 C, 480 min).
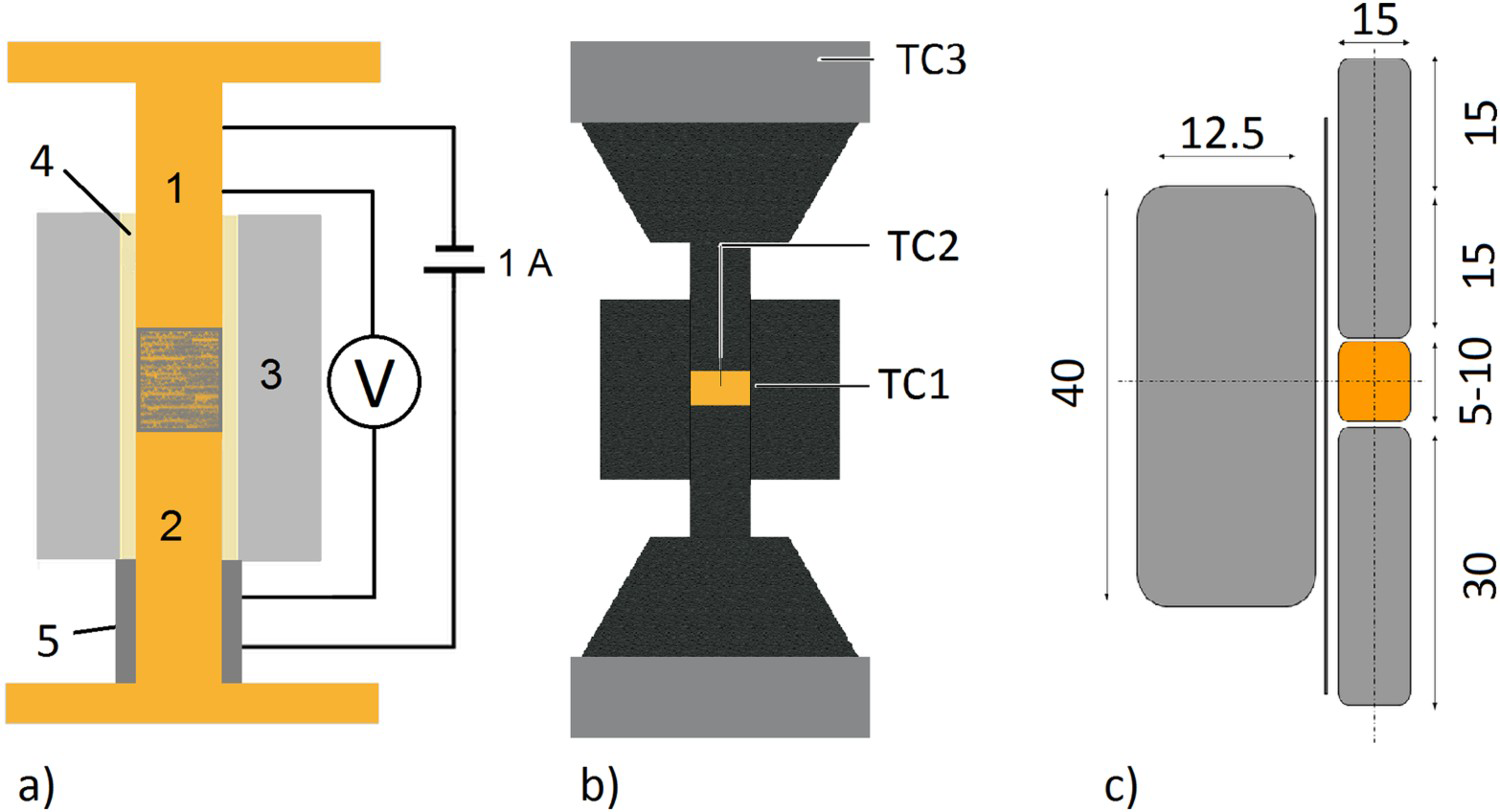
The thickness of the oxide layers was measured by transmission electron microscopy of lamellea cut out with a focused ion beam. The evolution of the electrical resistivity during cold compaction was determined using a tool consisting of 15 mm diameter copper punches and a steel die that was electrically insulated from punch and powder using a 0.2 mm thick mica foil (Safeway Isolierstoffe, Geraberg, Germany) as schematically shown in Figure 3(a). The pressure was applied using a Tira Test tensile and pressure testing machine. With a test current of 1 A the resulting voltage drop was measured with a Keithley 2000 multimeter. To track the evolution of the resistivity during the SPS process, after applying a pressure of 17 MPa the powders were heated with 100 K min
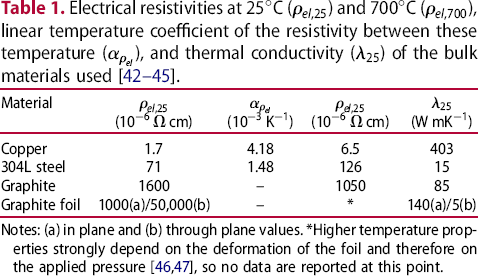
Copper powder with R=50–63 μm. AISI 304 stainless steel powder with R=50–63 μm. (a) Schematic representation of the tool to determine the electrical resistivity of the powders during cold compaction with the punches/electrodes (1, 2), die (3), mica foil insulation (4), spacer to hold the die (5), and powder in the middle of the punches. Subfigure (b) shows the standard tool setup for SPS compaction with the location of the thermocouples TC1 to TC3. (c) gives the dimension of the standard tool in millimetres. Notes: (a) in plane and (b) through plane values. *Higher temperature properties strongly depend on the deformation of the foil and therefore on the applied pressure [46,47], so no data are reported at this point. up to different temperatures and cooled down. Afterwards, the density was measured geometrically. The electrical resistivity was determined using the tool from the cold compaction experiments. These room-temperature values have then been used to calculate the resistivity at processing temperature using the temperature coefficient given in Table 1 and assuming linear temperature dependence. The SPS apparatus used was an HPD5 from FCT Systeme GmbH (Rauenstein, Germany) with a tool setup as depicted in Figure 3(b,c) consisting, if not otherwise mentioned, of conical graphite spacers, 15 mm diameter graphite punches, and a graphite die as well as a 0.2 mm graphite foil wrapped around the sample. Temperatures were measured using type K thermocouples in the die (TC1, the thermocouple used by the machine to control the temperature), inside the specimen (TC2), and in the upper electrode (TC3, a safety measure). The pulse pattern was usually 10 ms pulse and 5 ms pause.


 cm)
cm) )
) cm)
cm) )
)Relevant physical properties of the bulk materials used are given in Table 1.
Electrical resistivity of the powders during compaction
The room-temperature powder resistivities during cold compaction that provide the starting conditions prior to the start of the heating cycle are shown in Figures 4 and 5.
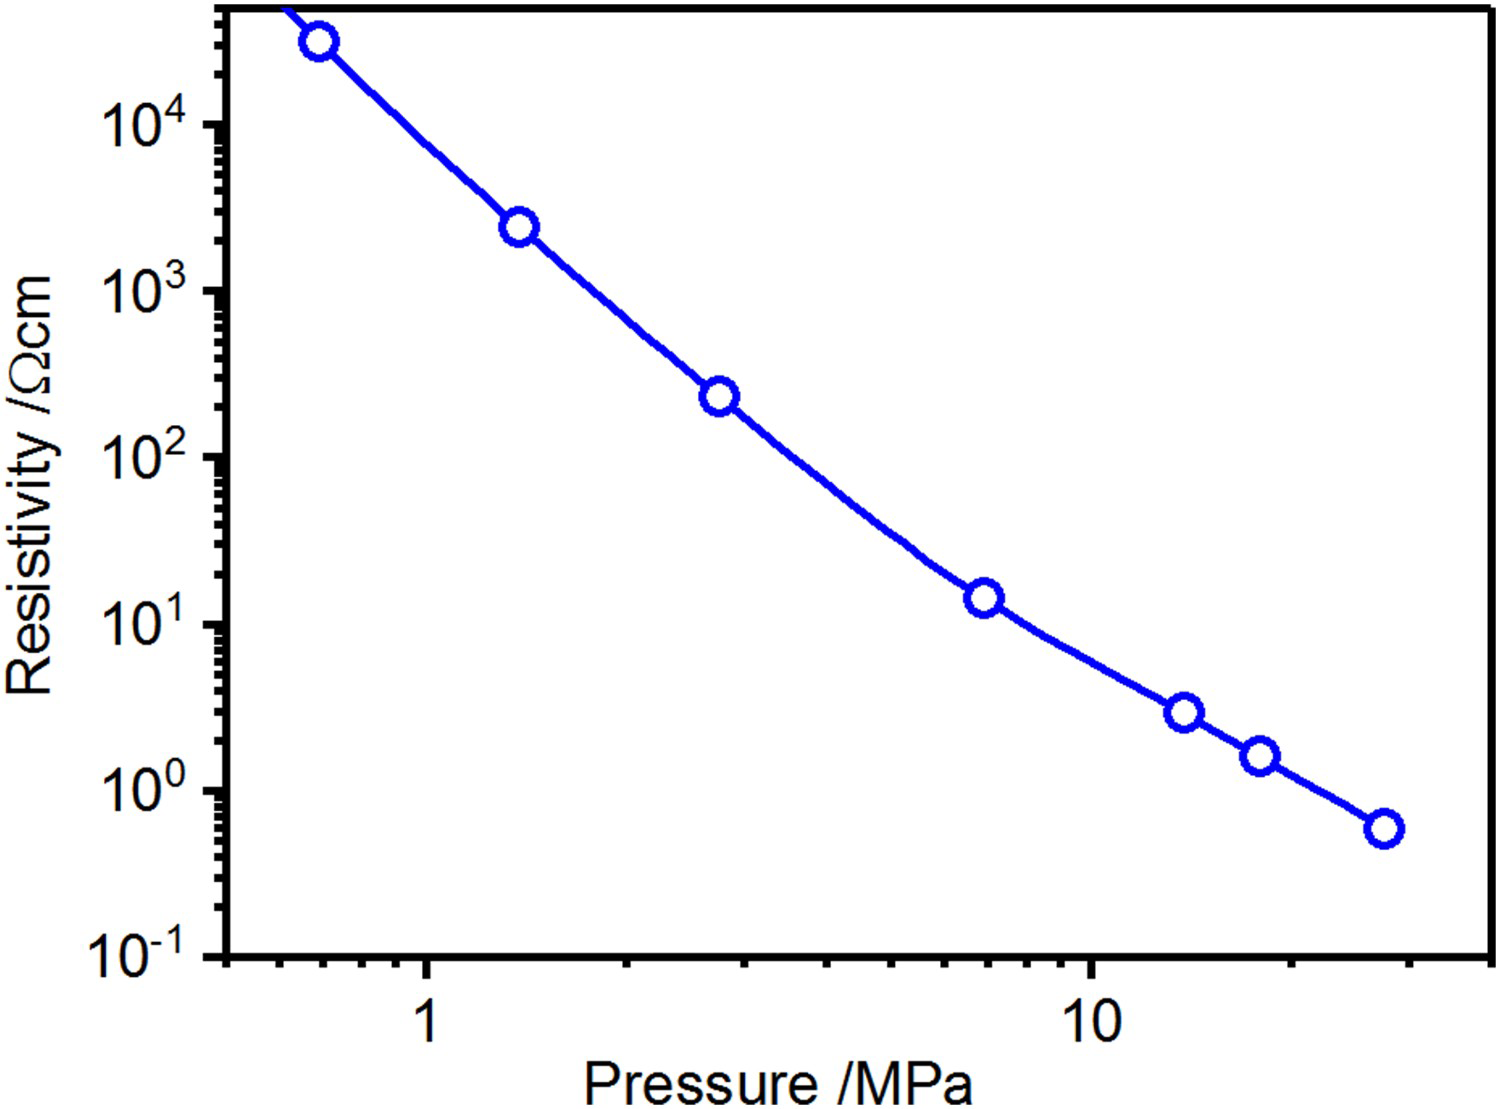
Electrical resistivity during cold compaction of copper with three distinct domains indicated for the powder with a 30 nm surface oxide layer. Hatched area represents the relevant range of electrical resistance for volumetric heating of the powder compact (cf. Section 3.3). Electrical resistivity during cold compaction of 304L stainless steel.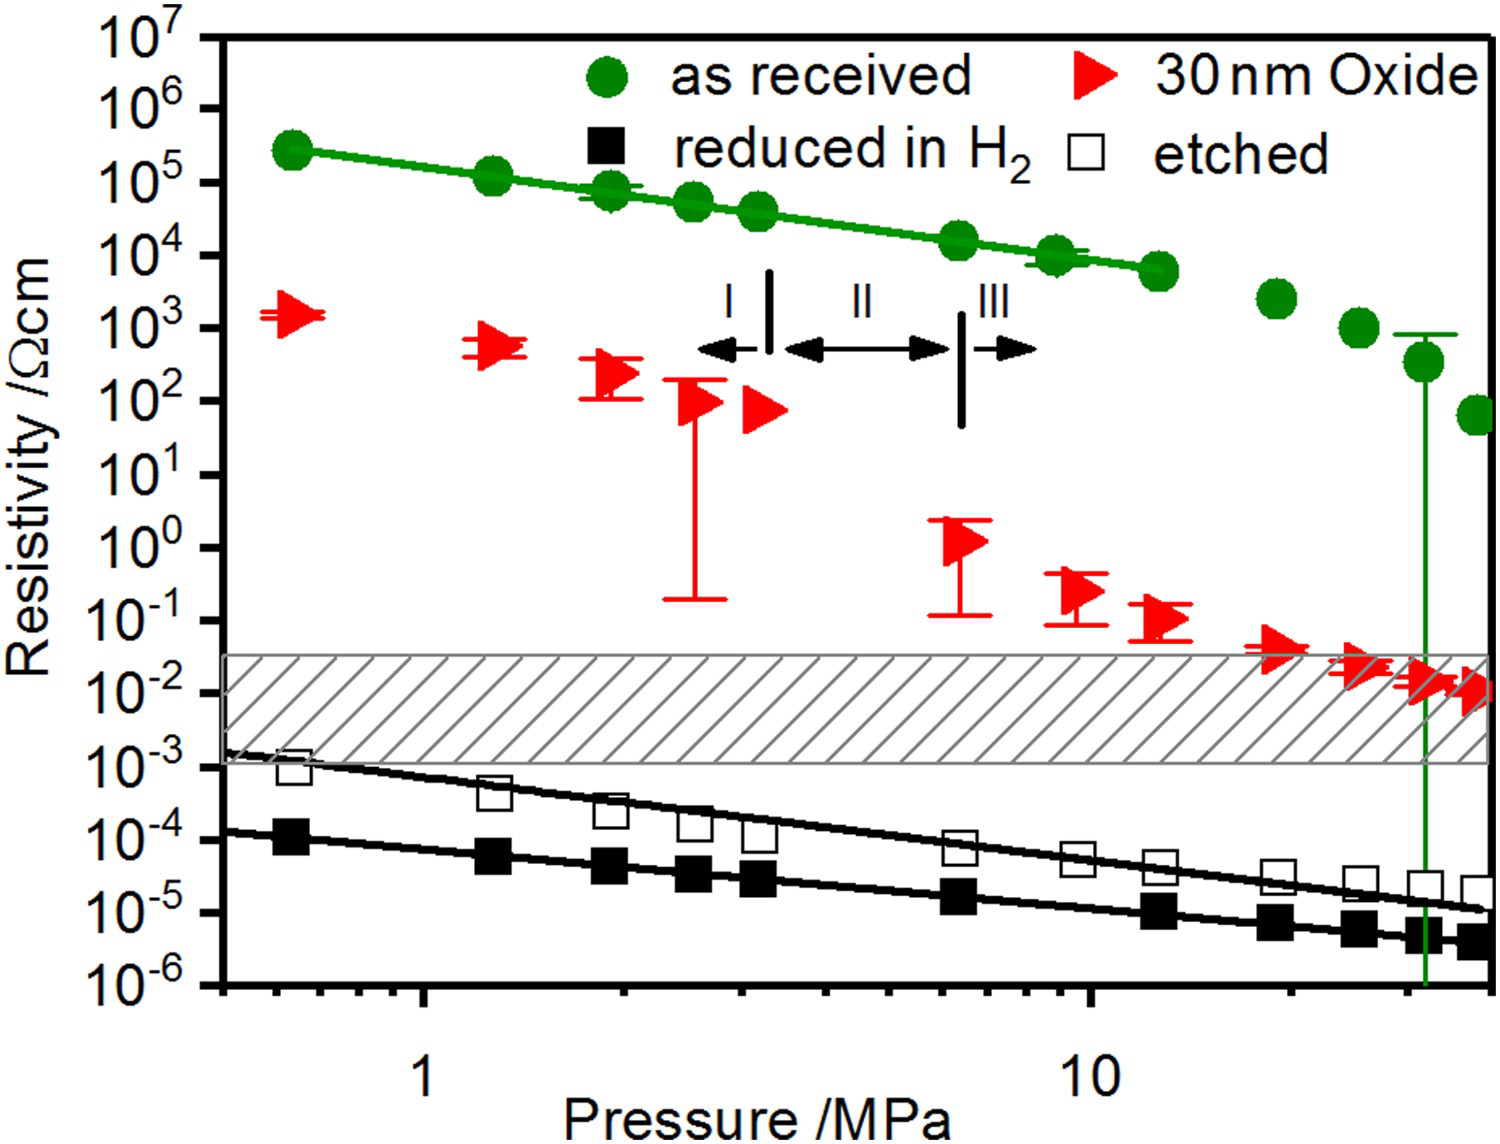
Starting with the data for copper depicted in Figure 4, the two curves of the powders after chemically removing the surface oxide layers and after completely removing oxygen using
 show a constant slope of
 in the log–log scale throughout the pressure range used. This indicates that plastic deformation leads to an increasing contact area between the particles accompanied by the reduction of the contact resistance [48]. For the oxygen free powder, between 0.5 and 50 MPa, the resistivity decreases by two orders of magnitude and almost reaches the literature value for bulk copper (cf. Table 1). For chemically etched powders, as a result of the remaining oxygen in the bulk of the particles that increases the resistivity of the material itself as well as its hardness, the resistivity of the disperse system is one order of magnitude higher but apart from that behaves in the same way.
The as-received powder with an average oxide layer thickness of 52 nm and that with an artificially grown surface oxide layer of 30 nm show a different behaviour. The electrical resistivity at low pressures is many orders of magnitude higher. The whole curves can be divided into three domains: initially, the resistivity decreases linearly in the log–log plot, starting from values of
 –
–
 . This domain can be attributed to plastic deformation of the particles without crucial destruction of the oxide layer. Here, the resistivity is dominated by the film resistance of the oxide layer as an additional resistance depending on thickness and electrical conductivity of the surface oxide layer. After a steep drop caused by the destruction of the surface oxide layer the curve becomes linear again, indicating the growth of the metallic contacts by plastic deformation. The higher resistivity compared to the powders without surface oxide layer can be attributed to the area of metallic contact being smaller than the contact area due to the remaining oxide fragments. The pressure necessary to destroy the oxide layer increases with its thickness [49].
The steel powders have only been tested in the as-received state. It has to be assumed that the powder particles have relatively thin oxide layers of about 5 nm [50] due to their atomisation in inert atmosphere. The curve has a more or less constant slope of about
 to
to
 in the double-logarithmic scale. This different behaviour is probably the result of a slow but steady destruction of the thin surface oxides.
Considering the hot compaction during heating with an applied pressure of 17 MPa, the curves for copper powder after chemically removing the surface oxide layer and steel as shown in Figures 6 and 7 look qualitatively the same. As the surface oxides of the steel powder have not been removed, the total resistivity drop is more pronounced there. Significant densification starts at about 500
Electrical resistivity during heating period in SPS of copper (surface oxide layer removed). Electrical resistivity during heating period in SPS of stainless steel. Hatched area represents the relevant range of electrical resistance for volumetric heating of the powder compact (cf. Section 3.3). C for copper and 650
 C for the steel powder (0.5–0.6 times the melting point
 ), after the major part of the resistivity reduction had already taken place. The latter most likely starts as soon as softening of the material or diffusion of oxygen from the surface into the bulk of the particle becomes possible at about
 .
.
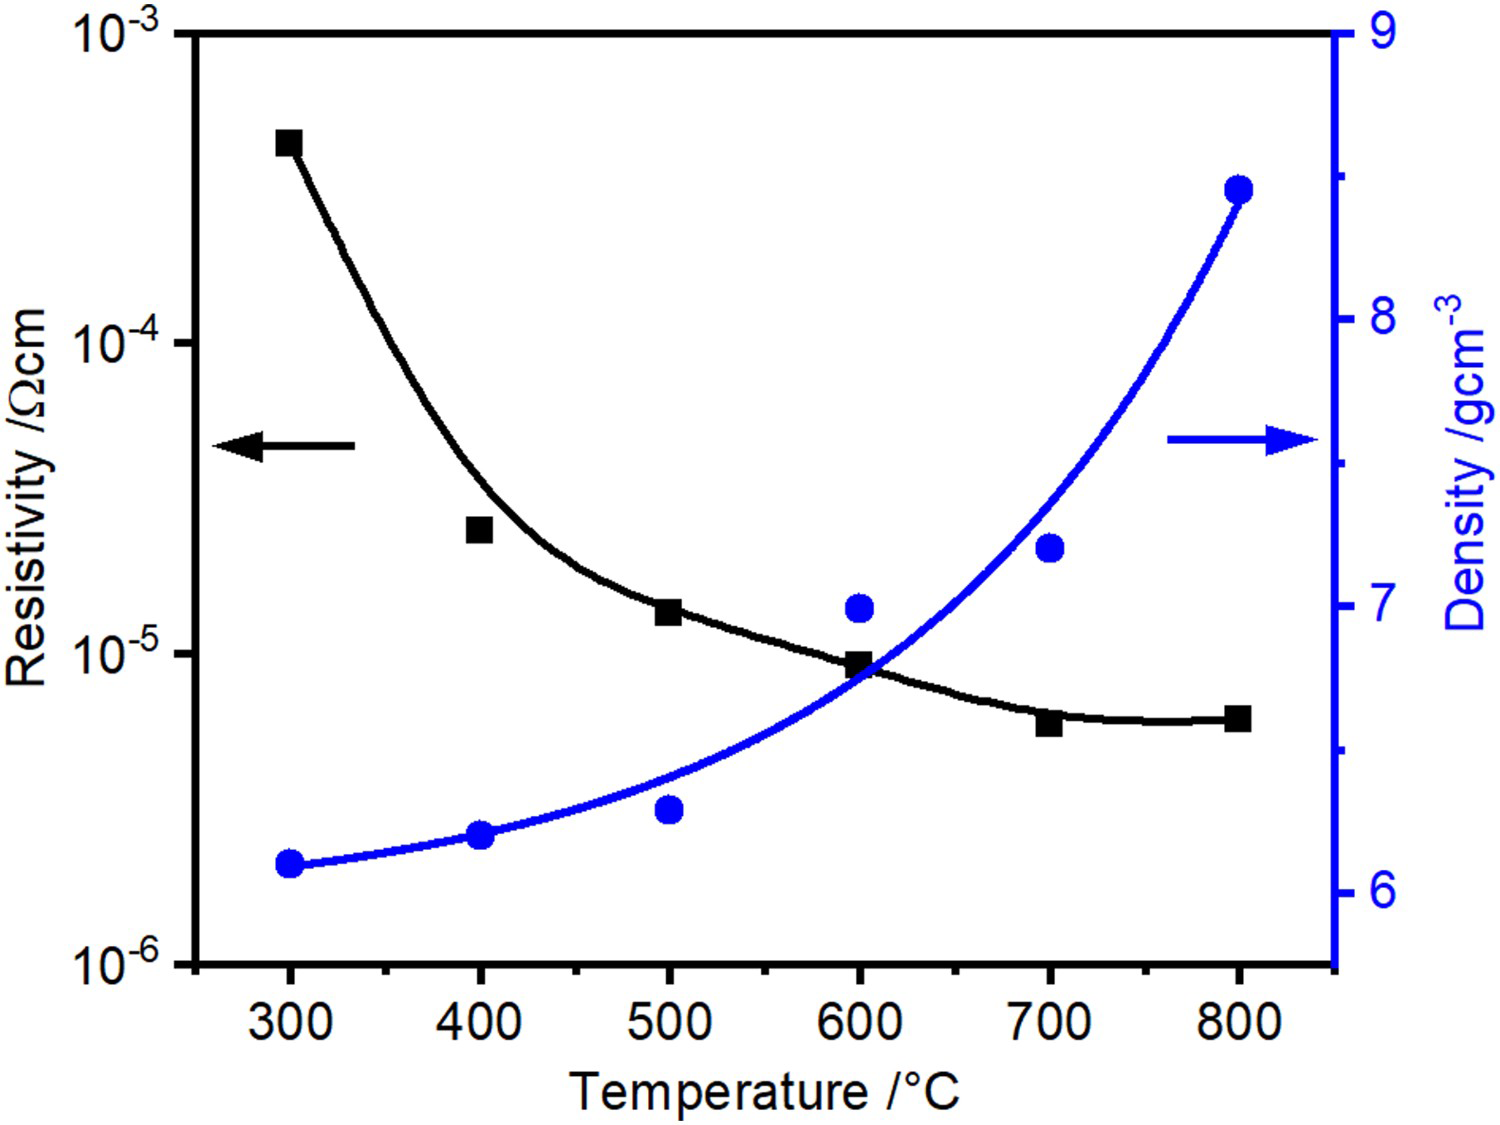
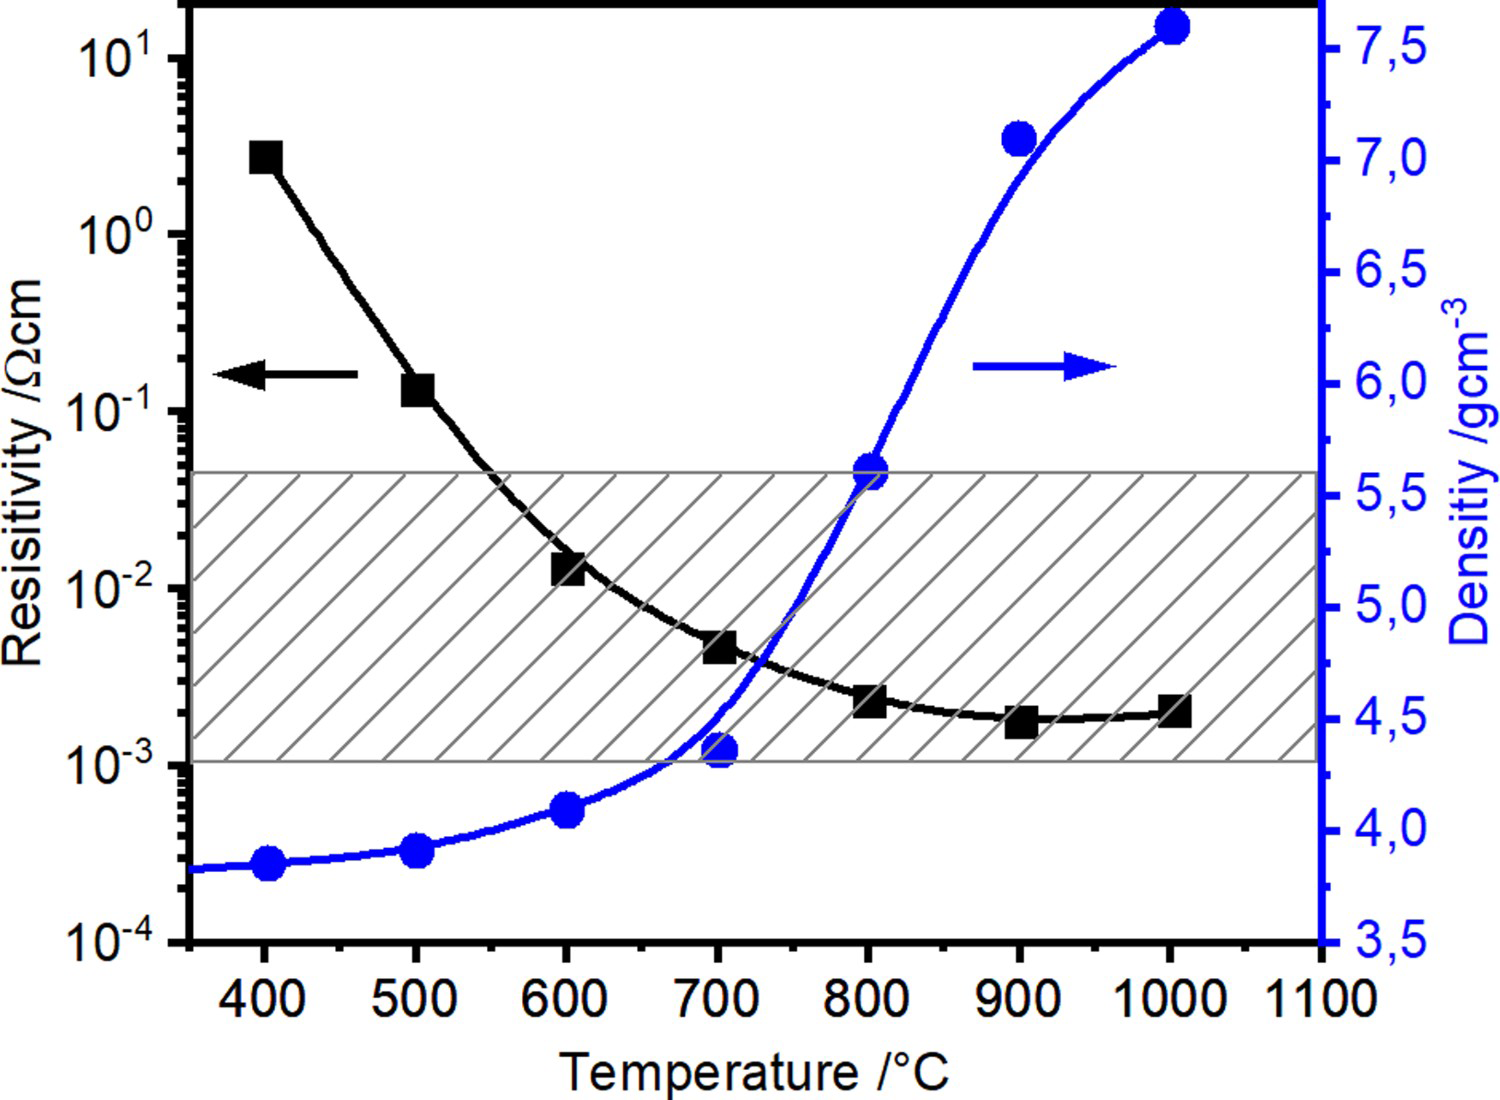
Figure 8 shows the voltage/current required to reach sintering temperatures between 500 and 1000
Current, voltage, and resistance of the whole setup to reach process temperatures from 500 to 1000
Current and current density for different heating rates in the moment the sample temperature reaches 500
 C for the graphite tool including graphite foils. The values are the same no matter if stainless steel or copper powder (chemically reduced surface oxides, up to 800
 C only) is used, indicating that for the setup and materials used, the electrical power necessary to hold the sintering temperature is independent on the resistance of the powder to be compacted. This finding will eventually lead to the conclusion that the current flow is determined by the resistances of punches and die, and that the punches are the dominating heat source. During the heating period, a proportionally higher current is required to increase the heating rate as shown in Figure 9.
 C.
C. C.
C.
Looking at Figure 10, it becomes clear that when using punches with much lower electrical resistance, e.g. such made from copper, a sufficiently high sintering temperature cannot be reached anymore within the limits of the power source (10 V, 6000 A). In addition to the insufficient heating by the punches, this is due to the efficient cooling via the electrodes.
Current and voltage for the use of copper punches (replacing the graphite punches in Figure 3(b)) for the compaction of copper powder with chemically removed surface oxide layer (powder (2)).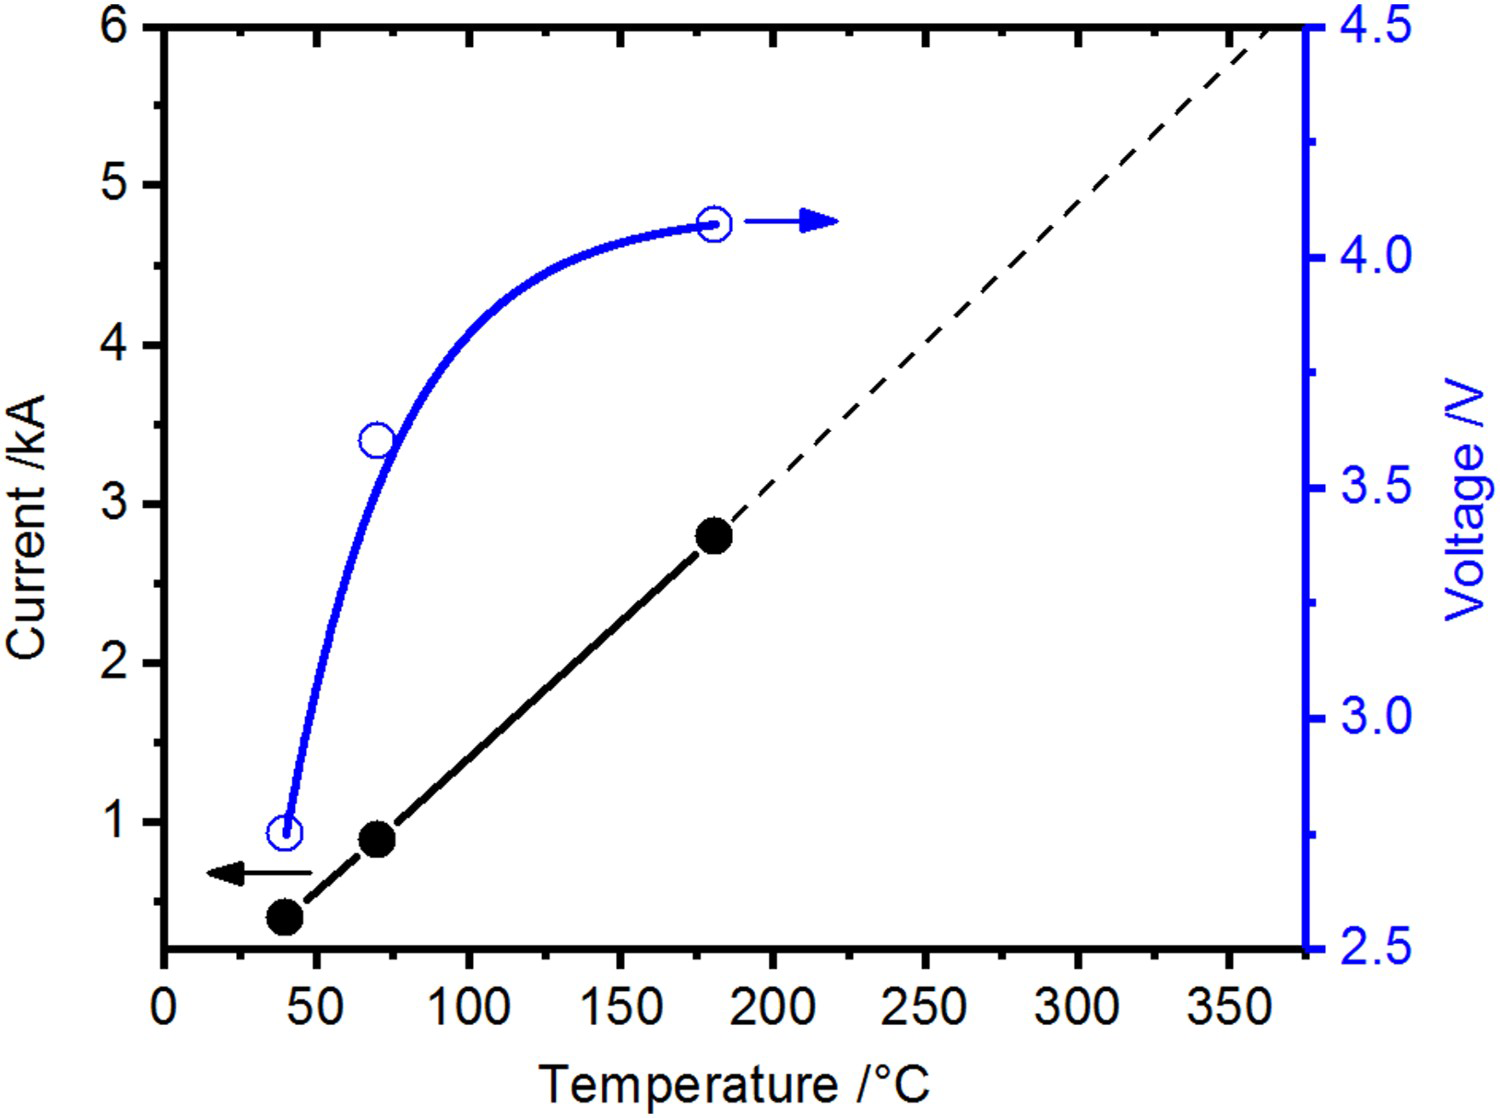
To asses the macroscopic temperature distribution in specimen, punches, and die, it is at first necessary to identify where the heat
Circuit diagram of the SPS apparatus, tools and specimen with typical values for the resistance of the graphite tool in m with the resistance of, current through, and voltage drop over the specimen,
 is generated. According to Joule's law (
 ), the resistance R of and the current I flowing through each part of the setup have to be considered. As the resistivity of the powder compacts has been experimentally determined, the resistances of all parts of the setup can be calculated using their dimensions and temperature-dependent resistivities. With the electrical circuit as shown in Figure 11, the fractions of current flowing through the die (
 ) and the powder compact (
 ) depend on their resistances relative to each other as well as the graphite foil mediated contact resistance between punch and specimen (
 ) as well as between punch and die (
 ). The latter two depend dramatically on temperature and the axial or the resulting radial pressure, respectively, and lie in the range of 1–
 [46,47].
 and
and
 , resistance of the horizontal and vertical graphite foils,
 and
and
 , and total current and voltage,
 and
and
 .
.
For a temperature of 700
The proportion of the current flowing through the specimen as well as the Joule heat generated inside of the specimen as fraction of the total heat as a function of the specimens resistance for a graphite tool with 15 mm diameter punches. The resistivity values correspond to a powder compact with 15 mm diameter and 10 mm height. Indicated are also the resistivities for the copper powder compact (no surface oxide layer) when reaching 600
 C the comparison of measurements of the total resistance of the setup with insulating Al
 O
O
 powder and using an insulated die led to estimated contact resistances of
 and
and
 . The fractions of the total current flowing through the powder compact and the resulting portion of heat generated inside the specimen relative to the total heat generation inside the setup are shown in Figure 12. For the geometry used in the experiments of this study, the fraction of the current flowing through the copper powder compact (powder with chemically removed surface oxide and an initial resistivity of
 ) is about 40% from the first current pulse until full density is reached. For the as-received and oxidised copper as well as for the stainless steel, virtually all the current flows through the graphite die during the initial heating period. Eventually, the fraction of current flowing through the latter specimen rapidly increases due to the resistivity of the powder compact being dramatically reduced from
 to
to
 as the surface oxide layers break and allow metallic contacts. As soon as this value is reached during the heating period, the fraction of current flowing through the sample reaches a constant value of ≈ 40%, as well.
 C and the stainless steel powder compact when reaching 900
 C.
C.
Note that even for the ‘best’ conditions only about 10% of the total heat is generated inside of the specimen and the major part comes from the punches acting as heating element (cf. Figure 10). When larger samples are produced and the current carrying area of the punch is increased less than that of the die, both the fractions of current flowing through the powder compact as well as the heat generated inside of it increase without fundamentally changing the picture. For a setup with a 50 mm sample and 90 mm outer die diameter up to 50% of the current flows through the specimen and up to 15% of the heat is generated there.
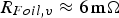
Figure 13 shows the temperature difference between the centre of the specimen (TC2) and the die (TC1) as a function of the isothermal holding temperature. The die temperature TC1 is used to control the thermal cycle. The temperature difference increases with increasing sintering temperature. If only TC1 is used as it is done in many publications, the real specimen temperature can be 5–20 K higher in the case of a copper specimen and 50–100 K for stainless steel.
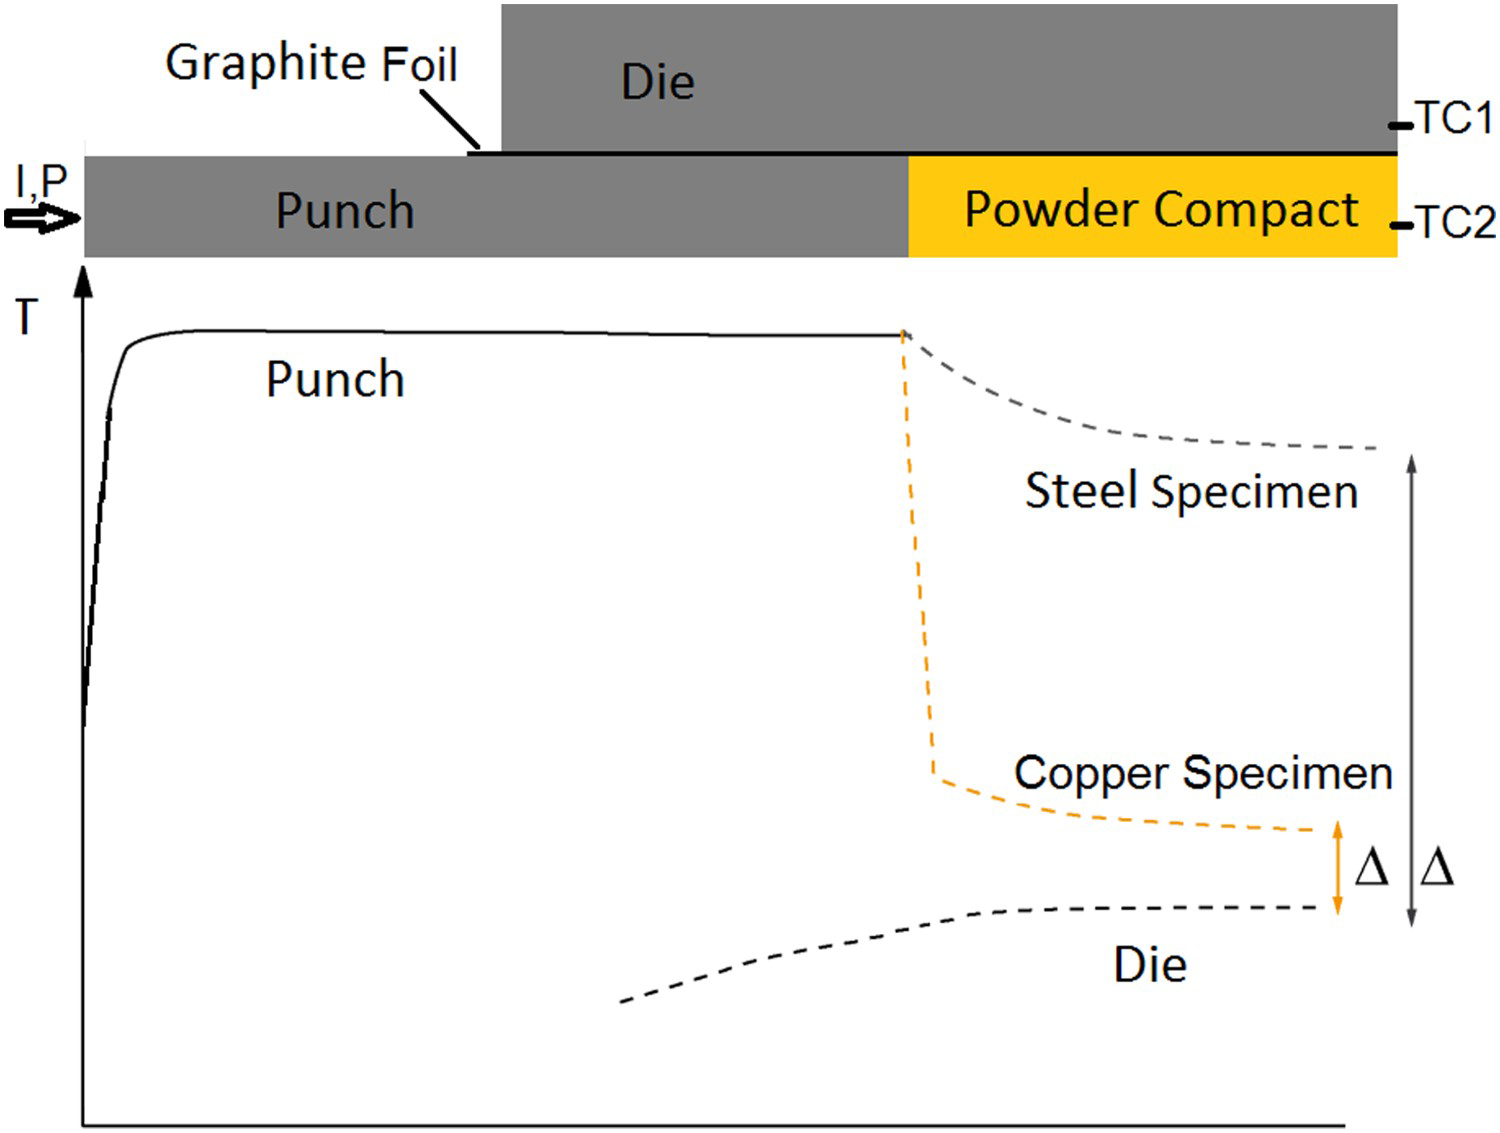
To illustrate the macroscopic temperature distribution, Figure 14 gives a schematic representation of the temperature along the pressing direction from the electrode over the punch and up to the centre of the specimen as well as in the die at TC1(depicted on the top of the figure). The macroscopic local temperatures are determined by the resistances, heat capacities, and current densities of all parts. Although simplified here, the temperature distribution is consistent with finite element simulations, for example [51]. The highest temperature can be found in the graphite punches. With the current being forced through the graphite punches and considering their high electrical resistance, they act as heating element for the powder compact. From the specimen faced end of the punches the temperature decreases towards the centre of the specimen and even more pronounced towards the graphite die with its low electrical resistance (cf. Figure 11). At this place (TC1 in Figure 3) the temperature is measured in many experiments. The resulting misinterpretation of the actual specimen temperature is indicated in the schematic depiction of the macroscopic temperature distribution by Δ. Experimentally determined values of Δ are shown as the temperature difference in Figure 13. The more pronounced temperature difference for the steel powders can probably be attributed to the limited but, unlike for copper powder, not negligible generation of Joule heat inside of the specimen (cf. Figure 12).
Temperature difference between thermocouple TC1 in the die and specimen core temperature TC2. Schematic representation to illustrate the temperature distribution in graphite punch, graphite die and copper or steel specimen as a result of the local current density, material properties and thermal conduction. Δ corresponds to the underestimation of the specimen temperature, cf. Figure 13.
The high electrical resistance of the graphite punches and the relatively low resistance of the graphite die determine to a great extent the total resistance of the system. Initially, the latter decreases as the resistivities of the graphite punches and the die and also that of the graphite foils decrease during heating. This is caused by the negative temperature coefficient of graphites resistivity as well as the compression of the graphite foils. During the holding period at sintering temperature, the resistance of the system was virtually constant during all experiments. In order to realise a constant input of heat, i.e. to hold the sintering temperature, according to Joule's law the total current (
 in Figure 11) flowing through the system has to be constant, too.
The current through the powder compact (
 ) is close to zero for a resistivity of the specimen higher than
 . This is true for powder particles with a more or less intact oxide layer, in this study for the as-received and artificially oxidised copper as well as the steel powder after cold compaction. The resistivity of these powders quickly decreases during initial heating. If the powder compacts resistivity falls below
 , a constant fraction of about 40–60% of the total current flows through the specimen. The exact percentage then depends on the diameter of the punch and the outer diameter of the die, i.e. the ratio of their resistances. This fraction of the current cannot be increased anymore, even though the resistivity of the powder compact further decreases by orders of magnitude during the continuing densification. This brings along the important implication on how to look at the process on a microscopic scale. The local temperature inhomogeneities are usually discussed in two ways:
One is the adiabatic case [26] that considers heating by a constant current during one single pulse or some consecutive pulses, without conduction of heat away from the source, i.e. the contact plane. This is being justified by the shortness of a current pulse with a duration of some milliseconds, an assumption that is far from realistic considering that thermal diffusion times along distances of the size of a typical powder particle are in the order of microseconds [39].
The other way is to consider a voltage drop over a single particle contact instead of a constant current [52]. This voltage drop usually depends on the particle size and is derived from a field strength of
 V cm
V cm
 . This field strength could be realised if the maximal voltage of the system (
 V) drops over the sample (with a height of 1 cm) alone. This approach is totally correct if an electrically insulated die is used and if the powder compact has a much higher resistance than the punches. This is typically true for the capacitor discharge technique, where the electrical resistance of the powder compact determines the current flow and this resistance is again determined by the contact resistances between particles. If the contact resistance decreases because the contact grows or the surface oxide layer is damaged, the constant voltage leads to a rising current. For Joule heating (
 ), a linear reduction of the resistance accompanied by the quadratic impact of the current leads to an ever faster increase in the contact temperature. However, this should not be applied in SPS, where the current through the powder compact and consequently through each particle–particle contact was shown to be virtually independent of the powder compacts resistivity. This holds true as soon as the resistivity of the powder compact lies below
 , i.e. in almost every case for metallic materials, at least after the initial heating period.
If the current flowing through each particle contact
 would be known, the temperature difference between the contact and the centre of the particles could be estimated. As the current through the specimen
 can be considered to be about one half of
 (see Figure 12), the contact current would then be
 and powder particles
 , the current through each contact will be in the order of 10 mA for powder particles of
 m in diameter. This contact current deceases proportionally to
 . Extrapolated from capacitor discharge experiments, a contact current of 10 mA leads to a microscopic temperature difference between particle–particle contact and centre of the particle in the order of 1 mK [35] for a copper particle with a radius of
 m and a contact radius of
 m. This geometry represents the initial stage of low pressure sintering and the temperature difference would further decrease as the current density decreases with the growing contact radius. A comprehensive discussion of this matter is to be published in the second part of this article series [41].
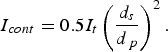
The efficiency of SPS is often attributed to the pulsed nature of the direct current. Figure 15 shows the current flow through the electrodes directly captured from a Hall sensor located at the top electrode for a pulse pattern (pulse-on time
 and pause time
 ) of
) of
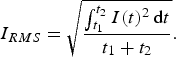
 . The input of Joule heat is determined by the root mean square current,
 . This is the direct current value that would generate the same heat as the pulsed current during any time interval
 . The current at a specific time
 and the RMS current are connected by
 has to be higher than a steady constant current and, consequently, effects like microscopic temperature inhomogeneity are often supposed to be much more pronounced using a pulsed current. But how significant is this effect? For rectangular pulses as approximately realised by the equipment manufactured by FCT Systeme GmbH (as used in this study), the amplitude or peak value of the current
 that is reached during
 can be expressed by
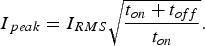
 C. With the often used pulse pattern of
 , the peak current is increased to ≈ 600 A. Consequently, pulsing the current cannot be expected to significantly affect densification [53]. To increase the peak current by an order of magnitude up to the machine limit of 5000 A, a pulse pattern of about 5:250 ms would be necessary. Figure 17 shows the maximum temperature that could be reached in the copper specimen for different pulse patterns. A pulse pattern like 5:250 cannot be used as in this case the maximum temperature that can be reached is reduced to ≈100
 C. The reason, therefore, is the limitation of the machine's voltage which depends on the pulse pattern in the same way as the current.
In SPS the major part of the Joule heat is generated in the graphite punches that act as an efficient heat source in direct contact with the sample. Only up to 10% of the electric heating occurs directly in the volume of the (conducting) specimen.
Pulse pattern with arbitrary units for the current measured using a Almemo V7 device from Ahlborn (Holzkirchen, Germany) with pulse-on time (
Calculated current that is reached during pulse-on time (
Measured maximum temperature that can be reached in the HPD5 SPS machine for different pulse patterns and a linear fit as function of the loading level (
 ) of 10 ms and pause time (
 ) of 5 ms.
 ) for a constant RMS current of 500 A and different pulse-on times as a function of the pause time (
 ) between two pulses.
 )).
)).
The high electrical resistance of the graphite punches in combination with the low electrical resistance of the graphite die to a great extent determine the electrical resistance of the whole setup. The current flow through the powder compact is then independent of its decreasing resistivity during densification. For powder compacts with an electrical resistivity
 , about 50% of the current flows through them. This is the case for all metal powders if they do not have a thick, intact oxide layer. For specimen with higher resistance, the current flows through the punches. The conducting die and the punches then again act as heating elements. Using non-conducting die materials would then render the process impossible, as there is simply no current flow.
With the resistance of the tool -the graphite punches especially - dominating the total resistance, the electrodes have to be considered a source of almost constant current. That means, for the determination of the microscopic temperature distribution, one cannot assume a voltage drop over the particle contacts, as done in most publications, but has to consider a constant current per particle. This current is in the order of 10 mA for 100 μm particles, scaling with the particle size by
 . A detailed discussion of the consequences will follow in another paper currently in preparation [41].
Considering the macroscopic temperature distribution, the heat coming from the punches leads to a systematic underestimation of the specimen's temperature, if it is measured in the die as done in many cases. It can be expected that this error in temperature measurement explains a large part of the allegedly lower temperatures reported for the consolidation of metallic powders using ‘spark plasma sintering’. It is, therefore, advisable to always check where temperature measurement was done when assessing published results of SPS experiments.
Footnotes
Disclosure statement
No potential conflict of interest was reported by the authors.
Notes on contributors
References
 during spark plasma sintering
 O
O
 powders