
Abstract
Of the common mental disorders, substance use disorders are characterized by low rates of help-seeking relative to mood disorders and anxiety disorders, with the exception of specific phobia and social phobia [1–3]. Low rates are particularly obvious for alcohol use disorder. These studies report rates of treatment contact for any mental health problem among those with current alcohol use disorder. Treatment contact specifically for alcohol use disorder has been reported to be no more than 20% in the year of onset, even for alcohol dependence [2, 4] and specialist treatment of current alcohol use disorder is only approximately 10% [5].
One reason why help for alcohol problems is often not sought may be that for many people alcohol disorders develop in late adolescence and early adulthood and remit subsequently, without treatment [2, 4, 6–10]. Even among adults there is marked remission over time [11]. Therefore people with alcohol problems might be expected to report that they ‘thought the problem would get better by itself’ or that they ‘did not need help’ rather than other attitudinal or practical barriers to care; this has been shown for adults by Hingson et al. [12].
Most community surveys and longitudinal studies cover a number of mental health diagnoses. Often questions about reasons for not seeking help are asked only once, covering all problems experienced, so that it is not possible to ascertain which problems the respondents had in mind when reporting a particular reason for not seeking help [1, 13]. Therefore it is unclear what barriers were specific to alcohol problems. Grant, and Saunders et al. have ascertained alcohol-specific reasons [14, 15]. However, in all of these studies respondents are asked about reasons only if they have reported ever ‘not seeking help when they thought that they should have’.
This paper describes treatment seeking and reasons for seeking or not seeking help for alcohol problems in a birth cohort aged 25 years of age at last interview. Analyses focus on the period back to the previous interview at age 21. Everyone who reported any alcohol problem that could count towards a DSM-IV diagnosis of alcohol disorder was asked about treatment for their drinking or drinking problems. If there was no such treatment contact they were asked about reasons for not seeking help or advice for problems with drinking. The aims of the present paper were to (i) document what treatment contact did occur and for what reasons; (ii) document the reasons why young adults with alcohol problems did not seek help or advice; (iii) investigate if these reasons for not seeking help differed by alcohol diagnosis, sex and education; and (iv) report alcohol-related outcomes in those who thought that they did not need help.
Methods
Design
The data reported here were gathered during the course of the Christchurch Health and Development Study (CHDS). The CHDS is a longitudinal study of an unselected birth cohort of 1265 children born in New Zealand in the Christchurch Urban Area during a 4 month period in mid-1977. This cohort has been studied at birth, 4 months, 1 year, annual intervals to age 16 years, and at ages 18, 21 and 25 years [16]. Ethics approval was obtained for each round of data collection.
Participants
The cohort members included in the present study were the 1003 interviewed at 25 years. Interviews were carried out face to face except for 229 conducted by telephone because the cohort members were outside New Zealand (n = 165) or unable to meet with interviewers (n = 64). The participants comprise 79% of the original cohort. By age 25, 31 (2.5%) had died. Written informed consent was sought from all participants.
Measurements
Alcohol diagnosis
At age 25 cohort members were asked about alcohol problems in each of the years since the previous interview at age 21. The questions came from the Composite International Diagnostic Interview (CIDI) [17]. Individuals who met the relevant DSM-IV criteria [18] within 1 year were classified as having alcohol dependence or alcohol abuse for that year. Anyone who reported at least one problem but who did not meet criteria for diagnosis was classified as having ‘problems only’. These ‘problems only’ people failed to meet criteria because abuse problems occurred only once, not repeatedly, or there were fewer than three dependence symptoms in 1 year.
Alcohol consumption
Alcohol consumption in the previous 12 months was reported for the largest amount of alcohol consumed on a single drinking occasion and for the last drinking occasion. Using questions similar to those used by Casswell et al. [19], consumption was recorded separately for each type of beverage and container, which should have reduced underreporting [20]. Frequency of drinking was also recorded.
Alcohol-specific treatment
Participants who reported any alcohol problem were asked if they had ever consulted a doctor or sought other advice, counselling or treatment because of their drinking or problems associated with their drinking in the period since the previous interview. The source of treatment, the number of visits and reasons for seeking treatment were also recorded.
Reasons for not seeking help
All those who reported any alcohol problems but who had not made treatment contact for these problems were asked a series of questions about reasons for not seeking help.
Education
After preliminary analyses with more categories, education was collapsed into two levels: enrolled for university by age 21 or not enrolled. Thirteen people not interviewed at age 21 and without a degree at age 25 were classified as not enrolled.
Statistical analyses
Proportions were compared using χ2 tests for contingency tables or logistic regression with testing for the proportional odds assumption when the outcome consisted of ordinal categories (alcohol consumption). Precision of estimates is indicated by 95% confidence intervals. SAS version 9.1 (SAS Institute, Cary NC) was used for all analyses.
Results
Alcohol-specific treatment contact
Approximately one-third of cohort members (351/1003) reported problems arising from their drinking over the previous 4 years. No questions about treatment were asked of the other 652 who did not report any alcohol problems. Only 26 reported treatment contact for their drinking or problems associated with it. The percentage who made treatment contact was strongly related to diagnosis (Table 1), ranging from 2.5% for those with problems but no diagnosis to 23.6% for those with dependence (χ2=26.0, df = 2, p < 0.0001). Nonetheless, only half of those making treatment contact had dependence, because of the larger numbers with abuse or problems alone.
Alcohol diagnosis and alcohol-specific treatment contact between 21 and 25 years of age
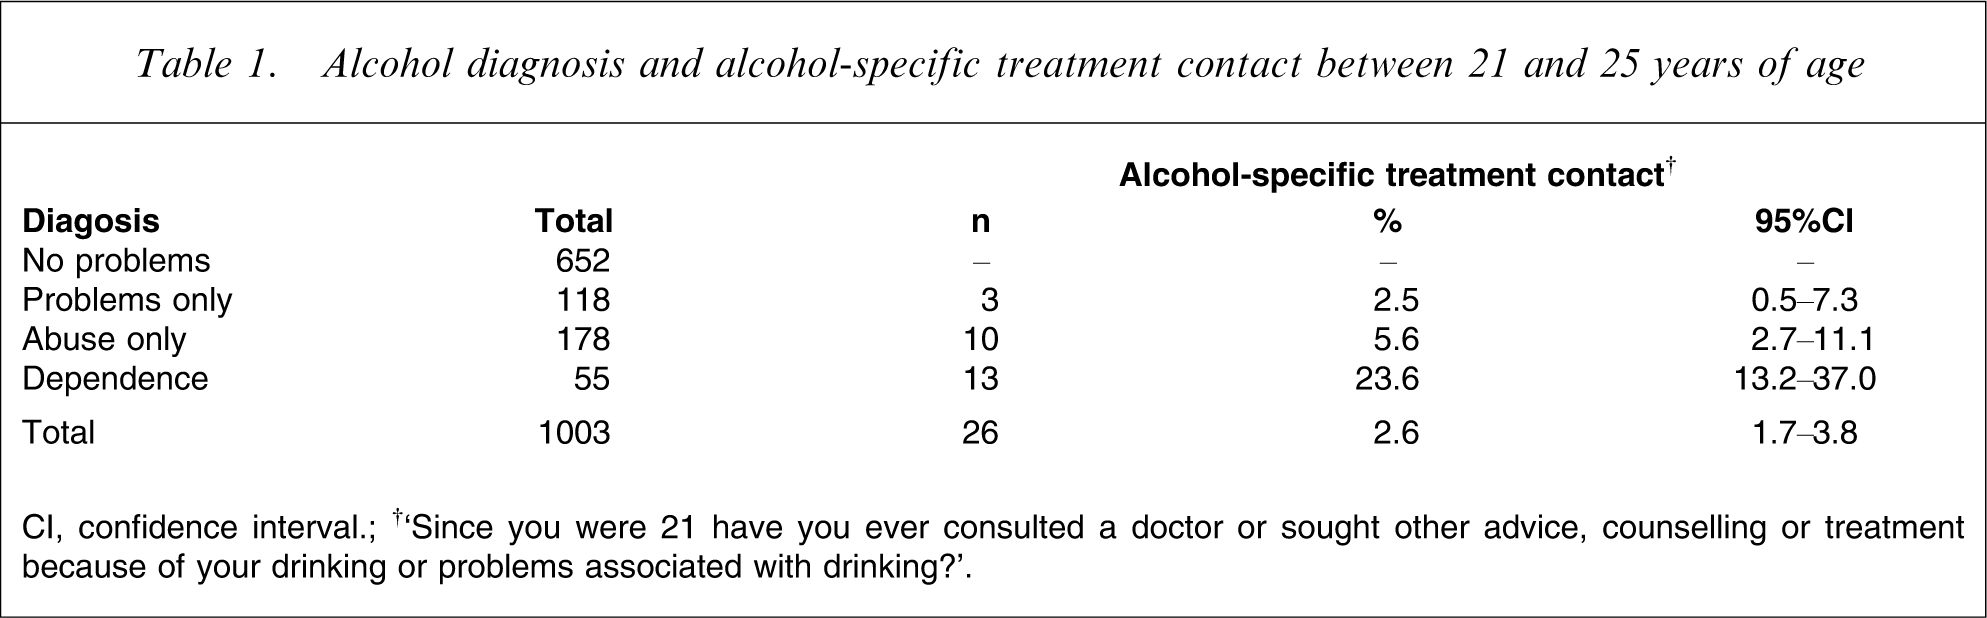
CI, confidence interval; †‘Since you were 21 have you ever consulted a doctor or sought other advice, counselling or treatment because of your drinking or problems associated with drinking?’.
The extent of treatment varied. Approximately one-quarter (7/26) made treatment contact only once whereas one-third (9/26) had an inpatient stay or nine or more visits. The source of treatment was also variable. Ten made contact with alcohol and drug specialist services, which is a rate of treatment contact with this sector of 1.0% over this 4 year period for the whole cohort. Of the remainder, four saw other mental health specialists, six saw only a general practitioner (five for physical problems to do with vomiting, kidneys, liver or pancreas) and six attended anger management or met with family or others.
Table 2 shows the reasons given for seeking treatment in those who did make treatment contact. Nearly three-quarters reported that they felt they needed treatment (19/26) but only one-quarter (6/26) felt the need for treatment in the absence of pressure from any of the other groups in Table 2. The seven who did not feel they needed treatment were led to treatment by parents (n = 3), court or police orders (n = 2) or some other groups.
Reasons for making treatment contact (n = 26)†
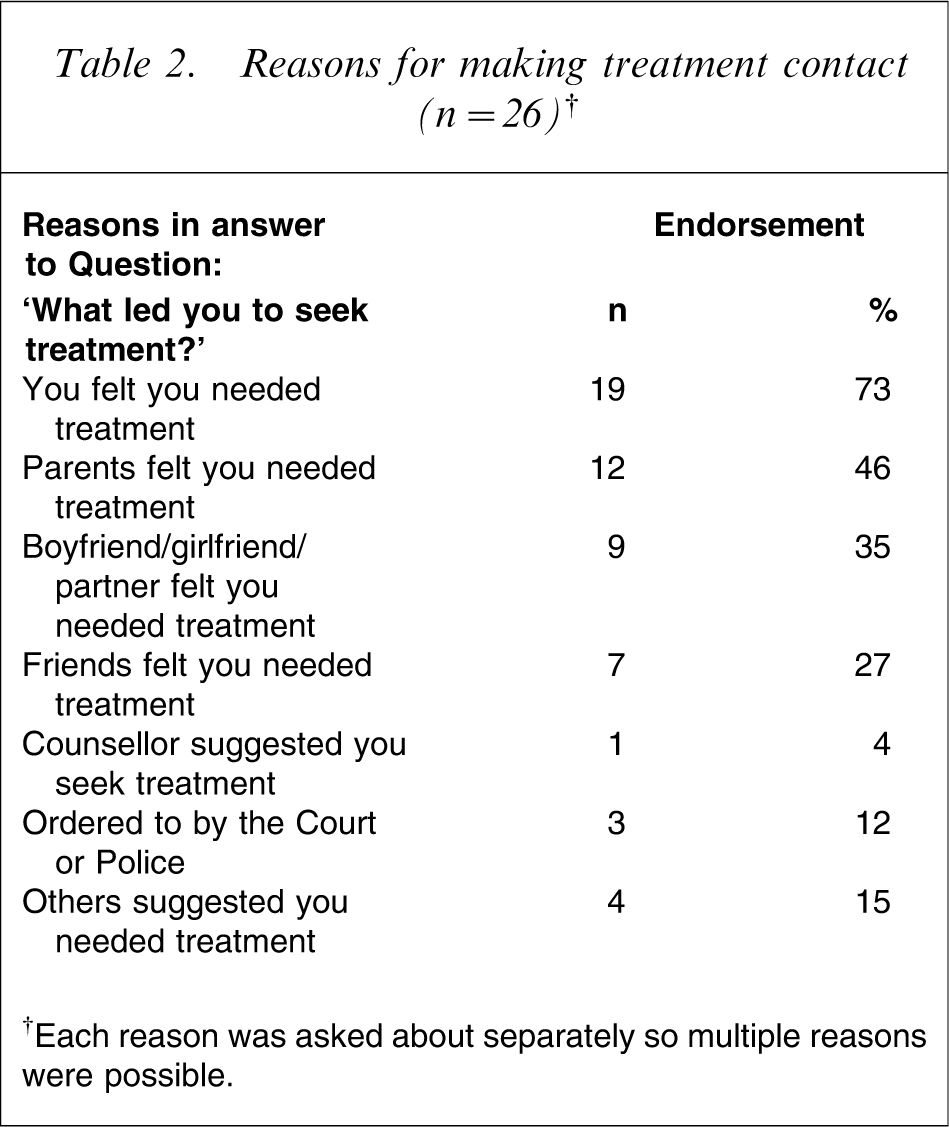
†Each reason was asked about separately so multiple reasons were possible.
When asked ‘how helpful was the treatment and support offered to you?’, nine (35%) said that it had been ‘very helpful’, 12 (46%) said ‘helpful’ and five (19%) said that it was ‘not helpful’. No-one reported that it was ‘damaging’. There was no relationship obvious between feeling a need for treatment and satisfaction with treatment: the numbers reporting that the treatment was not helpful were 3/19 for those who felt they needed treatment and 2/7 for those who did not feel a need for treatment (Fisher's exact tests, p = 0.59).
Reasons for not seeking help or advice
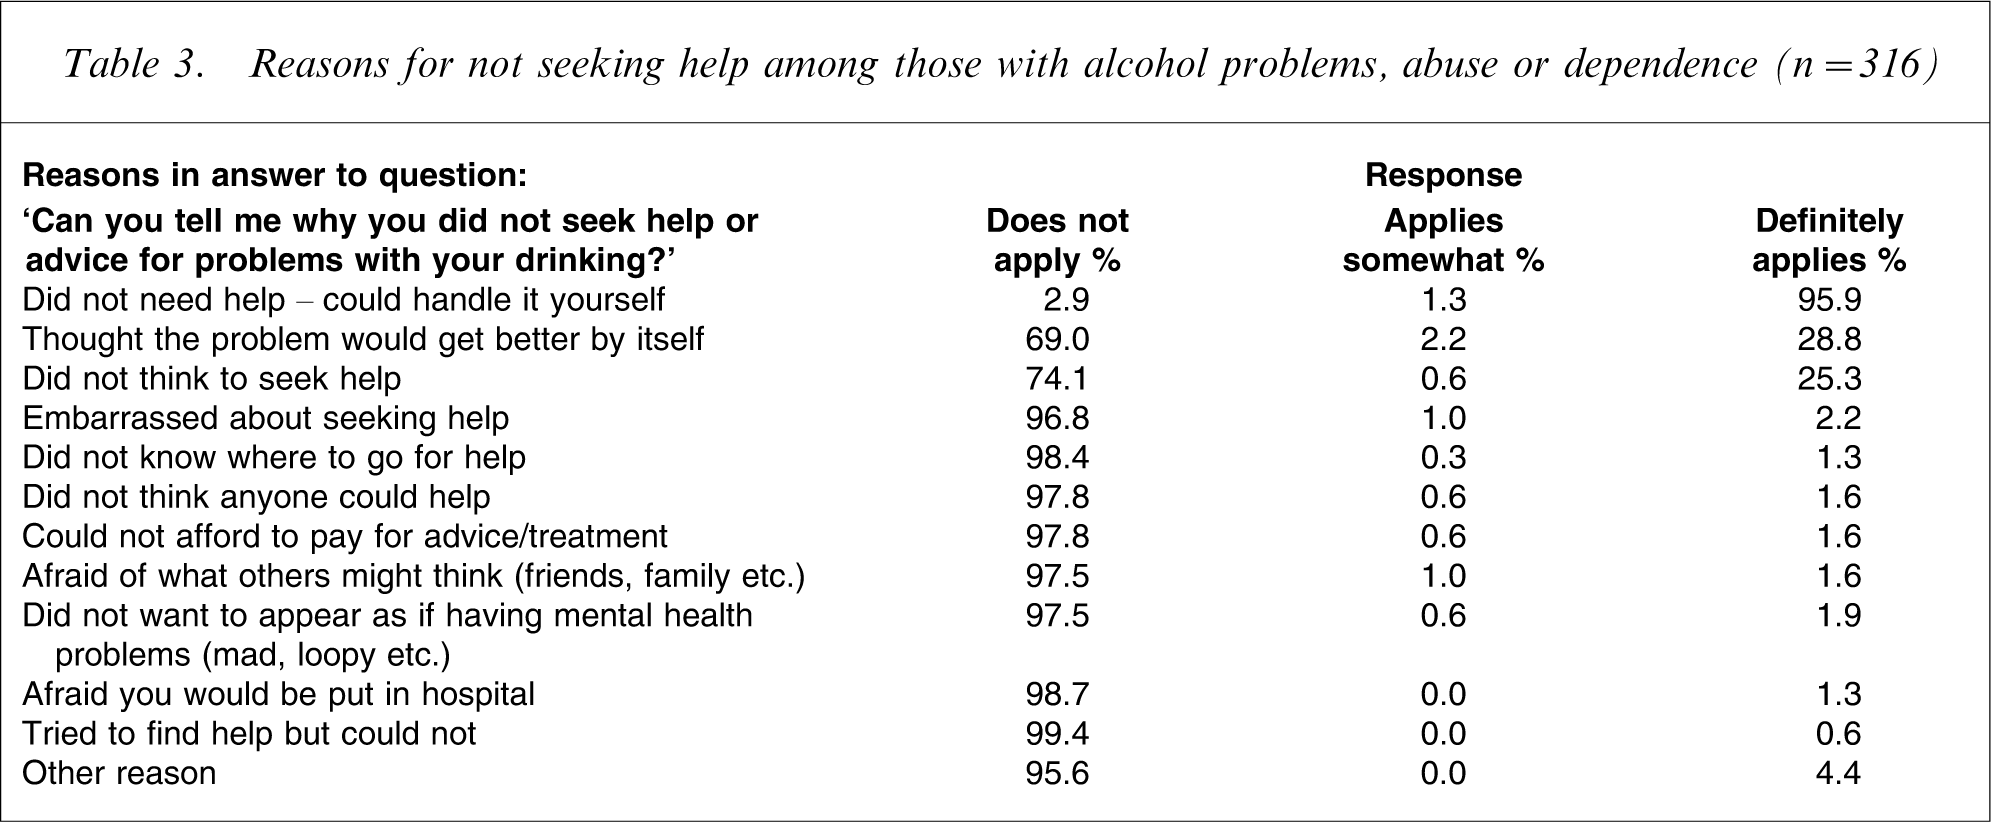
Everyone who had reported alcohol problems but who had not made treatment contact was to be asked about their reasons for not doing so. However, because of interviewer error, nine of the 325 who should have been asked skipped these questions. Eight had problems but did not meet criteria for diagnosis and one had met criteria for abuse. Therefore the number asked about reasons for not seeking help was 316.
Table 3 shows that nearly everyone (95.9%) did not seek help because they thought that they could definitely handle the problems they had reported with their drinking. Around one-quarter definitely thought that the problem would get better by itself (28.8%) or did not think to seek help (25.3%). Very few thought that any other reasons for not seeking help applied to them (<5%).
Reasons for not seeking help among those with alcohol problems, abuse or dependence (n = 316)
The severity of problems (as indicated by diagnosis), sex and education were investigated as possible correlates of reasons for not seeking help among those who did experience alcohol problems and did not make treatment contact. Each correlate was analysed on its own (unadjusted) and then in a joint model (adjusted). Results are seen in Table 4 for predicting who thought ‘the problem would get better by itself’ and who ‘did not think to seek help’ and are similar for both outcomes. Surprisingly, the more serious the diagnosis the more likely people thought that the ‘problem would get better by itself’ (p ≤ 0.009) and a similar but non-significant trend was seen for failing to ‘think of seeking help’ (p = 0.07, 0.16). Men were much more likely than women to give these reasons for not seeking help (p ≤ 0.002). Unadjusted and adjusted odds ratios (ORs) differed little, in spite of a trend for these men to have more severe alcohol problems (p = 0.08), with 16% having dependence, 54% abuse only and 30% problems only, whereas for these women the percentages were 10%, 49% and 41%, respectively. Education was not significantly related to either outcome, on its own (p ≥ 0.15) or in the joint models (p ≥ 0.50).
Diagnosis, sex and education and reasons for not seeking help for alcohol problems among those with problems, abuse or dependence (n = 316)
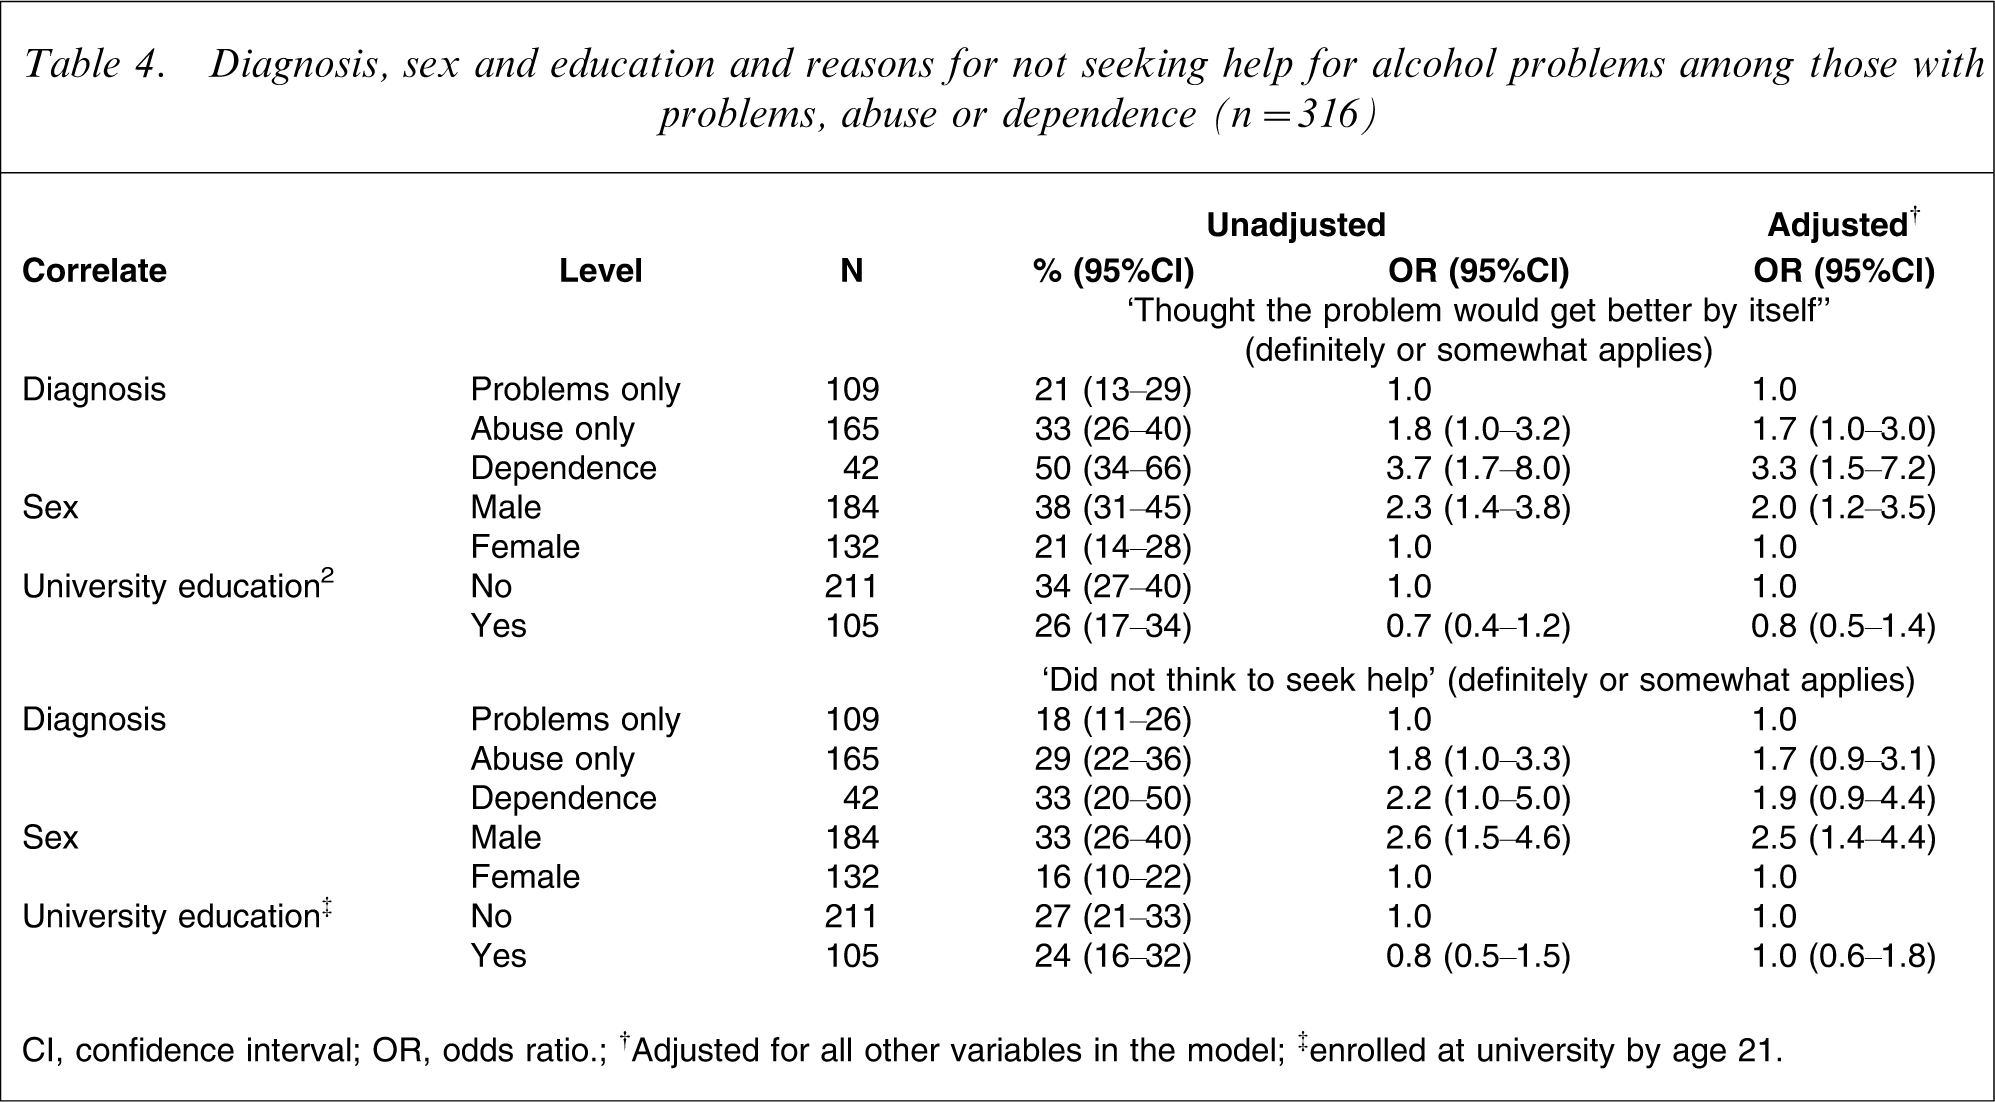
CI, confidence interval; OR, odds ratio; †Adjusted for all other variables in the model; ‡enrolled at university by age 21.
Outcomes for those who ‘did not need help’
What was the outcome for those who reported alcohol problems but said that they definitely or somewhat ‘did not need help’, that they could ‘handle it themselves’? This was investigated in two ways: by looking at diagnostic outcomes in the year before interview at age 25 and by looking at drinking in that year. The 47 cohort members who reported alcohol problems only in that final year and not in the 3 years before were excluded from these analyses on the grounds that they could not demonstrate whether or not they had handled their problems.
One-quarter of those who thought that they could handle their alcohol problems themselves were correct; in the last year they were problem free. Table 5 shows that this percentage was unaffected by their prior diagnostic status (χ2=0.52, df = 2, p = 0.77). However, if these cohort members did experience problems their diagnostic outcome was strongly related to their prior diagnosis (χ2=121.69, df = 4, p < 0.0001, γ = 0.75). These people who continued to experience alcohol problems (n = 195) were either wrong about their ability to handle their problems or not motivated to do so; only 35% reported reducing their drinking and 6% tried unsuccessfully. Even among those who became problem free (n = 65) only 49% reported reducing their drinking, which suggests that the other 51% found ways to reduce harmful consequences rather than dealing with their drinking itself. Overall only 43% of those who thought they did not need help tried to reduce their drinking.
Diagnostic outcomes in the year before interview at age 25 in those who thought they did not need help and could handle it themselves†
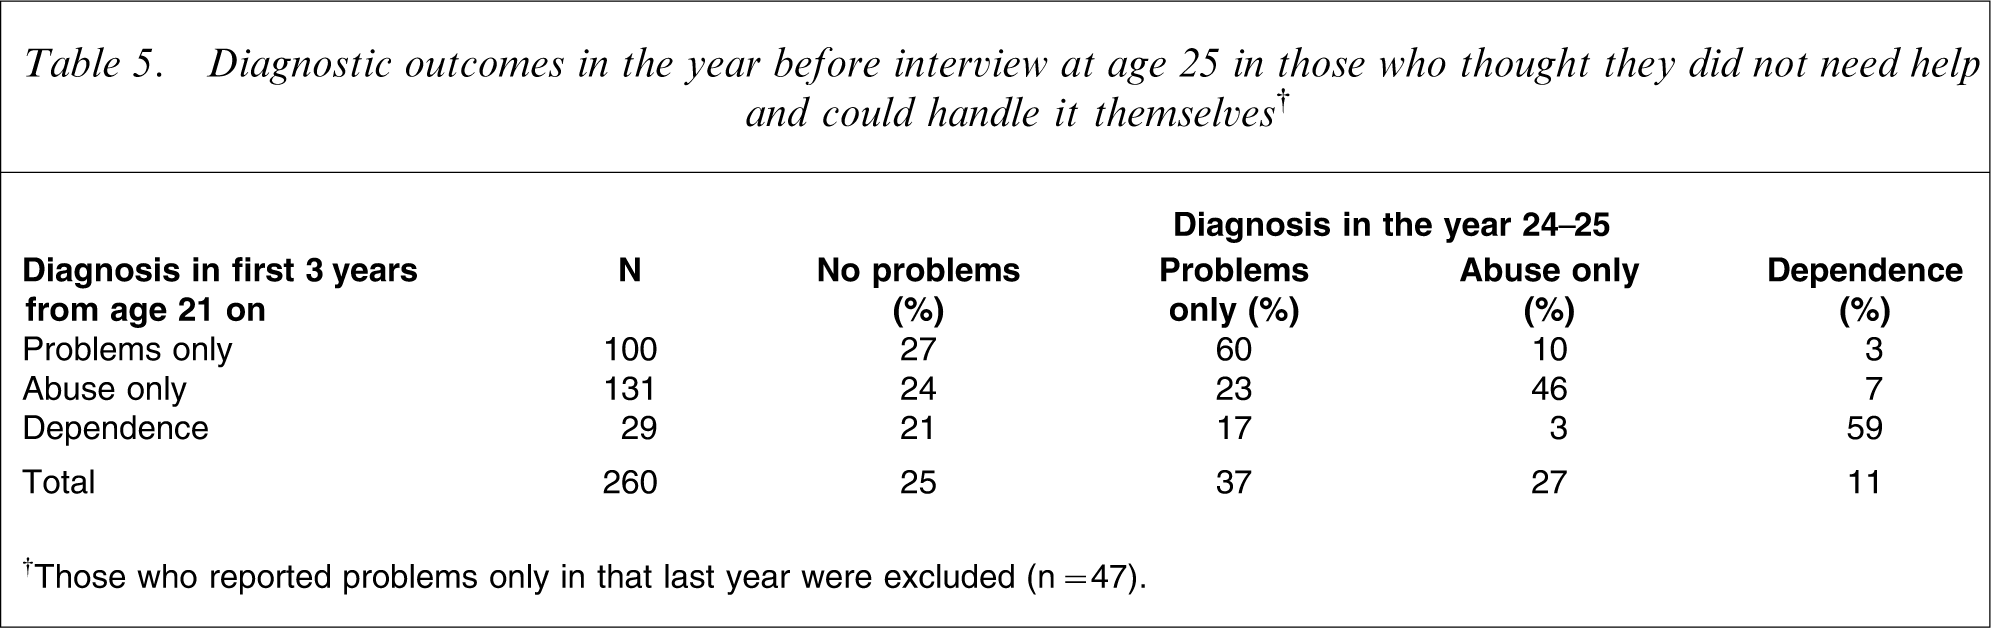
†Those who reported problems only in that last year were excluded (n = 47).
Abstinence was uncommon in the year before interview in those with problems in the previous 3 years who thought that they did not need help and could ‘handle it’ themselves (1/260). The majority drank at least weekly (61%), with 19% drinking at least monthly and 9% drinking less than monthly. Only 9% drank almost daily, exceeding the New Zealand guideline to leave a couple of days a week without alcohol (www.alac.org.nz/lowriskdrinking.aspx). Ordinal logistic regression with both sex and final-year diagnosis showed that women drank less frequently (OR = 0.6; 95%CI = 0.3–0.9) and that the more severe the diagnosis, the more frequent the drinking. Relative to the no-problem group the ORs were: problems only (3.8; 95%CI = 1.9–7.0), abuse only (5.9; 95%CI = 2.9–11.9), and dependence (9.5; 95%CI = 3.7–24.4). Odds were approximately proportional across frequency categories in this model (χ2=13.06, df = 8, p = 0.11).
The amount of alcohol consumed in the past 12 months was reported for the last drinking occasion and for the heaviest drinking occasion (‘the most you have drunk’). The New Zealand guidelines recommend no more than four standard drinks per day (40 g) for women and six for men (www.alac.org.nz/lowriskdrinking.aspx). Consumption was classified according to multiples of these guidelines.
Table 6 shows that those cohort members who thought that they could handle their problems themselves were unlikely to have kept their heaviest drinking within the guidelines: only 5% did so. More than half of the men (52%) and approximately one-quarter of the women (23%) had drunk more than four times the recommended limit on their heaviest drinking occasion (OR for sex = 3.6; 95%CI = 2.1–6.3, p < 0.0001). As there was little difference in the proportion drinking more than twice the guidelines (OR = 1.4; 95%CI = 0.7–2.6, p = 0.33) the OR for sex was not proportional across the four guideline categories (χ2=10.58, df = 2, p = 0.005). Non-proportional odds were also present in an analysis with final-year diagnosis alone (χ2=18.97, df = 6, p = 0.004) and in a model with sex and diagnosis (χ2=32.09, df = 8, p < 0.0001). The odds for extreme drinking are different from those for drinking above the guideline quantities. The more severe the final-year diagnosis, the more was drunk (χ2=34.82, df = 9, p < 0.0001).
Drinking in the year before interview at age 25 in those who thought they ‘did not need help’ and could ‘handle it’ themselves†
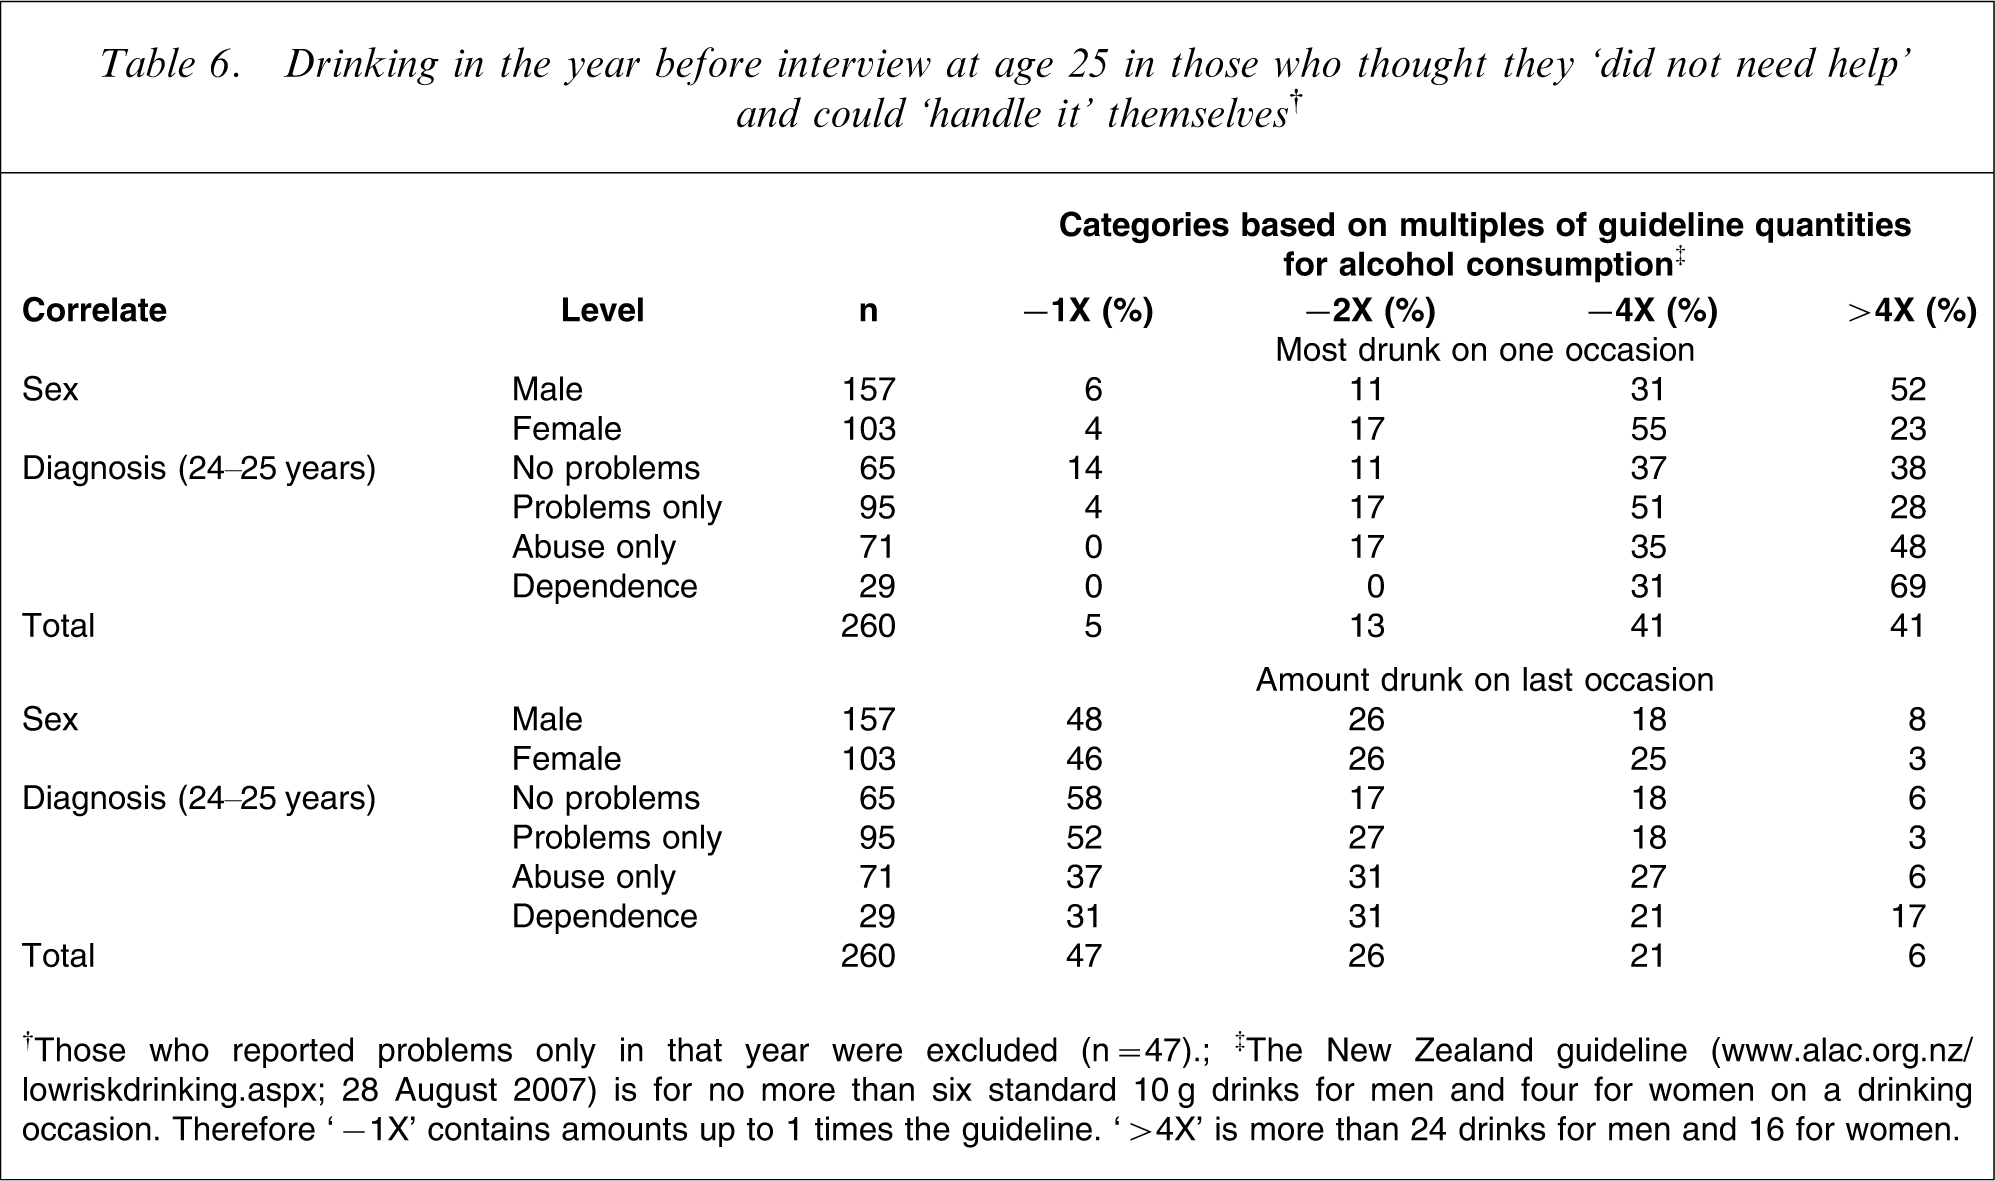
†Those who reported problems only in that year were excluded (n = 47); ‡The New Zealand guideline (www.alac.org.nz/lowriskdrinking.aspx; 28 August 2007) is for no more than six standard 10 g drinks for men and four for women on a drinking occasion. Therefore ‘− 1X’ contains amounts up to 1 times the guideline. ‘> 4X’ is more than 24 drinks for men and 16 for women.
Drinking on the last drinking occasion was more moderate, with nearly half drinking within the guidelines but one-quarter had drunk more than twice the guideline amount on that occasion. In a joint model there were no sex differences in the guideline categories for the last drinking occasion (OR = 1.1; 95%CI = 0.7–1.8) but final-year diagnosis was significant. Relative to the no-problem group the ORs were: problems only (1.1; 95%CI = 0.6–2.0), abuse only (2.0; 95%CI = 1.1–3.8), and dependence (2.9; 95%CI = 1.3–6.4) The odds were proportional across the categories (χ2=10.91, df = 8, p = 0.21)
Cohort members who did not report any problems during the whole 4 year period (21–25 years) were much more likely to drink within the guidelines: 26% were within guidelines for their heaviest drinking occasion compared with 5% in Table 6 and 68% for the last drinking occasion compared with 47% in Table 6. Nonetheless heavy drinking occasions did occur, with 21% of men and 11% of women drinking more than four times the guidelines on their heaviest drinking occasion.
Discussion
Treatment seeking was uncommon in this cohort of young adults. Even in those with a diagnosis of alcohol dependence in the period from 21 to 25 years of age, only approximately one-quarter made any treatment contact in that period. This finding is in broad agreement with results from a national community survey of New Zealander adults aged ≥16 years: only 19.4% of those with alcohol dependence reported making treatment contact for that disorder at the age at which their symptoms first developed, although eventually almost all made treatment contact if their symptoms continued (median delay of treatment seeking = 7 years) [2]. Similar results have been found in a US national survey [4].
Of those who did seek help nearly all felt that they needed treatment but only a few did not also have other people who felt that they needed treatment. This indicates the important role of family and friends in assisting people to recognize that they need help and to take action.
Reasons for not seeking help were similar across all those with alcohol problems. They thought that they did not need help because they could handle their drinking themselves, just as Hingson et al. found in Boston in the late 1970s [12]. Not surprisingly, practical and attitudinal barriers to care were irrelevant because they did not think that they needed help. The more severe the diagnosis the more likely these young adults were to think that their problems would get better by themselves and there was a trend for them to be more likely not to think of seeking help. Male subjects were approximately twice as likely as female subjects to report these two reasons. These findings may be explained by the drinking context in which these people live, with those who drink more heavily having friends who drink as they do, so that they regard their own drinking as normative. It may also reflect denial that problems resulting from drinking are an indication of a need to change drinking practices.
Those who thought that they did not need help and could handle their problems themselves were mostly unable or unmotivated to do this. Only one-quarter were problem free in the year before interview. That the percent free of problems in that year was unrelated to diagnosis was unexpected, although previous studies have indicated the extent of diagnostic change over time in this cohort [10] and in others [6–9]. Among those who were not problem free, diagnosis over the prior 3 years strongly predicted diagnosis in the past year. Around half drank within New Zealand guidelines on their last drinking occasion but very few drank within the limits on their heaviest drinking occasion in the past 12 months. Men were particularly likely to have drunk very heavily. Young adults who had had problems in the previous 3 years continued to drink heavily, at least from time to time. As would be expected, there was a strong relationship between drinking in the final year and diagnosis in that year.
The overall picture is of a cohort of young adults in whom heavy drinking is common. Consequently approximately one-third had experienced problems that contributed toward DSM-IV symptoms in the years from 21 to 25. Some problems did not recur or did not occur in the same year, so that approximately one-third of those with problems did not meet criteria for diagnosis. Only a few of those with any problems made treatment contact, with the rest thinking that they did not need help yet only one-quarter of these became problem free, and hardly any always drank within the suggested guidelines.
The New Zealand context is one in which attempts to reduce alcohol-related harm range from primary prevention (legislation, taxation and health promotion) through to treatment, but alcohol-related harm is still common [21]. Since 2005 the Alcohol Advisory Council of New Zealand has carried out a social marketing campaign (“It's not the drinking, it's how we're drinking”) aimed at reducing per occasion consumption across all ages (www.alac.org.nz/campaigns.aspx). As well as a national helpline there are regional alcohol and drug services that are mostly government funded. In 2003, the year after these data were collected, 0.8% of the New Zealand population aged 20–24 years made contact with alcohol and drug services [22]. General practitioners are the other major treatment resource available and they can work with patients themselves or refer to specialist services. Patients have to pay to attend general practitioners whereas specialist services are free. For alcohol and drug services self-referrals are accepted but there are waiting lists for outpatient services, the main form of service delivery.
The principal strengths of this study are that it is based on a large representative sample from a birth cohort and that it has been possible to look at outcomes for those who thought that they did not need help. Other strengths are that recall was limited to a 4 year period, and consumption was measured beverage by beverage, not just by generic drinks. A limitation is that only self-report is included. Also, even within 4 years, forgetting may have occurred. The extent of problems and the level of use of treatment services may be specific to this cohort. However other studies have also found that only a low proportion of those with alcohol disorders think that they need help [1, 2, 4, 5, 12–14].
Footnotes
Acknowledgements
This research was funded by a grant from the Health Research Council of New Zealand.