
Abstract
Rural/urban differences in the prevalence of mental disorders have often been reported in the last 30 years. In general, anxiety, depressive and substance use disorders are reported to be more common among urban than rural samples [1–6]. Conversely, and counterintuitively, rural communities experience higher rates of suicide than urban areas [7–10]. This may depend on professional health support for rescue intervention in suicide attempts, which tends to be more readily available in large towns, or on the lower percentage of people aged ≥65 years living in densely populated urban centres, this age group experiencing the highest suicide rate in the general population [11]. Less awareness of mental illness, patient resistance to accessing services and more stigma attached to mental disorders in rural areas might also explain higher suicide rates in rural communities [12, 13]. Higher suicide rates in rural samples, however, are far from being a universal occurrence: a population-based linkage study carried out in Denmark, for example, found that people living in more urbanized areas are at a higher risk of suicide than their counterparts in less urbanized areas [14]. It should be acknowledged that ‘rural’ and ‘urban’ mean different things according to the country of interest, with very large but low-density populated countries such as Canada and Australia facing problems, such as difficult access to health-related facilities and poor service coverage, which are less relevant in other, more densely populated countries facing, instead, problems related to unemployment and financial difficulties across the rural/urban gradient.
Very early studies emphasized ‘romantic’ explanations for the observation of rural/urban differences in the prevalence of mental disorders, distinguishing between an urban environment characterized by interpersonal estrangement, anonymity and social dislocation, and a rural setting benefited by social stability, integration and supportive interpersonal network [15]. More recent studies, based on a better-developed methodology of investigation, focused on the socioeconomic structure of the population. These studies confirmed the findings of the past, but also noted a major contributing role for sex, age, marital status, and life events [16–18].
Rural/urban differences were noticed in the prevalence of eating disorders, too. A PubMed/Medline search (‘urban rural and eating disorders’) retrieved a handful of references, sometimes unrelated to the topic. A direct inspection of the retrieved articles gave some other references. Finally, the investigation of the listed entries in a non-academic commercial search engine (Google) resulted in additional published papers relevant to the topic. Early studies focused on prevalence data: a greater prevalence of anorexia nervosa in the urban setting compared to the rural one was found in Japan and in Malaysia [19, 20]. An Italian study, instead, found no difference in the prevalence of anorexia nervosa and subclinical eating disorders in a rural area, compared to past studies done in the urban setting [21]. No difference from studies published in Western countries was found, either, in the prevalence of bulimia nervosa in a rural town (Sivas City) of Turkey using the Structured Clinical Interview for DSM-IV axis I Disorders among 951 undergraduates [22].
More recent studies investigated incidence rates: the incidence of bulimia nervosa was found to be higher in urban than in rural settings, with differences still evident even when controlled for covariates such as sex and age [23, 24]. The incidence of detected cases of anorexia nervosa, instead, was found not to vary according to the rural/urban classification in a Dutch study [23], a result confirmed at a follow up a decade later [25]. In contrast, higher incidence rates in the urban than in the rural sample were found for anorexia nervosa in an Italian study [24].
Rural/urban differences were also noticed at the symptom level, with urban girls showing greater body dissatisfaction, and more frequently resorting to diet pills or intentionally vomiting, than their rural counterparts in a study carried out in Egypt (n = 340, 11–19 years old) [26]. Greater resorting to restrictive eating and weight control was also found among urban than in rural girls in a Polish study (n = 2774, 11–15 years old) [27]. Conversely, no differences in chronic dieting, an oft-reported antecedent of eating disorders, were found among urban, suburban and rural youths in a large sample including 36 320 Minnesota public school, mixed race students of both genders (USA, 11–19 years old) [28]. Indeed, more often the data obtained with screening questionnaires are conflicting with those drawn from categorical diagnoses. Many studies used the Eating Attitudes Test (EAT)-40, a self-report questionnaire that screens effectively for individuals who do have eating disorders [29, 30]. Higher scores on the EAT-40 were found in the rural compared to the urban samples among adolescents in Appalachia (USA, most Caucasian white, n = 1302, 11–18 years old) [31], and among adolescents in the Virgen de Rocio health district in Seville (Spain, n = 789, 12–15 years old) [32]. The shorter version of the questionnaire (EAT-26) confirmed the higher risk for subjects coming from rural compared to urban settlements in a study involving 249 Indian university students of both genders (but not in the sample of 297 Australian students) [33]. In contrast, another study found a lower risk in a Zulu-speaking rural population of adolescents (South Africa, n = 361, 15–20 years old) [34], compared to published data from an urban sample [35]. No differences from results published on adolescent urban samples were found in a study involving 2589 students attending the four high schools within the rural community in British Columbia, Canada [36].
Some caution was raised against the use of screening questionnaires to detect eating disorders, likely to produce inflated pictures of prevalence [37], and for which the cross-cultural reliability still has to be proved, particularly in countries with cultures very different from those in which they were developed [38]. Nevertheless, the investigation at the symptom level could be more effective than the category-based diagnoses in identifying differences by groups. Indeed, it has been advocated that the use of continuous variables (quasi-normally distributed) instead of categorical variables would facilitate the comparison, also allowing a better analysis of the influence of covariate and interaction effects [15]. However, few studies had investigated rural/urban differences in the distribution of eating disorder symptoms among adolescents with detailed instruments aimed at detecting the occurrence of single symptoms; most studies used a single questionnaire, nor were mediation and moderation effects tested in the links between eating disorder symptoms and place of residence.
The aim of the present study was to evaluate rural/urban differences in the distribution of eating disorder symptoms among two adolescent samples in the south of Sardinia, a major island of Italy in the Mediterranean Sea, taking into account sex, age, and parental socioeconomic status of respondents in the links between psychopathology and place of residence.
Methods
The study was conducted in the winter and spring of 2004, on two samples drawn from the schools of an urban district (Cagliari) and a rural one (Carbonia). Cagliari is a high-density (1851 inhabitants km−2) metropolitan town surrounded by a network of suburbs and small towns, with 231 283 inhabitants at the time of the study (spring 2004). Carbonia is a low-density (208 inhabitants km–2) rural town, with 30 505 inhabitants in 2004. The town of Carbonia was classified as rural because it has a population that is lower than the 50 000 inhabitants indicated for inclusion in the ‘intermediate area’ according to the Eurostat classification of the degree of urbanization (between ‘densely populated area’ and ‘thinly populated area’), nor is it situated next to a highly populated area (‘suburban area’) [39]. The schools included in the study were stratified among all those operating in the territory, in order to achieve a representative sample of young people in terms of social and cultural backgrounds. Globally, the samples under investigation corresponded to 8–30% of the total young population of the same age in the district (Cagliari and Carbonia, respectively). A random selection was applied to the schools operating in Cagliari to made the sample compatible with the one from Carbonia (when all high schools, except for an evening school for adults and a professional school for mechanics/car body repairers, were included).
The surveyed schools involved a grammar high school, a science high school, a technical and commercial school and a vocational school (hotel management). The first study (Cagliari) saw the participation of 817 out of the 1000 initially selected students of both genders, attending the three upper classes of the course (age 15–19 years, mean age = 17.4 years, SD = 1.4). The second study (Carbonia) saw the participation of 507 out of the 600 initially selected students of both genders, attending the three upper classes of the course (age 15–19 years, mean age = 17.4, SD = 1.2). A fraction of the students (17.2% in Cagliari; 11.3% in Carbonia) did not agree to participate in the study, and/or were absent from school during the study.
Procedure
Informed consent was obtained from the headmasters of all schools and from the parents of the students who took part in the study. Students were approached as a group in their classrooms, and were individually asked to participate in the study. They were informed that the questionnaire was not an examination, that there were no right or wrong answers, that they did not have to take part in it if they did not want to, and that they could withdraw from the survey any time. Each student received a card, listing a variety of contacts that they could use whenever they felt that they had the problems described in the questionnaires. Confidentiality was guaranteed on the answers given to the questionnaire, and informed consent was obtained from each student. The study was carried out on an anonymous form, and, in compliance with the law on privacy and confidentiality recently approved in Italy, we were unable to write down any further information when the subject refused to participate in the survey: informed consent was necessary to enter these data in the research.
Both studies were approved by the ethical board on clinical investigation of the Psychology Department of the University of Cagliari. This ethical board evaluates all planned studies involving human subjects with respect to their usefulness, to their causing no harm whatsoever to the participants, and to their offering evidence that the study does not expose the involved subjects to negative stigma or to any prejudice.
Measures
The body mass index [BMI = weight (kg) divided by height (m) squared] was derived from self-reported data on weight and height. The use of self-reported measures was questioned in the way of calculating BMI; however, research has shown that self-reported height and weight are highly correlated with actual height and weight [40, 41], and, particularly, it has found no correlation between the accuracy of self-reported weight and the presence of eating disorder symptoms [42]. General sociodemographic information was also derived from self-reported data on age, sex and socioeconomic position because we were not allowed to access the official records. As a measure of socioeconomic position we used the highest attained level of parental education [43], which was further classified into three categories: lower than high school diploma, high school diploma, college graduate or higher. In mediation analyses, however, we used the continuous data, from 0 (both parents with less than a compulsory school-leaving certificate, n = 3, 0.2% of total sample) to 10 (both parents with a master or a PhD, n = 10, 0.9% of total sample). The sociodemographic section was followed by the group of self-reported inventories, chosen to explore abnormal eating patterns and their related psychological symptoms, including: EAT [44], Bulimic Investigatory Test of Edinburgh (BITE) [45], Body Attitudes Test (BAT) [46], and the revised Hopkins Symptom checklist (SCL-90-R) [47], which was chosen as a measure of psychological distress. Suicidal ideation was measured on the item 15 of the SCL-90-R (concerning suicide thoughts). To qualify as a case of suicide ideation, subjects had to score 3–4 (quite a lot; extremely often) on the item. Previous studies carried out in clinical samples of people diagnosed with an eating disorder had shown that this measure of suicidal ideation derived from the SCL-90-R item was significantly related to suicide attempt [48]. All questionnaires were checked through back-translation to assure comparability with the original. More details on these instruments and on their psychometric properties in the Italian population have been reported elsewhere [49, 50].
Statistical analysis
All data were coded and analysed using SPSS (SPSS Inc., Chicago, IL, USA). Scale reliability was measured by Cronbach's coefficient alpha, a measure of internal consistency [51]. The suggested intervals for adolescents are: excellent, >0.90; good, 0.90–0.80; moderate, 0.70–0.50; unacceptable, <0.50 [52]. All tests were two-tailed (α = 0.05). The effect size on continuous measures was estimated through Cohen's d [53]; the effect size on categorical measures was estimated via odds ratio (OR) with 95% confidence interval (95%CI). Power calculation of the detected differences was done according to Dupont and Plummer [54], using their PS software [55]. In PS, the power at which a specific alternative hypothesis can be detected is calculated on the basis of the sample size.
To investigate the intervening effect of a mediator variable (socioeconomic position, i.e. highest level of parental education), to the extent that it accounts for the relation between the predictor (place of residence) and the criterion (eating disorder symptoms), we used a mediational path model according to Baron and Kenny, and subsequent modifications [56, 57]. In this approach the relationship between an independent variable and a dependent variable is decomposed into direct and indirect (mediated) effects. Mediation implies a causal hypothesis whereby an independent variable causes a mediator, which in turn causes a dependent variable: when the effects of the candidate mediator are controlled, a previously significant relationship between the predictor and the outcome of interest is significantly reduced or abolished. In a moderated mediation, the strength of the indirect effect (i.e. the one caused through the mediator) depends on the level of a third factor (moderator) acting on the chain of causation. To test our mediation hypotheses, we used the bootstrapped sampling distribution models developed by Preacher and Hayes [58], and worked with the relevant SPSS-compatible software programs (www.quantpsy.org/). Bootstrapping is a non-parametric approach to effect-size estimation and hypothesis testing that makes no assumptions about the shape of the distribution of the variables, or of the sampling distribution of the statistics [59]. Bootstrapping is accomplished by taking a large number of n-sized samples (where n is the original sample size) from the data, sampling with replacement, and computing the indirect effect, according to the specified hypothesis, in each sample [58, 59]. We used Preacher's MODMEDC SPSS-compatible software program to test mediation and moderation hypotheses [61].
Results
General results
In the Cagliari sample we distributed 828 questionnaires, 820 of which were returned filled out in a computable manner with an attrition rate below 1%, although some information was missing in a number of questionnaires. The urban final sample included 535 female (65.5%) and 282 male (34.5%) subjects. In the Carbonia sample, we handed out 532 questionnaires, 507 of which were returned filled out in a computable manner, although some information was missing in some questionnaires. The rural final sample included 296 female (58.4%) and 211 male (41.6%) subjects.
The urban sample (Cagliari) included a slightly greater proportion of female students (χ2=6.75, df = 1, p = 0.011), but there were no differences by age: Cagliari, 15–16 years, n = 183 (22.4%), 17–18 years, n = 483 (59.1%), ≥19 years, n = 151 (18.5%); Carbonia, 15–16 years, n = 134 (26.4%), 17–18 years, n = 291 (57.4%), ≥19 years, n = 82 (17.6%). In the urban sample there was a greater fraction of subjects whose parents had a college graduate or higher level of education: Cagliari, lower than high school diploma n = 275 (33.9%), high school diploma n = 301 (37.1%), college graduate or higher n = 236 (29.1%); Carbonia, lower than high school diploma n = 229 (45.4%), high school diploma n = 210 (41.7%), college graduate or higher n = 65 (12.9%). The difference was statistically significant (χ2=48.10, df = 2, p = 0.0001). In both samples no differences were found by sex among peers of same age or same parental education.
Eating disorder symptoms
The internal consistency of questionnaires aimed at measuring eating disorder symptoms, as measured by Cronbach's alpha, was good enough in the urban (Cagliari) sample (female: EAT = 0.797, BITE = 0.833, BAT = 0.911; male: EAT = 0.634, BITE = 0.725, BAT = 0.790), whereas in the rural (Carbonia) sample, Cronbach's alpha was good among female students (EAT = 0.706, BITE = 0.700, BAT = 0.873), but moderate among male students (EAT = 0.574, BITE = 0.619, BAT = 0.798).
In the Cagliari sample female respondents scored significantly higher than male respondents on the EAT (Cohen's d = 0.30), BITE (Cohen's d = 0.18), and BAT (Cohen's d = 0.78), Student's t-test, after Levene correction (df = 815): p < 0.0001 in all comparisons (Table 1).
Questionnaires measuring eating disorder symptoms by gender and place of residence (mean±SD)
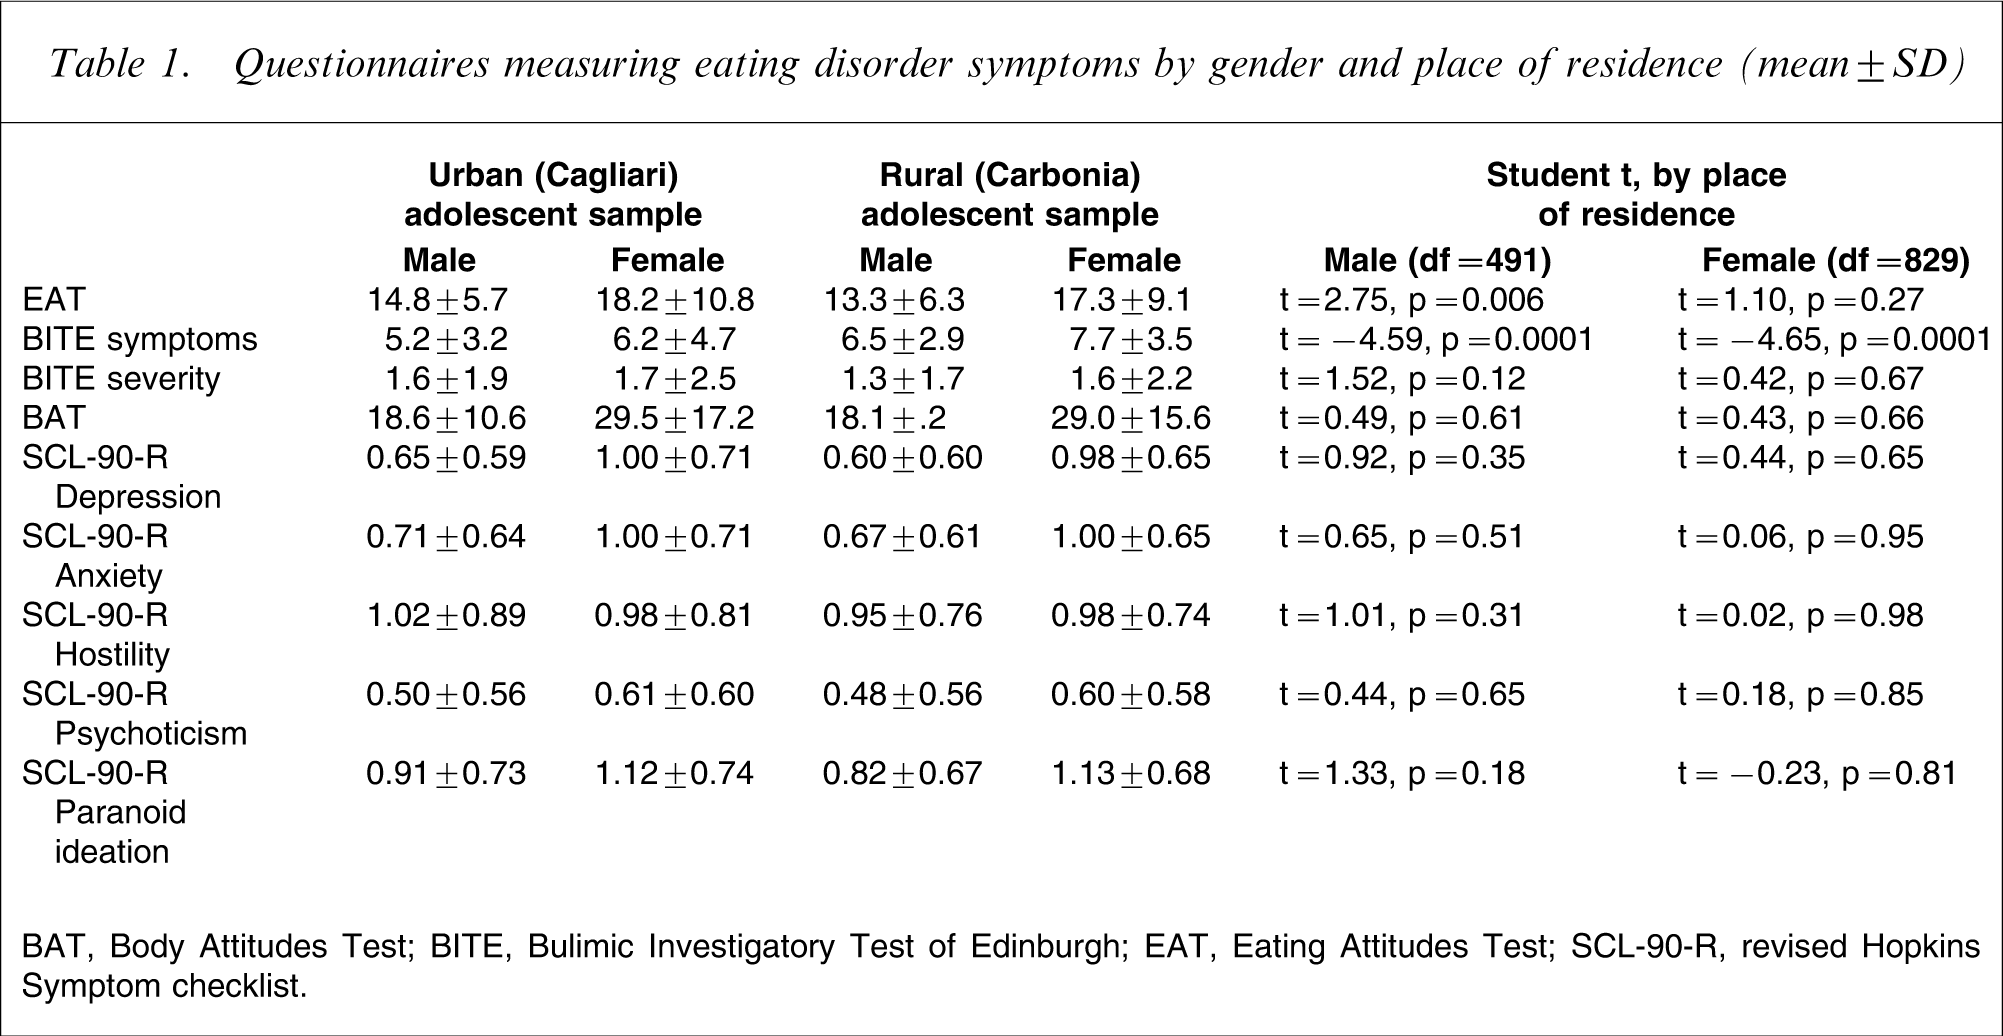
BAT, Body Attitudes Test; BITE, Bulimic Investigatory Test of Edinburgh; EAT, Eating Attitudes Test; SCL-90-R, revised Hopkins Symptom checklist.
In the Carbonia sample, too, female students scored significantly higher than male students on the EAT (Cohen's d = 0.51), BITE (Cohen's d = 0.37), and BAT (Cohen's d = 0.81), Student's t-test, after Levene correction (df = 505): p < 0.0001 in all comparisons. In both samples female students also scored higher than male students on all the SCL-90-R subscales, with the exception of the hostility subscale (p < 0.0001 in all other comparisons).
In both genders we found no links between age, or our indicator of socioeconomic position (highest level of parental education), and the scores on EAT, BITE, or BAT. The scores on the EAT, the BITE symptoms and the BAT were correlated with each other but there was no overlap between the three measures, aimed at investigating distinct though interrelated profiles of symptoms (Pearson's r = 0.50–0.61 in the urban sample, 0.44–0.52 in the rural one, p < 0.0001 in all correlations).
In the urban sample 10 girls (1.8%) and no boy had EAT scores higher than the suggested cut-off of 30 in the presence of a BMI <18, a profile indicative of anorexia nervosa. Conversely, 11 girls (2.0%) and one boy (0.3%) scored on the BITE Symptoms subscale higher than the suggested cut-off of 20 in the presence of a score >5 on the Severity subscale, a profile indicative of bulimia nervosa. The corresponding pictures in the rural sample were: three girls (1.0%) and no boy with a psychometric anorexia nervosa case; two girls (0.6%) and no boy with a psychometric bulimia nervosa case.
Rural/urban comparison
In both male and female participants the scores on the EAT were higher in the urban than in the rural sample; the difference, however, reached a statistically significant level only among male respondents (t = 2.75, df = 491, p = 0.006, Cohen's d = 0.25). Conversely, in both male (t = − 4.59, df = 491, p = 0.0001, Cohen's d = 0.42) and female respondents (t = − 4.65, df = 829, p = 0.0001, Cohen's d = 0.36), the rural sample reported higher scores on the BITE symptoms subscale. No differences by place of residence were found as far as the BAT scores were concerned. Among female students we had a statistical power of 76% to find a difference on the EAT at α = 0.05, and a statistical power of 100% to find a difference on the BITE. The equivalent statistical power among male students was, respectively, 100% and 100%. The power to detect a difference at α = 0.05 by place of residence was around 10% on the BAT in both male and female respondents. On the basis of the present results, to raise the statistical power to approximately 80% we should have investigated a sample approximately 15-fold larger than the present one so as to detect a difference by place of residence on the BAT.
When the comparison was confined to the fraction of those who scored higher than the suggested cut-off on the questionnaires aimed at measuring the presence of eating disorder symptoms, those in the urban sample outnumbered those in the rural sample, but the difference reached a statistically significant level only for the cases identified on the BITE symptoms subscale (cut-off = 20; Table 2).
Prevalence of psychometric cases on questionnaires aimed at measuring eating disorder symptoms, by place of residence
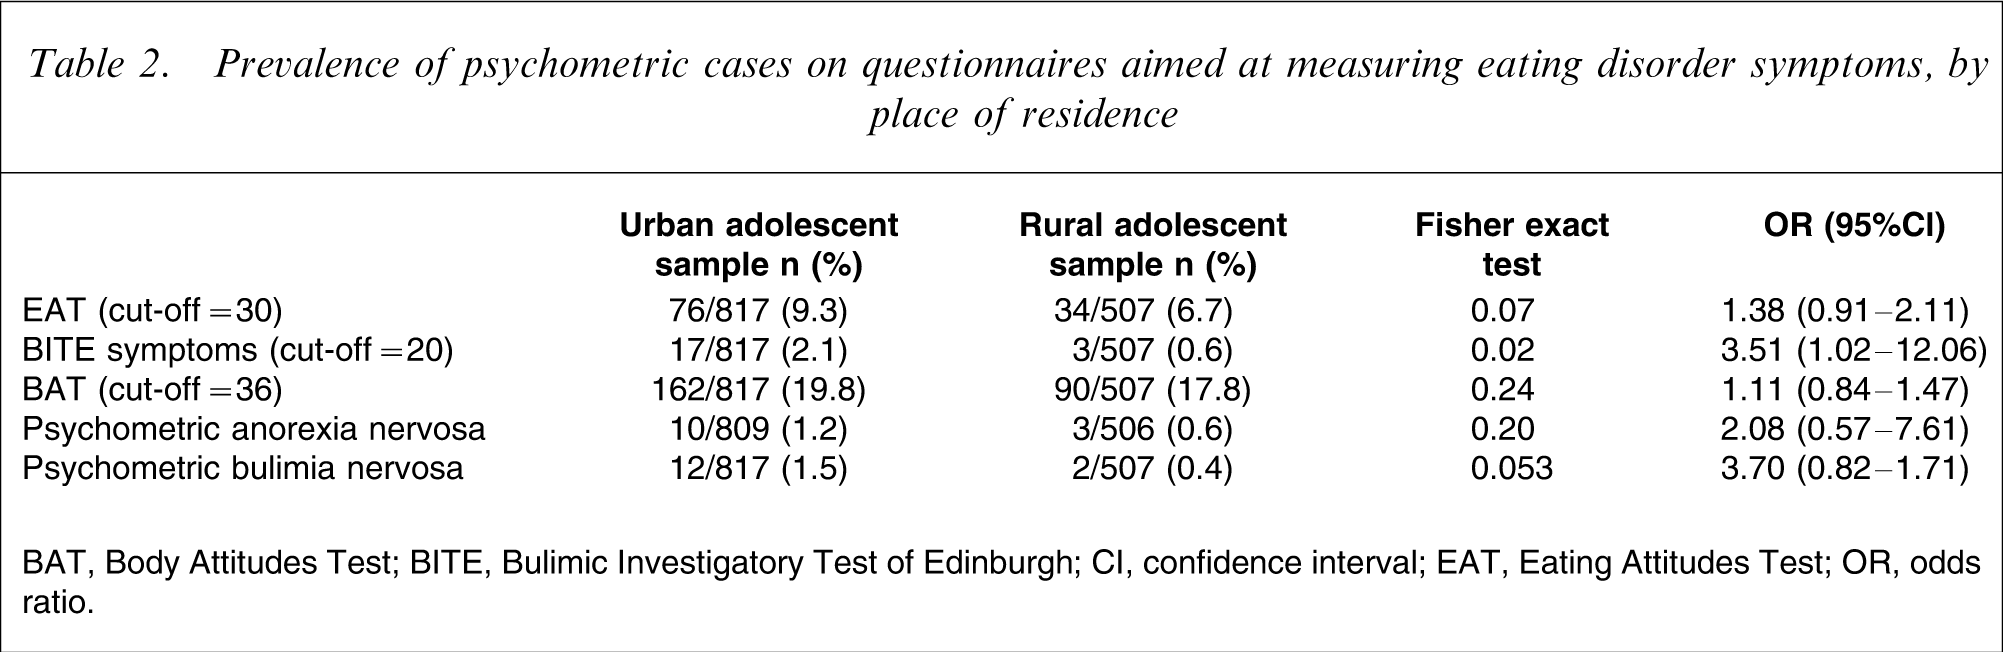
BAT, Body Attitudes Test; BITE, Bulimic Investigatory Test of Edinburgh; CI, confidence interval; EAT, Eating Attitudes Test; OR, odds ratio.
The statistical power to find a difference by place of residence at α = 0.05 was 77% in EAT cases, 95% in BITE cases, 30% in BAT cases, 41% in psychometric anorexia nervosa cases, and 89% in psychometric bulimia nervosa cases.
No other differences were found by place of residence. In particular, in the urban sample, 14 male students (4.9%) and 27 female students (5.0%) reported high intensity suicide ideation, as against seven male (3.1%) and 15 female students (4.8%) in the rural sample. The difference by place of residence was not statistically significant in both male (Fisher exact test p = 0.22, OR = 1.58, 95%CI = 0.62–3.98) and female students (Fisher exact test p = 0.52, OR = 1.03, 95%CI = 0.54–1.97).
To further explore the role of sex, age and socioeconomic status in explaining the differences by place of residence in eating disorder symptoms on the EAT and the BITE, we carried out a series of multiple regressions, using a dummy code for sex (female = 1, male = 0) and place of residence (urban = 1, rural = 0), and continuous values for age and the highest attained level of parental education (our proxy for the socioeconomic status of participants). We found that sex greatly contributed to explain the links between place of residence and eating disorder symptoms on both the EAT and the BITE, with parental education marginally contributing as far as the EAT scores were considered. Nevertheless, the impact of place of residence still remained statistically significant even when taking into account sex, age and parental education, with the urban sample reporting higher scores on the EAT and lower scores on the BITE (Table 3).
Multiple regression model between place of residence and measures of eating disorder
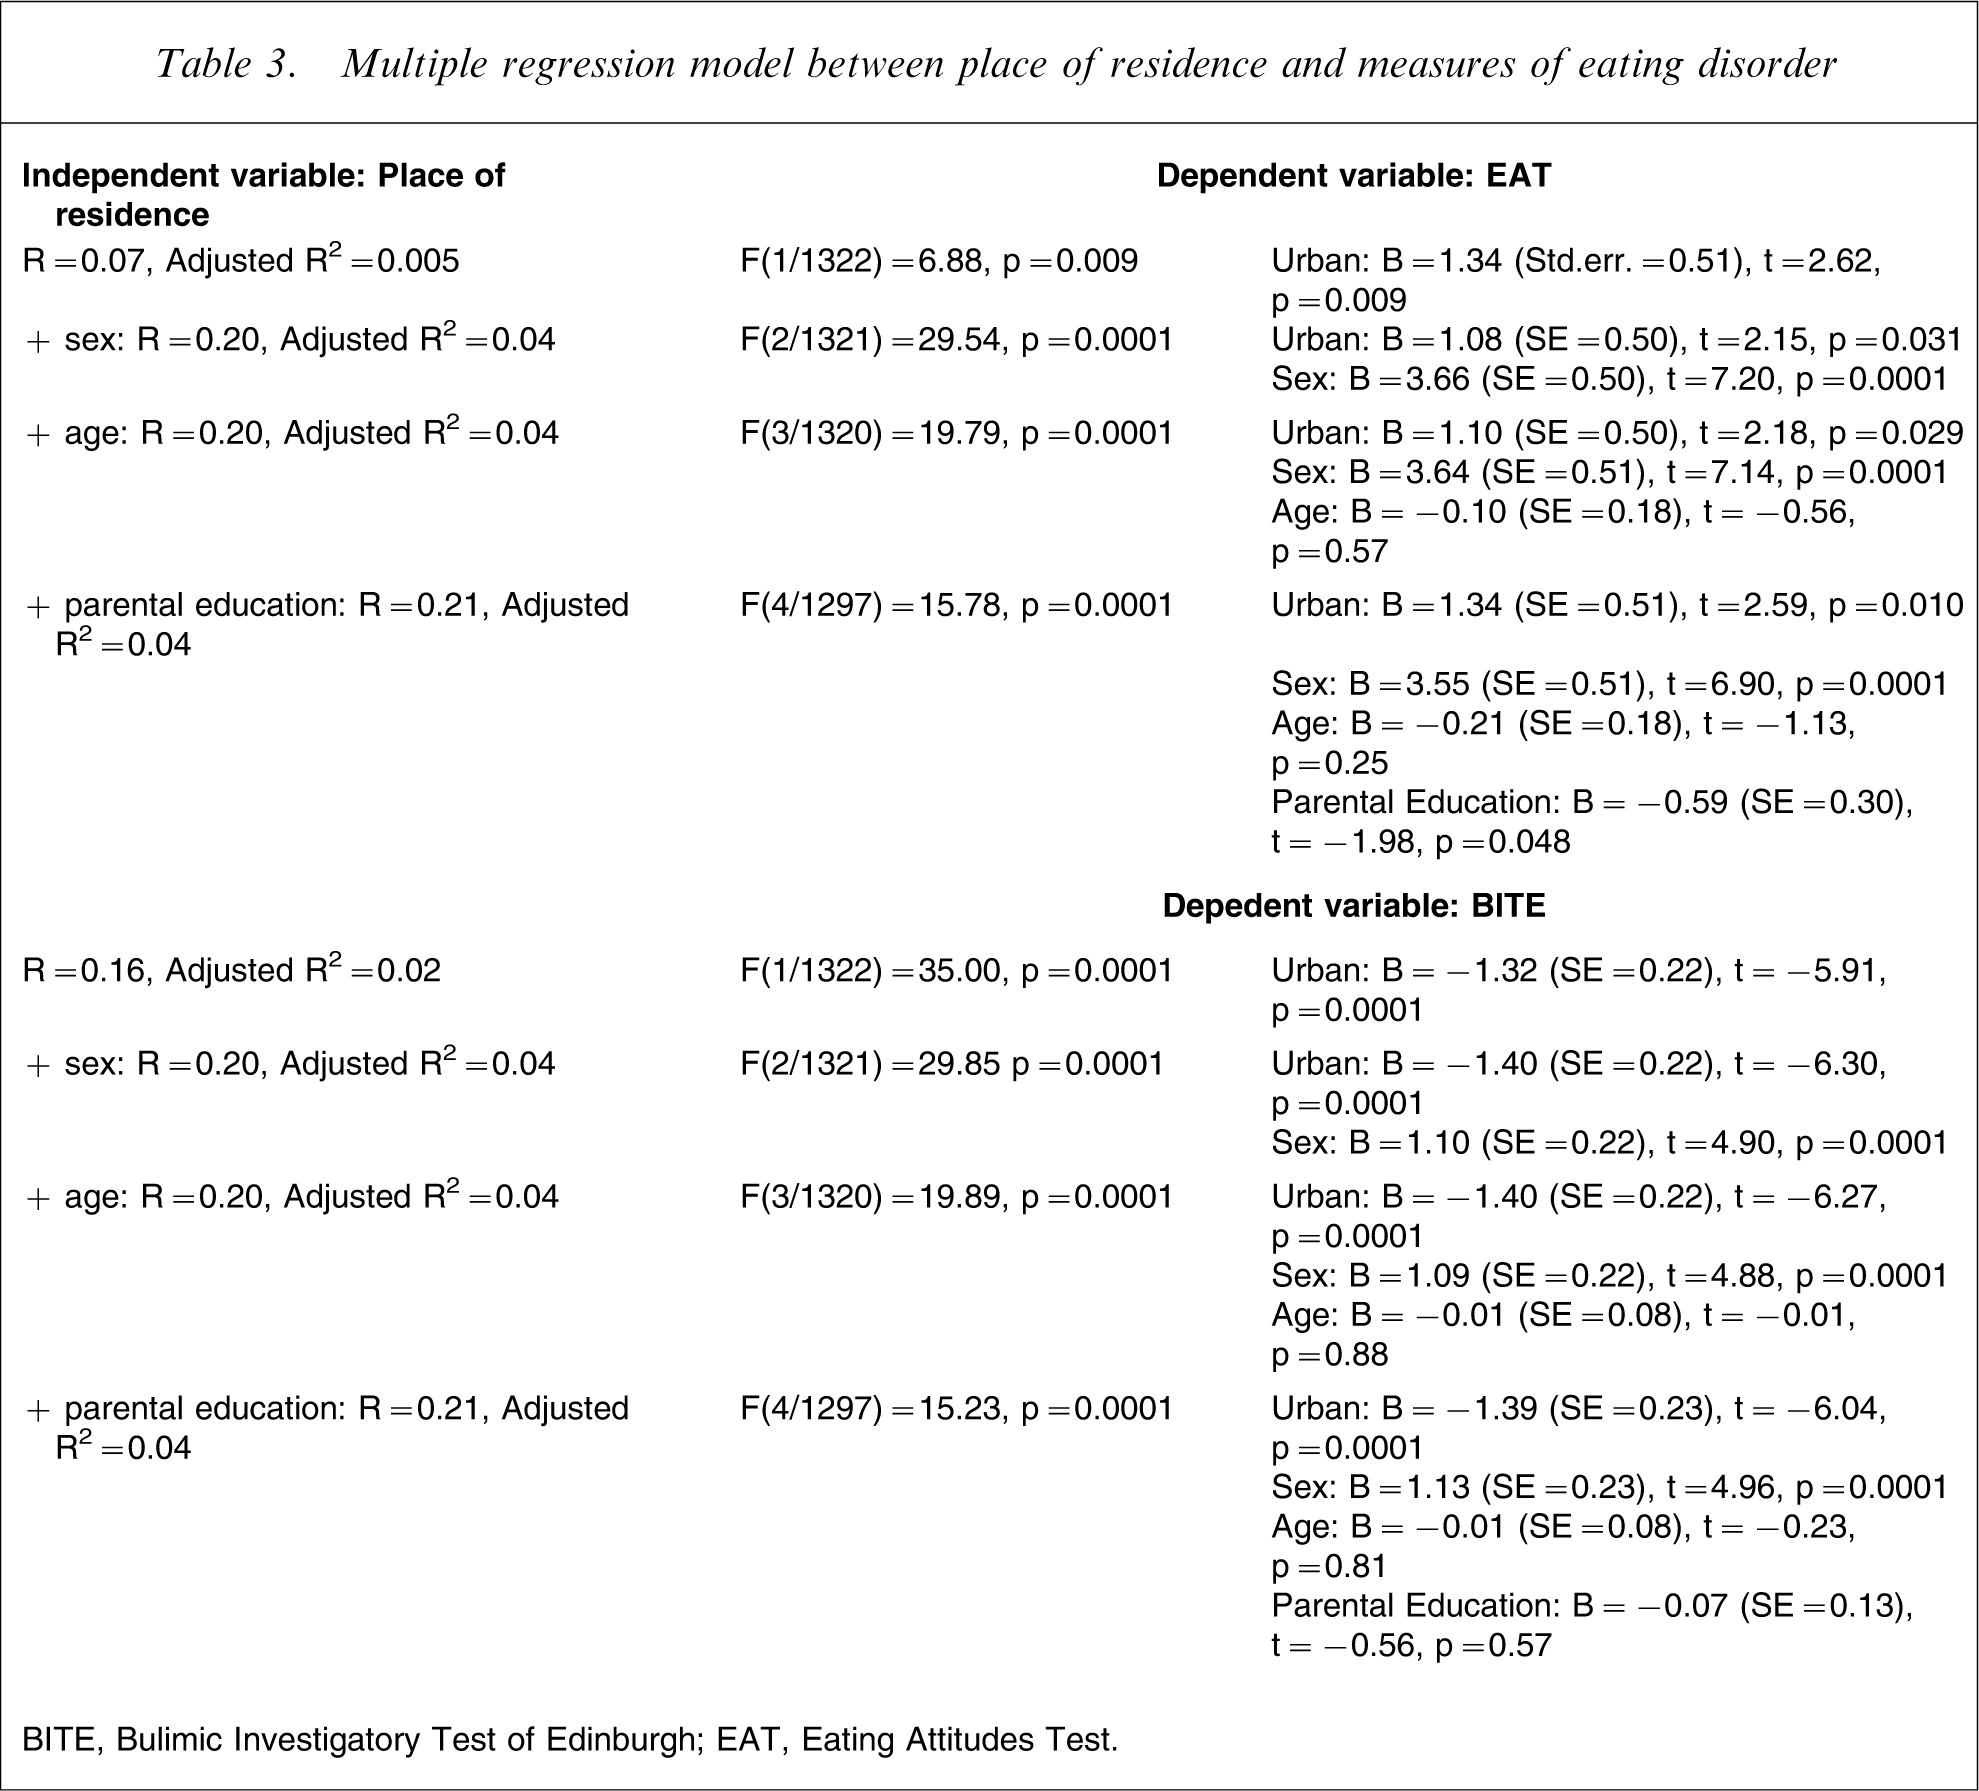
BITE, Bulimic Investigatory Test of Edinburgh; EAT, Eating Attitudes Test.
Mediation model
We surmised that parental education level (our proxy for socioeconomic status of participants), would serve as a mediator between place of residence and the distribution of eating disorder symptoms in the sample. The urban sample had a greater fraction of subjects whose parents had a college graduate or higher level of education, and parental education can be conceived as an indicator of the cultural attitudes displayed by the parents towards health issues, attitudes likely to influence their sons’ and daughters’ behaviour. We also tested the hypothesis that sex was a moderator in the interactions between place of residence (urban setting = 1, rural setting = 0) and the distribution of eating disorder symptoms, because female respondents scored higher on all questionnaires aimed at measuring these symptoms. Age was entered as a covariate because we used self-reported data, and younger people might not be completely acquainted with parental education levels.
We found that parental education level was higher among urban subjects, and inversely correlated with age. The urban sample reported higher scores on the EAT, and lower scores on the BITE, with sex influencing the difference for EAT but not for BITE (Table 4). The level of parental education had no influence on the relationship between place of residence and the scores on the EAT or the BITE, even taking into account sex and age. Finally, sex was not a moderator in the relationship between place of residence and the reporting of eating disorder symptoms.
Moderated mediation analysis of links between place of residence and eating disorder symptoms
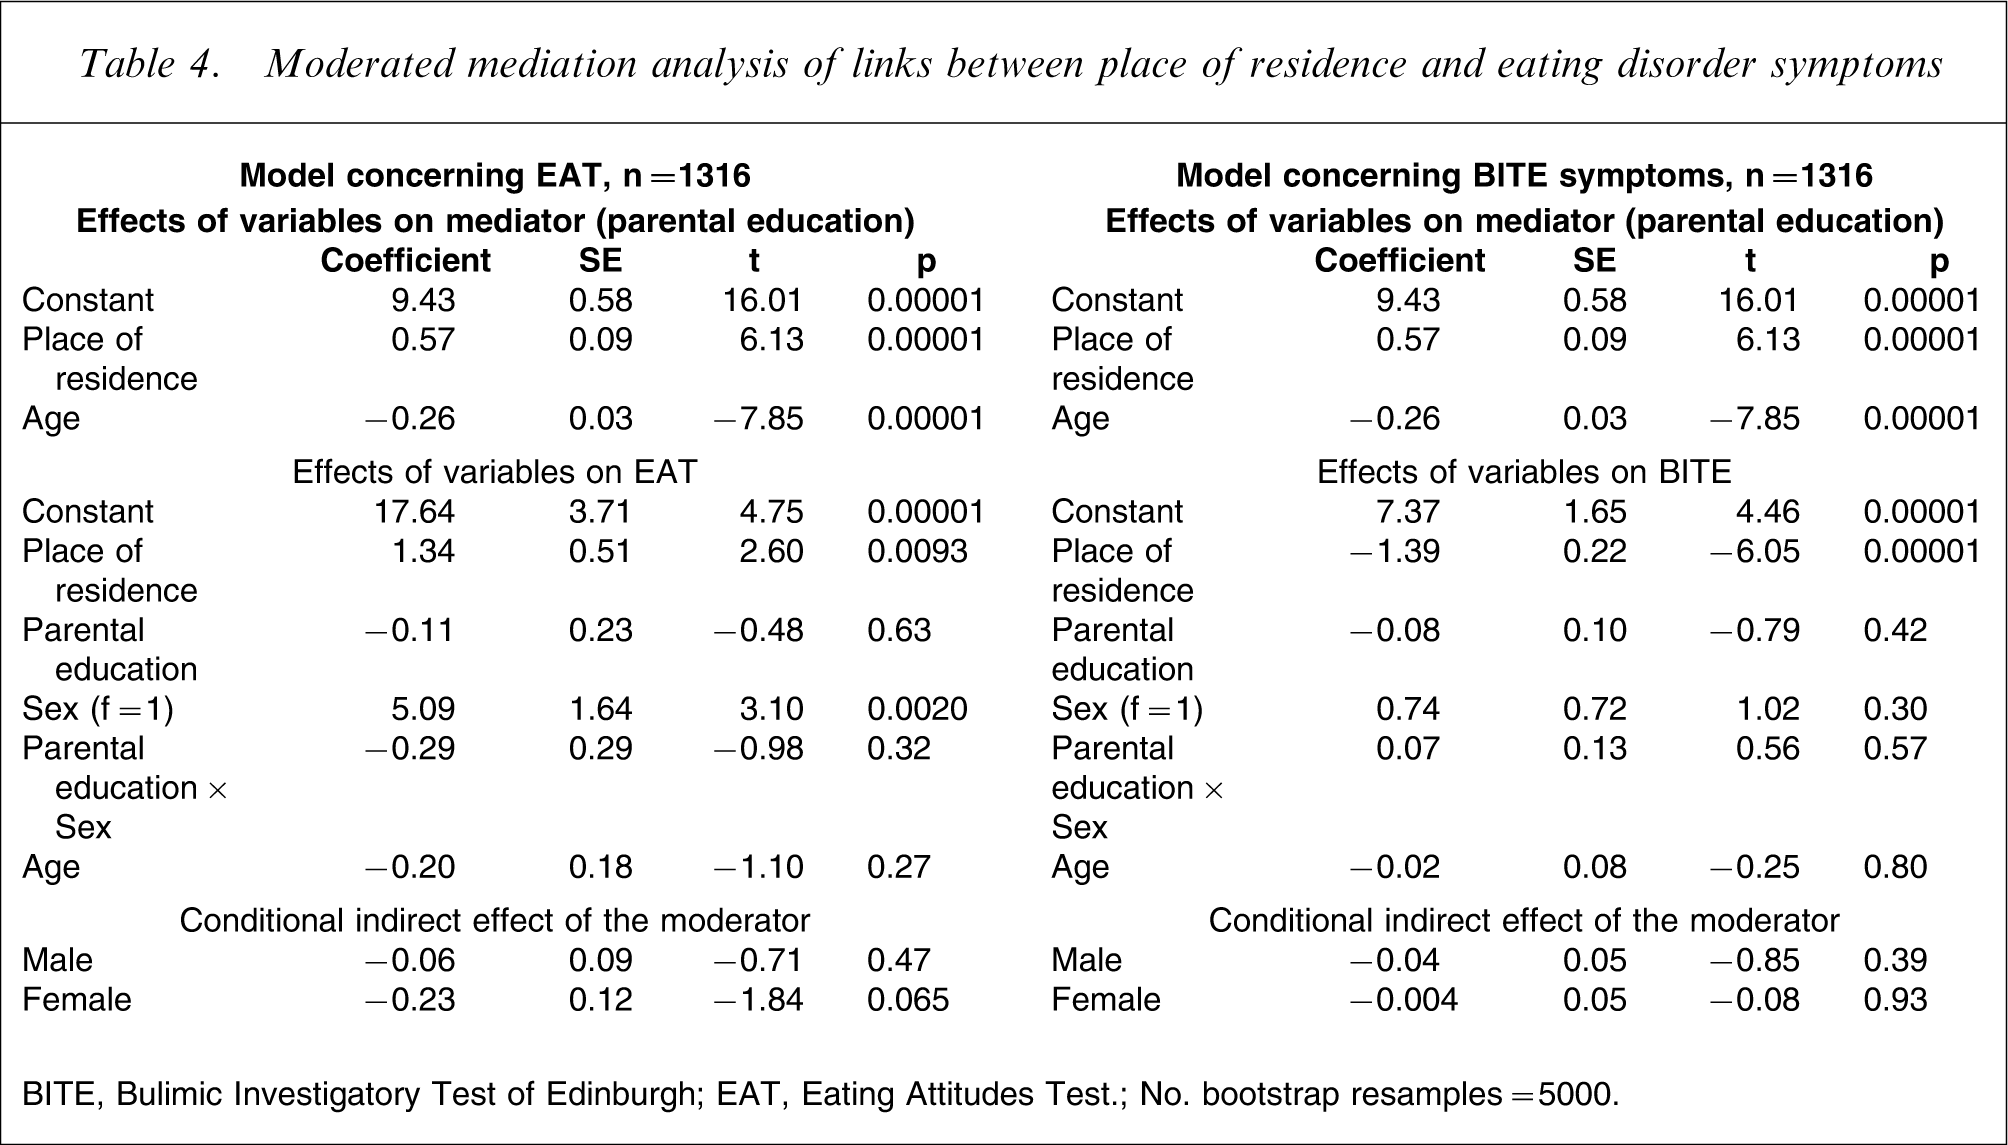
BITE, Bulimic Investigatory Test of Edinburgh; EAT, Eating Attitudes Test.; No. bootstrap resamples = 5000.
Discussion
We found rural/urban differences in the distribution of eating disorder syndromes on the basis of validated self-reporting questionnaires: by using categorical data, that is, those scoring higher than the suggested cut-off for the identification of clinically relevant cases of eating disorder, we found more cases in an urban adolescent sample than in a rural one. The differences were evident for the spectrum of bulimia nervosa symptoms, but when the analysis was confined to the dimensional symptom level the differences were reversed, with the rural sample reporting statistically higher scores than the urban one.
The results of the present cross-sectional, within-study analysis of the differences in the distribution of eating disorder symptoms by place of residence were clearly affected by the level of analysis. Apparently, urban adolescents are more likely to enter the area of psychopathology than rural ones. Such a finding, however, is confined to the eating disorder spectrum of psychopathology because no other differences were found by place of residence in the distribution of psychological distress, as measured by SCL-90-R. In particular, no differences were found as far as level of depression, anxiety or high-intensity suicide ideation were concerned: a finding consistent with a recent ESEMeD survey in which no differences by place of residence in the prevalence of non-psychotic mental disorders were found among young Italian subjects [18].
Rural/urban differences in the distribution of eating disorder cases diagnosed with bulimia nervosa had already been reported, both in Holland and in the North-East of Italy, with urban samples having a higher prevalence than rural or suburban ones and, in Italy, Japan and Malaysia also with a greater prevalence of anorexia nervosa cases [19, 20, 23, 24]. We, too, found a greater prevalence of eating disorder cases in both the anorexia and bulimia nervosa spectrum in the present urban sample, although the difference did not reach a statistically significant level: this is a likely reflection of the low base prevalence rate of these disorders, confined in a restricted fraction between 0.5 and 2% of the adolescent population at risk. However, we found that male subjects, more than female subjects, showed differences by place of residence in the distribution of eating disorder symptoms, in both the anorexia and the bulimia spectrum of symptoms, a finding that is at odds with past studies confined to the EAT [31,32, but see 33]. As a whole, male subjects tend to be under-considered in the investigation of eating disorders epidemiology, despite being at a rising risk, although still lower than the risk found among female subjects [61, 62].
In past investigations on the prevalence of mental disorders by place of residence, socioeconomic status was found to be an important mediator of the observed differences [15, 18]. In the present investigation socioeconomic status, as measured by level of parental education, did not mediate in the relationship between place of residence and the reporting of eating disorder symptoms, despite the urban sample having a greater fraction of subjects whose parents had a college graduate or higher level of education. Our measure of socioeconomic status, the parental level of education, is considered as a reliable indicator of socioeconomic level in the family of an adolescent [43], being a reflection of both economic resources and of the cultural attitude displayed by the parents towards health issues, with people with higher levels of education generally paying greater attention to their own and their relatives’ health status [63, 64]. Conversely, rural students were found to give less weight than urban students to health considerations [65]. Past studies indicated a link between high socioeconomic status and the risk of eating disorders, particularly in the anorexia nervosa spectrum [66, 67]. More recent studies, in contrast, questioned such an assumption, reporting no relationship between socioeconomic status and even an inverse correlation, particularly for the bulimia nervosa spectrum [66, 68]. Past investigations carried out with the same protocol used in the present study found no relationship between socioeconomic status and the reporting of eating disorder symptoms among adolescents [49, 50]. It should be stressed that we had access only to self-reported data on parental education level, and this represents a limitation of the present study: younger students might be not completely acquainted with their parents’ history (but we controlled for age in our analyses), and some students might have concealed unsatisfactory information and/or might have inflated their parents’ real educational level, thus altering the real links between the predictor, the mediator and the criterion variables. Nevertheless, other factors seem more important in explaining the prevalence of eating disorder symptoms among adolescents: among others, life events such as those raised by traumatic childhood experiences [69–71]. In a study investigating the impact of sexual victimization on the risk of developing eating disorders, in the urban sample a greater effect of sexual victimization was found for the subsequent development of symptoms in the bulimia nervosa spectrum [72].
The exclusive reliance on self-report questionnaires requires some caution in the interpretation of results. However, despite some limitations, self-reported findings on eating habits seem to be reliable indicators of abnormal eating patterns, and possess a sufficiently robust predictive value for the risk of developing an eating disorder [30, 73]. Moreover, the present results are consistent with what is known about the epidemiology of eating disorders, with female subjects scoring significantly higher than male subjects on all inventories [74]. It is worth mentioning that the present samples were not randomly enrolled. However, they were wide enough to allow the generalizability of results to the population of adolescents attending high schools, although it must be stressed that the study contrasts eating behaviour scores from one metropolitan area and one rural town: only a multi-site comparison can thoroughly address the question.
Conclusions
The investigation of rural/urban differences in the prevalence of mental disorders could offer important clues on their aetiology, particularly when sociocultural aspects are likely to affect how subjects and their family address their needs for health-care services. The major finding of the present study is the evidence that the investigation of rural/urban prevalence of eating disorders produces very different results when the comparison is carried out at the dimensional or the categorical level. Although caution is required when reading the findings drawn from self-report instruments, it is evident that the factors influencing the distribution of eating disorder symptoms and their psychological correlates by place of residence are far more complex than currently thought.
Footnotes
Acknowledgements
The authors wish to thank Ms Daniela Bergallo for help in the revision of the English translation.