
Abstract
Conduct disorders in children and adolescents are common and costly to society, in both financial and emotional terms. Three per cent of children aged 6–17 years have a conduct disorder, with a higher prevalence in boys [1]. The high economic cost of conduct disorders in terms of excess health service, educational and criminal justice costs are well documented [2, 3], with conduct-disordered children costing up to 10 times more than children with no conduct problems. Of concern is the association between conduct disorder and future criminality. Approximately 40% of children diagnosed with conduct disorder become recidivist delinquents [4] or adult criminals [5]. Rosenblatt et al.[6] found that the prevalence of conduct disorder in youth with an arrest history was between 50% and 90%, while 62% of youth with a diagnosis of conduct disorder had a recent arrest. The excess costs associated with criminal behaviour are substantial. Cohen [3] estimated that the average cost of career criminals to society is between US$1.3 and $1.5 million over a lifetime.
Parenting interventions based on social learning and functional analysis principles have been demonstrated to be effective in reducing conduct problems in children [7–9]. Most studies of parental interventions have focused on the reduction of disruptive and oppositional behaviours in children, which are an important part of the developmental trajectory leading to serious antisocial behaviour [9, 10]. Few studies have investigated the cost-effectiveness of parenting interventions, although there is interest in establishing the cost-effectiveness of such interventions [11].
The most extensively evaluated parenting intervention based on a population health model of delivery is the Triple P–Positive Parenting Program (developed in Australia by Sanders and colleagues at the University of Queensland [10, 12]). The purpose of this study is to investigate the economic case for the implementation of Triple P on a population basis to reduce the prevalence of conduct disorder in children and adolescents. Importantly, this study is not undertaken to address detailed issues of program design, but rather addresses the more fundamental issue of whether investment in Triple P is likely to be a worthwhile use of health funds.
Triple P is a multi-level system of parenting and family support. The program aims to prevent severe behavioural, emotional and developmental problems in children by enhancing the knowledge, skills, and confidence of parents. It incorporates five levels of intervention on a tiered continuum of increasing strength. The design reflects the differing levels of dysfunction and behavioural disturbance in children, and different needs and preferences of parents regarding the type, intensity and mode of assistance.
Level 1, a universal parent information strategy, involves a coordinated media and promotional campaign to increase community awareness, acceptance and support for the importance of parenting and facilitate parents' access to information about dealing with common child-rearing issues. Level 2 is offered through primary care services and other community agencies in regular contact with families of young children. It incorporates health promotion information and specific advice for discrete developmental issues or minor child behaviour problems via a one to two-session primary health-care intervention or parenting seminar series, as well as user-friendly parenting tip sheets and videotapes that demonstrate specific parenting strategies. Level 3, a four-session primary care intervention, targets children with mild to moderate behavioural difficulties and includes active skills training for parents. Level 4 is an intensive eight to 10-session individual or group parent-training program for children with more severe behavioural difficulties, while Level 5 is an enhanced behavioural family intervention program for families where parenting difficulties are complicated by other sources of family distress (e.g. marital conflict or parental depression).
Method
The assessment of whether Triple P represents economic value is based on a technique called ‘threshold analysis’. (A limited cost-effectiveness analysis is also undertaken.) Threshold analysis is used to assist resource allocation decisions. The critical values of parameters to a decision to invest are identified. For example, a decision-maker may specify an acceptable level of investment or an acceptable cost-effectiveness ratio. Traditionally, the analyst uses available information to assess which combinations of parameter estimates could cause the threshold to be exceeded or achieved [13]. In the current analysis, we assess to what extent Triple P is likely to ‘break even’ in cost terms; that is, to what extent are any cost-offsets greater than the costs of implementing Triple P? The comparator in all analyses is ‘no intervention’. The costs of the intervention include all the resource use associated with delivering Triple P, and the cost-offsets comprise estimated costs associated with cases of conduct disorder prevented.
The cost implications of Triple P are modelled for the population of Queensland using the reference year 2002/2003 and Australian dollars. Model parameters, such as the prevalence of conduct disorder, cost implications for conduct disorder and effectiveness of Triple P, are drawn from the best available published literature.
The study perspective is ‘government as third party funder’, within the health sector, as well as other sectors (particularly criminal justice and education) impacted by conduct disorder [2, 5, 14, 15]. Other costs accruing to families, such as time or childcare, are excluded.
Version 1 of the model is based on a cohort of 2-year-olds followed through time (up to age 28) and exposed to different aspects of Triple P at different stages (e.g. Levels 1 and 2 at age 2, Level 3 at age 4, and Levels 4 and 5 at age 5). This cohort version of the model allows the longer-term costs of a cohort of children to be estimated. In Version 2 of the model, we estimate the annual cost of introducing Triple P to a cross-sectional population of children aged 2–12 years. This prevalence version of the model is particularly useful for administrators and policy-makers interested in the annual cost of introducing Triple P to a population.
Definition of the population of interest
For the costs of Triple P, the base population of interest is the number of families in Queensland who have children aged 2–12 years of age. For the effectiveness of Triple P, the base population of interest is the number of children aged 6–12 years who meet the criteria for conduct disorder.
To determine the current number of children with conduct disorder, the following published prevalence ratios are used: 6–12 years, males 4.8%, females 1.9%; 13–17 years, males 3.8%, females 1.0% [1]. These ratios are comparable to other studies [5, 16]. Prevalence is used in preference to incidence since there is evidence that Triple P impacts on existing cases as well as preventing new cases [17].
Identification, measurement and valuation of costs
The costs of Triple P include: costs of printed material (brochures, tip sheets and workbooks); health professional costs, including child health nurses and allied health practitioners (e.g. clinical psychologists); and education staff costs. Professional costs include salary plus oncosts, overheads and a training component.
Media costs are not included for Level 1 because they incur no cost to the broader government sector (television advertisements are free due to Australian community service obligations of television networks). Family costs (e.g. time costs, travel expenses and child care) are not included (outside a government perspective).
Other health-sector costs/cost-offsets that Triple P may impact (such as treatment of depression in parents and children) are also excluded due to lack of data on which to base plausible assumptions. The current analysis therefore represents a conservative (and limited) perspective on the potential cost-offsets of Triple P.
Printed items for all Triple P levels are costed on a per-item basis. Professional time is costed on an hourly rate adjusting for time involved for each program variant. Information on the frequency of contact for each level of Triple P is derived from published reports [10, 12] as well as verification from Triple P practitioners. Detailed unit cost information is available from the study authors.
Calculation of Triple P costs requires assumptions regarding the relevant proportions of the population to whom the intervention is applied. Slightly different assumptions are made for the cross-sectional annual costs of implementation compared to the cohort costs. With respect to the prevalence version of the model (Version 2), it is assumed that:
Level 1 Universal Triple P: All parents with children aged 2–12 will have access and one brochure per family will be consumed.
Level 2 Selected Triple P: All 2- and 3-yearolds will receive Level 2. The numbers of 2- and 3-year-olds are used to estimate the number of families attending. This assumption overestimates the costs associated with Level 2; however, it is unlikely that the small number of families with twins or very closely aged children will be large enough to bias results. Each Triple P seminar comprises 500 families. We also assume that all families receive two individual sessions (overestimated as not all families require individual contact).
Level 3 Primary Care Triple P: Thirty-three per cent of all families with at least one child within the specified age range will utilize this level. This estimate is based on a recent survey in Queensland which found that one in three parents surveyed stated that their child had had a behavioural or emotional trouble in the previous 6 months [18].
Level 4 Standard/Group/Self-Directed Triple P and Level 5 Enhanced Triple P: Six per cent of families have one version of Level 4. This estimate also comes from the Queensland Survey [18], which found that 9% of children displayed sufficient conduct problems to meet the DSM-IV criteria for a diagnosis of oppositional defiant disorder. We assume the other 3% will have the enhanced version of Triple P (Level 5) and are probably the cases with already diagnosed conduct disorder. Of the 6% assumed eligible for Level 4, 20% will have Standard Triple P, 75% will have Group Triple P and 5% will have Self-Directed Triple P. Some segments of the population (e.g. those in rural and remote areas) may only have access to the self-directed version.
Importantly, the above assumptions model Triple P operating in an optimal mode by assuming ‘steady state’ operation reaching the entire population. Provision for dropouts and non-completers is not included. This has the impact of increasing treatment costs. Triple P has been found to be highly acceptable to parents with low dropout rates, with even the most dysfunctional families maintaining acceptable adherence through strategies such as active engagement [17].
The cohort version of the model (Version 1), makes similar assumptions. In this version we follow all 2-year-olds in Queensland through time (unadjusted for mortality). We assume each 2-year-old is located in a different family and that: all families with a 2-year-old will receive one brochure in Level 1 and will also complete Level 2 (composition of Level 2 is the same as above); Level 3 occurs at 4 years of age and similar to above, 33% will receive Level 3; Level 4 occurs at 5 years of age and 6% will receive Level 4 intervention and the same proportions as above receive the different variants of this level; and, Level 5 occurs at age 5 and only 3% receive this intervention.
It is possible that the treatment proportions differ in a cohort analysis versus the cross-sectional analysis, in that earlier exposure to the intervention may result in smaller proportions requiring subsequent levels. There is insufficient information upon which to base such assumptions.
Costs associated with conduct disorder
The second major cost category considered in this analysis as a cost-offset is the cost associated with conduct disorder. Published international literature is used to estimate this as there are no Australian estimates. Many studies refer to the costs of conduct disorder broadly without detailing which costs are included [5, 19–21]. Others focus on specific aspects of conduct disorder such as somatic, psychiatric or substance abuse co-morbidities [22–26]. Limitations of other studies include: small sample size [15]; measuring costs associated with career criminals, drug abusers and high school dropouts but not conduct disorder [3]; or measuring costs associated with conduct problems rather than conduct disorder [14].
The best study is by Scott and colleagues [2], which determined the costs to the public sector of children with three levels of antisocial behaviour: children with no problems; children with antisocial problems but no disorder on interview; and children with a diagnosis of conduct disorder. The study employed a longitudinal design and tracked participants from 10–28 years of age. Costs included foster and residential care in childhood, special education provision, state benefits received in adulthood, breakdown of relationship (domestic violence and divorce), health, and crime. Excluded costs were social services, voluntary organizations, primary health care, lost employment, divorce (other than public legal costs), undetected crime, costs to victims of crime, parents’ or partners’ use of services arising from participants’ behaviour, indirect costs to families, or psychological impact. These do not represent true lifetime societal costs of conduct disorder, as costs before the age of 10 and after the age of 28 are excluded. This has the effect of conservatively estimating cost-offsets associated with the implementation of Triple P.
The incremental costs of conduct disorder are determined by subtracting the total costs of conduct disorder from the costs of the non-problem group in Scott et al.[2]. The costs in Scott et al.[2] are converted using a two-stage procedure. Firstly, costs are converted to 1998 Australian dollars using purchasing power parities (website: http:/www.oecd.org/std/ppp/) details and then inflated to 2002/2003 equivalent values using the Australian Health Price Deflator [27]. The costs for conduct disorder are presented in Table 1.
Costs and incremental costs of conduct disorder presented in 2002/2003, Australian values
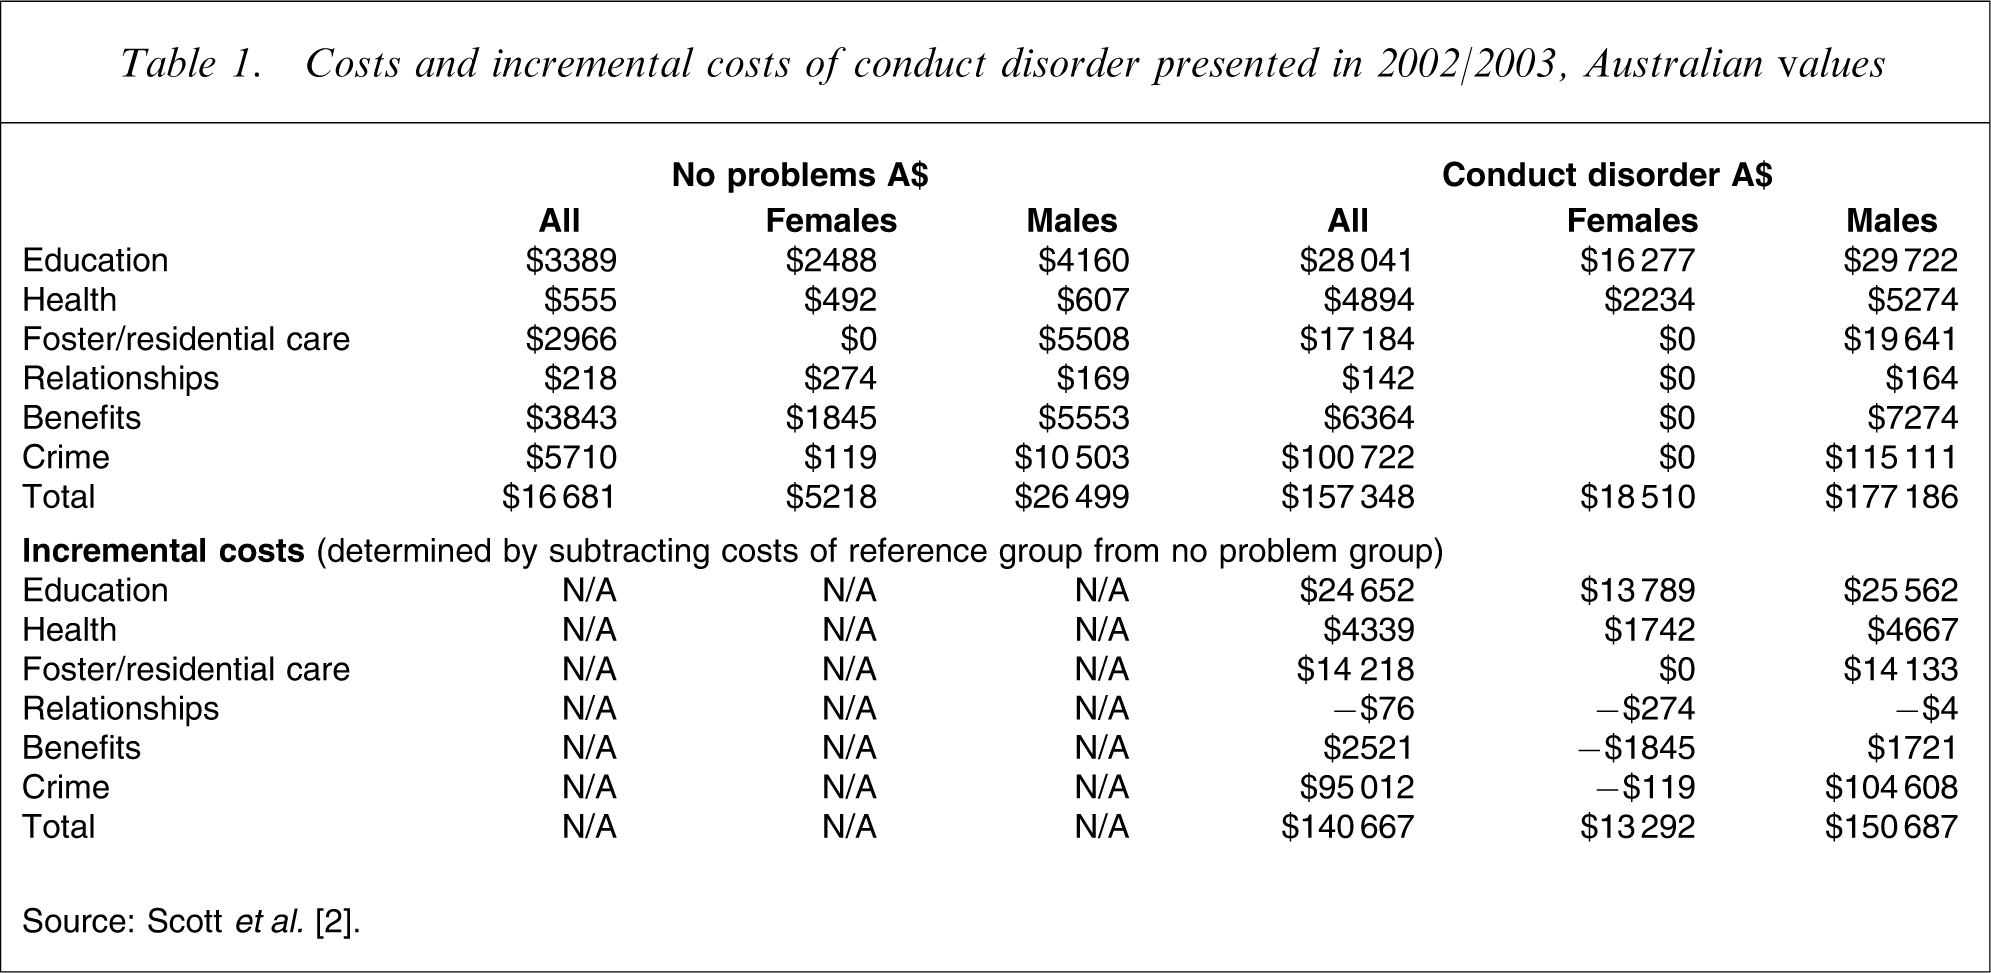
Source: Scott et al.[2].
To determine the costs of conduct disorder for the cross-sectional model, the total numbers of children with conduct disorder were simply multiplied by the incremental costs of conduct disorder ($150 687 for boys and $13 292 for girls). For the cohort version of the model, we determined how many of the children aged 2 were likely to meet a diagnosis of conduct disorder and then multiplied this number by the incremental costs (sex-adjusted). The cost-offsets associated with a reduction in prevalence are determined by multiplying a proportional reduction in prevalence by the incremental cost.
Identification, measurement and valuation of benefits
To determine the reduction in prevalence associated with Triple P, information is drawn from two trials evaluating different levels of the Triple P system of intervention [17, 28]. The proportion of the sample moving from the clinical to the normal range on the Eyberg Child Behavior Inventory (ECBI) is used, in comparison to the waitlist control condition. This standardized parental self-report measure of disruptive behaviour in children has been used extensively in trials evaluating the effects of parental interventions on conduct problems [29]. The ECBI is a 36-item measure of parental perceptions of disruptive behaviour in children aged 2–16 years. It incorporates a measure of frequency of disruptive behaviours (Intensity) rated on 7-point scales and a measure of the number of disruptive behaviours that are a problem for parents (Problem). The ECBI has been shown to have good psychometric properties [30] and is sensitive to intervention effects, allowing the tracking of behaviour over time. While the proportions at follow-up provide longer-term effects of the intervention, this data is not available for the control group as they had received the intervention by this time. On the ECBI intensity score, the average proportion change (averaged across the Levels 3,4 and 5) for the intervention groups is 55.8% at post-assessment and 56.4% at the longest available follow-up (6 months and 3 years, respectively), and following waitlist is 30%. Therefore, at post-assessment 25.8% more of the intervention group move from the clinical to the normal range. This increases slightly to 26.4% comparing follow-up assessment for the intervention groups to post-assessment for the waitlist controls, although the disparity in the time frame for these assessments must be considered.
The other index of conduct problems is the Parent Daily Report (PDR) [31]. Parents note which of 33 specific problematic child behaviours are of concern in their family and indicate which behaviours occur daily for 7 days. The PDR also has good psychometric properties, and has also shown sensitivity to intervention effects [31]. The average frequency of reported problem behaviours is used in assessing conduct problems. Results are somewhat more pronounced on the PDR, with an incremental benefit of 43% at post and 48% at follow-up.
We therefore assume that Triple P has the potential to reduce the prevalence of conduct disorder by between 25.8% and 48%. The implicit assumption here is that these reductions are also found in children with conduct disorder and are sufficient to reduce the prevalence of the condition (an assumption requiring verification). Given the primary purpose of the current analysis is to conduct a threshold analysis, the above range serves as a guide only and is used to assess to what extent it is likely that Triple P can ‘break even’.
Discounting
There is no need to discount the costs of Triple P in the cross-sectional version of the model as all costs are accrued in a single year. The costs derived in the cohort version of the model have been discounted using the following rates: 6% (costs) and 1.5% (benefits) [32]. Benefits have been discounted assuming that ‘caseness’ begins at age 6. Results are presented with and without discounting.
Sensitivity analysis
Given the exploratory nature of the current analysis, a complicated multivariate probabilistic analysis is inappropriate at this stage. Univariate analysis determining the effect of varying key assumptions on final results is undertaken.
The assumptions made in costing Triple P generally have the effect of over-estimating the intervention costs (with the exception of the media costs). We further vary the assumptions using the following parameters in the cohort model: 12% instead of 9% of the total population receive Level 4 Triple P; 4% instead of 3% have Level 5.
The costs of conduct disorder are also varied by excluding the costs associated with benefits paid (e.g., transfer payments not usually considered in societal perspective economic evaluation) and costs associated with relationships (e.g. legal divorce costs).
Perhaps the most important uncertainty estimate in this analysis is the reduction in prevalence associated with Triple P. We therefore model a reduction in prevalence at 48% and then from 26% (minimum estimated impact of Triple P) down to 1% to observe the effect on conclusions. This is a conservative approach to sensitivity testing as we have generally been conservative both with costs and benefits.
Results
There were approximately 12 582 children aged 6–12 years with conduct disorder in Queensland in 2002.
Costs associated with Triple P
The prevalence cost (Version 2) of implementing Triple P in Queensland to 572 701 children aged between 2 and 12 years of age (315 378 families) is A$19.7 million (Level 1, $240 000; Level 2, $5.8 million; Level 3, $5.7 million; Level 4, $4 million; Level 5, $3.6 million) with an average cost of $34 per child.
The cost of implementing Triple P to a single cohort of 2-year-olds over time (Version 1) is A$9.6 million (undiscounted A$10.6 million). The costs associated with the levels are (discounted): Level 1, $140 000; Level 2, $3 million; Level 3, $3 million; Level 4, $1.7 million; Level 5, $1.8 million. The average cost per child in 2002/2003 present value terms is $51.
Costs associated with conduct disorder
The costs of conduct disorder for children and adolescents in Queensland until the age of 28 years are A$1.4 billion (Version 2 of model).
Threshold analysis (including variation in prevalence rate reduction)
Table 2 contains the threshold analysis from the prevalence version of the model. Contained in this table are the reduced numbers of cases expected, plus the associated cost-savings. It is clear that to pay for itself Triple P would only need to avert less than 1.5% of cases of conduct disorder. With greater levels of effectiveness, Triple P costs less than the amount it saves.
Threshold analysis (cross-sectional)
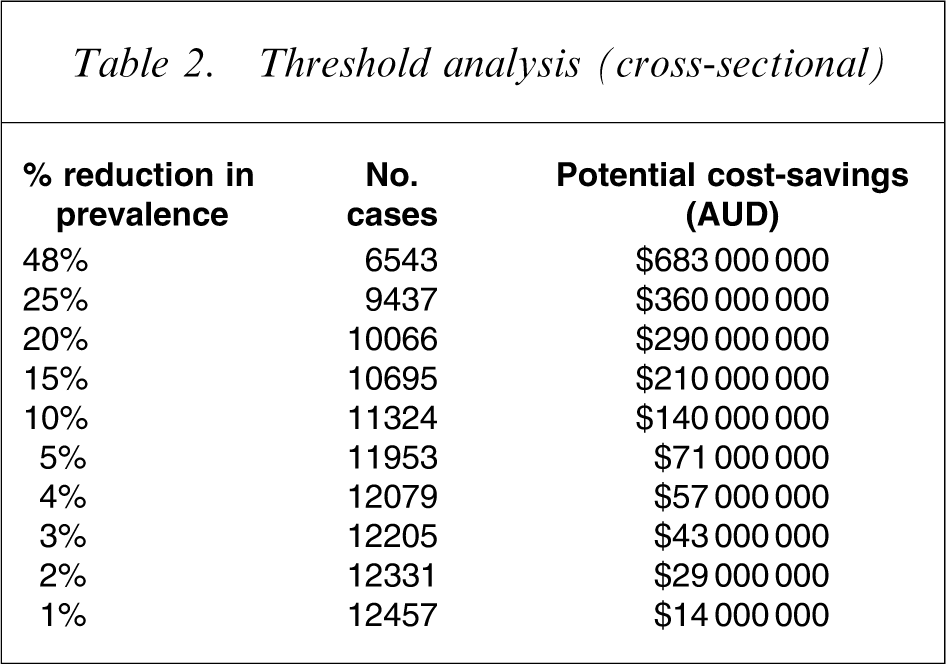
Table 3 contains the threshold analysis results from the cohort analysis. Triple P remains a dominant intervention until the reduction in prevalence falls below 7%. However, this is not to say that a reduction below 7% infers that Triple P is cost-ineffective; there is simply a positive cost associated with the intervention. The incremental cost-effectiveness ratios are still reasonable up until a reduction in prevalence of 4%. A threshold cut-off shadow price above which interventions are considered cost-ineffective (such as $50 000 per quality-adjusted-life-year) has not been determined for the current study as it is not clear what this shadow price should be in a cost-effectiveness study that does not present results in terms of a generic economic outcome. It is up to each individual decision-maker to infer such a cut-off.
Threshold analysis (cohort)
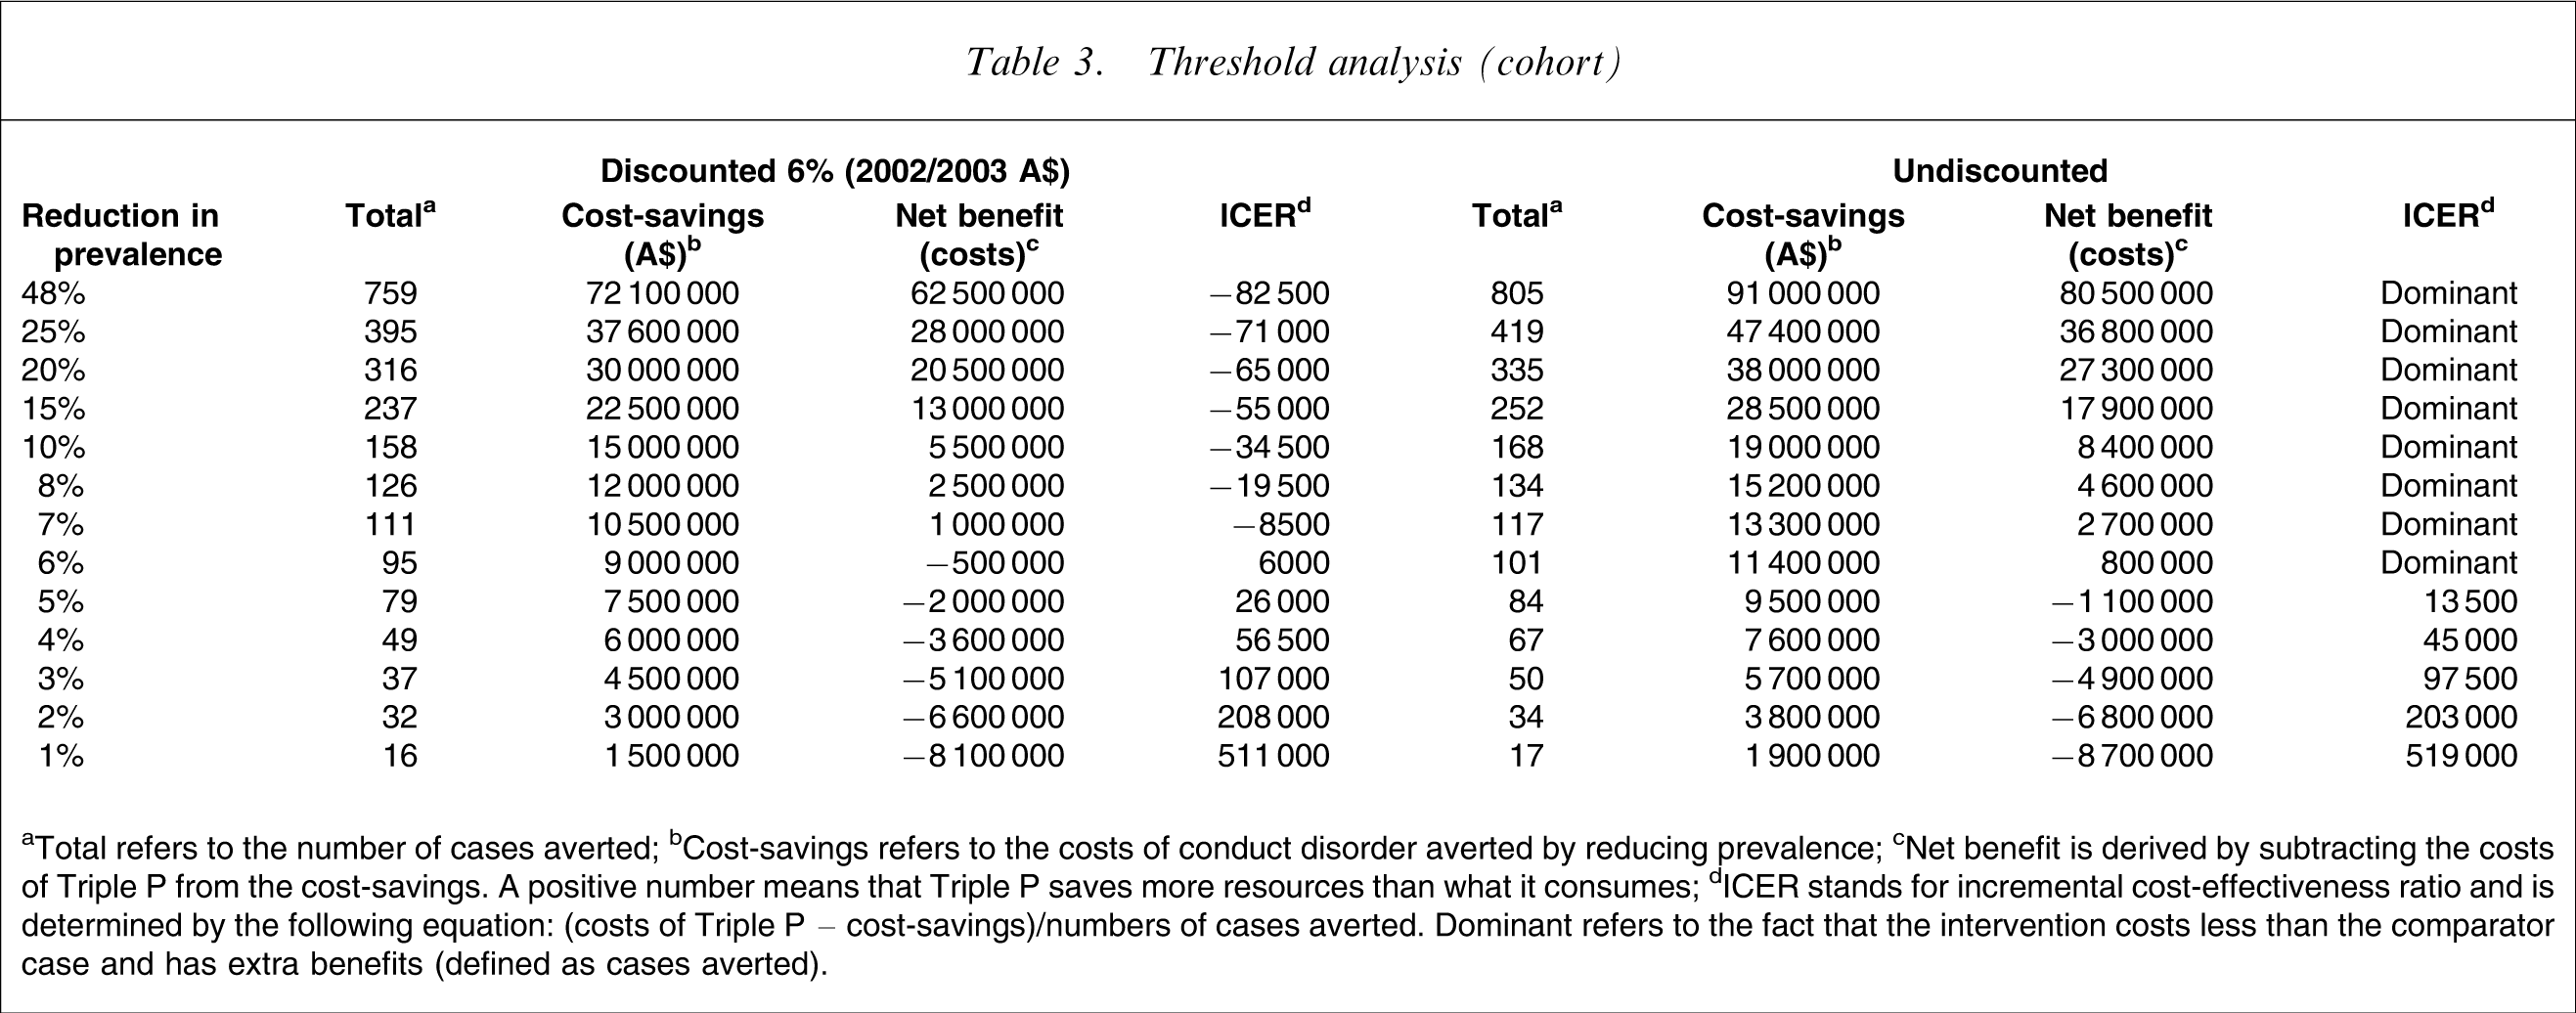
aTotal refers to the number of cases averted; bCost-savings refers to the costs of conduct disorder averted by reducing prevalence; cNet benefit is derived by subtracting the costs of Triple P from the cost-savings. A positive number means that Triple P saves more resources than what it consumes; dICER stands for incremental cost-effectiveness ratio and is determined by the following equation: (costs of Triple P – cost-savings)/numbers of cases averted. Dominant refers to the fact that the intervention costs less than the comparator case and has extra benefits (defined as cases averted).
Sensitivity analysis
Variation in the costing parameters has little impact on the conclusions. The exclusion of transfer payments and relationship costs in the costs of conduct disorder make no difference to final conclusions. Discounting has a negligible effect on final results.
Discussion
It is fair to conclude that Triple P has the potential of saving more resources than it consumes. The economic modelling rests on a number of assumptions, albeit mostly conservative ones, requiring verification. Nevertheless, even modest improvements in prevalence are sufficient to make Triple P a cost-saving intervention. The reason for this is that the costs of conduct disorder are substantial. It is important to reiterate that the cost estimates of conduct disorder used in the current study [2] are conservative. They are not lifetime costs and do not include a number of important cost categories, which can be significant [5]. Further, the Scott et°al.[2] study occurred in the UK and the external generalizability of the estimates to other settings is an issue. Other cost estimates such as Cohen [3] are much larger than Scott et al.[2], and had these estimates been used Triple P would save more resources and appear more economically attractive. Conversely, for countries where advertisements are not covered by community service obligations, Level 1 Triple P would be more costly. It is not possible to compare the results of the current study with other economic evaluations of preventative or early-targeted parenting interventions as none have been published.
It is also important to appreciate that the current analysis only considers conduct disorder and may underestimate the true impact of Triple P. Triple P may provide additional benefits, such as reduction in maltreatment, improvements in parental quality of life, and wider societal benefits associated with less social delinquency and crime. For example, a US study found that within a hospital setting, children admitted because of child abuse had a higher daily hospitalization charge (compared to children with serious illness) as well as a greater likelihood of mortality [33]. It is also possible that the implementation of Triple P may increase the usage of other services (through increased awareness of services and reduced stigma), or conversely, to reduce service usage (through health promotion, prevention and early intervention). To what extent this will happen is hard to predict but unlikely to be large enough to change the general conclusions of this analysis.
Further evaluation is required of the naturalistic implementation of Triple P to estimate the true effectiveness and costs of the intervention. Likewise, empirical estimates of final outcomes rather than intermediate outcomes are required. Even though the current study uses efficacy estimates of reduction in prevalence, the extensive reduction in prevalence used in the threshold analysis more than accounts for real-life effectiveness.
In terms of the feasibility of implementation, the current analysis has built training costs into the costs of each of the professionals delivering the intervention. The analysis assumes that there is an available workforce to deliver the intervention on a population level. With respect to equity considerations, given that the prevalence of conduct disorder is greater in lower socio-economic status families, Triple P should have a positive impact.
Lastly, cost-offsets modelled do not necessarily represent actual financial savings, due to the impact of fixed costs, system rigidities and ‘lumpiness’ in production. This is an issue that future research needs to investigate.
Disclosure
The University of Queensland holds the copyright of the Triple P system. Uniquest, its technology transfer company, has licensed Triple P International to disseminate the program worldwide. Royalties from this dissemination activity are paid to Uniquest, and through them distributed to the University, Faculty, School of Psychology and authors according to The University of Queensland's splits policy for intellectual property.