
Abstract
Depression is a major public health concern [1–3] and a number of studies have found shortcomings in its detection and management [4–7]. However, in the last decade determined efforts have been made at Government, professional, charitable and industry levels to enhance public knowledge about the ubiquity of mental disorders, particularly depression, and the effectiveness and availability of treatments. These have included the Better Outcomes in Mental Health Care programme [8], which is part of the National Mental Health Strategy [9]; the establishment of beyondblue: the National Depression Initiative [10], a predominantly federally funded body, albeit with contributions from a number of States; continuing education programmes from national organisations in Australia [11] and New Zealand [12]; publicity from the Mental Health Foundation of Australia [13]; and marketing via general practice and specialist educational programmes sponsored by pharmaceutical companies [14].
Issues that have been addressed have included not only publicizing the common symptoms of depression, but also providing information about appropriate management and reducing the stigma associated with help seeking. These endeavours have resulted in changes in mental health literacy in the community, both Australia-wide [15] and specifically in South Australia [16], but whether these have translated into changes in the prevalence of depression and its management, the health-related quality of life (HRQoL) of those with depression, or the excess costs associated with depression, has not yet been evaluated.
It is now timely to examine whether there have been such changes. This paper reports the findings of a survey of depression in a random and representative sample of the South Australian community, utilizing the same methodology as a 1998 survey [3, 17, 18], which therefore provides the baseline for the 2004 comparison.
Method
Data were collected in Autumn 2004 using a Health Omnibus Survey (HOS) of both metropolitan and rural South Australians at least 15 years of age using the same method as in 1998 [3, 17, 18]. The HOS is a user-pays survey for health organizations, which in 2004 included areas such as asthma, arthritis, diabetes, incontinence and medication use. The metropolitan sample was based on the collectors’ districts used by the Australian Bureau of Statistics (ABS) in the 2001 Census [19]. Ten dwellings were chosen in each, by selecting every fourth household from a random starting point. Only one interview was conducted per household and, when more than one person over the age of 15 resided in that household, the respondent was the person who last had a birthday.
The rural sample included country towns with a population of 1000 or more based on the ABS 2001 Census. Using the same procedure as for the metropolitan sample, one person per dwelling was selected for interview.
The survey was conducted by experienced health interviewers. For reliability purposes re-interviews for selected questions were conducted on a random 10% of each interviewer's work. Data were weighted according to benchmarks derived from the 2001 Census and 2002 Estimated Resident Population [20] to provide estimates representative of the South Australian population in terms of age, sex and region (metropolitan, non-metropolitan).
Depression assessment
Depression assessment was undertaken using the mood module of the Primary Care Evaluation of Mental Disorders (PRIME-MD) instrument, which has demonstrated reliability and validity in primary health care settings [21, 22]. It consists of 16 questions related to symptoms of depression experienced nearly every day for the last 2weeks (categorized as yes/no), and was embedded in the HOS. Scoring to determine depression ‘caseness’ was undertaken at the data analysis stage using the PRIME-MD method for detection of DSM-IV diagnoses. The frequency of reporting of individual depression symptoms was also examined.
Health service utilization and health-related quality of life
The Assessment of Quality of Life (AQoL) instrument was used to assess health-related quality of life (HRQoL) [23]. The AQoL measures handicap that arises from living with health conditions and comprises 15 items that measure five dimensions: illness; independent living; social relationships; physical senses; and psychological well-being. The standard algorithm for computing utilities is used in this study. This weights responses by community preferences and uses a multiplicative model to combine the resulting values within the latter four dimensions such that dimension scores are presented on a 0.00 (worst HRQoL state) to 1.00 (best HRQoL for that dimension) scale. Dimension scores are then re-weighted and a multiplicative model is used to combine these dimension scores. This score is then transformed onto a life–death scale where the end-points are −0.04 (worse than death HRQoL equivalent state), 0.00 (death equivalent HRQoL state) to 1.00 (best HRQoL).
Other indicators of severity measured included number of days unable to work or carry out normal duties in the last month because of ill health, and use and frequency of use of a range of services in the last month, measured as consultations with specific professionals and other community and hospital services. Respondents were also asked whether they had taken, or were currently taking antidepressants. Demographic data were also collected.
Excess costs
Costs were assigned using the Drummond et al. classifications: costs consumed within the health-care sector, costs borne by the individual and his/her family, and costs borne by other sectors of the economy [24]. As far as possible, the calculations used by Hawthorne et al. in the 1998 HOS [18] were applied, except where small differences in the types of questions or the availability of cost data applied, as noted here. All costs reported are in Australian dollars (AUD) unless otherwise specified. In comparing 2004 costs with those in the previous survey, 1998 costs were adjusted to 2004 AUD based on increases in the Consumer Price Index (CPI).
Although the HOS measured service use within the previous 4 weeks, it did not ask about the number of times each service was accessed. We estimated it from the 2001 National Health Survey report [25], which states that of those consulting a general practitioner (GP) within the previous 2weeks, 81% reported one consultation, 15% two consultations and 4% three or more consultations. It is acknowledged that these data underestimate service use, because the number of consultations within 4weeks will be higher. It was estimated from the latest Australian Institute of Health and Welfare (AIHW) health report that the annual average number of GP/specialist consultations was 5.9 [26]. From this we estimated the number of consultations and extrapolated these to the use of other health services where the data were not available (e.g. acupuncturists, chiropractors, community health centres). Data on use of dental services were excluded from the analysis because these were not collected in the 1998 HOS.
Regarding pharmaceuticals, in 2002–2003 there were 173.9m Pharmaceutical Benefits Schedule (PBS; the government subsidy scheme) or Repatriation PBS (RPBS) prescriptions, and 42.6m other prescriptions [26]. The average was 10.8 prescriptions per person per annum (from 216.5m prescriptions per 20m Australians). Dividing by the average number of consultations (5.9) provided an estimate of 1.8 prescriptions per consultation. This figure was used to estimate pharmaceutical use because it was consistent with that used in our 1998 data analysis [18].
Where costs could not be obtained directly, they were assigned. The Medicare scheduled fee for a GP consultation was $30.20; and for a specialist it was $71.10 for the first visit and $35.65 thereafter [27]. Private health insurance costs were obtained from Medibank Private, Australia's largest health insurer. Average rebates for a psychologist were $58.80 for a first visit and $51.45 for subsequent visits [Medibank Private: personal communication]. The AIHW report showed that total non-hospital pharmaceutical costs were $8989m in 2001–2002, of which $5586m was for PBS/RPBS pharmaceuticals [26]. From these data the average cost per PBS/RPBS script was $5586/173.9, that is, $32.12.
Hospital costs were calculated from the 2002–2003 South Australian Public Hospital (SAPH) record [27]. The 2003 SA population was 1 527 000 persons [28]. The AIHW estimated that hospital costs, per capita, for South Australia in 2002–2003 were $343 [AIHW, personal communication]. SA Public Hospital receipts were $64 590 000; there were 346 529 public hospital separations and 1,842,082 outpatient visits. The mean cost of inpatient services was $186.39 and outpatient visits was $129.82. During 2002–2003 the average length of stay (ALOS) in SA hospitals was 3.60days, and the average cost per separation was estimated at $2796 [29]. The average cost per diagnostic-related group (DRG) was $2796; thus the average daily cost was $776.67.
For SA depression admissions, the ALOS was 9.3days for public hospitals, and 6.3 (+3.1 for recurrent depression) for private hospitals [29]. The number of depressive episode separations was 2417 (SA public hospitals) and 1105 (+4391 for recurrent depression; SA private hospitals) [29]. The 2004 National Mental Health Report showed the SA mental health per capita cost was $104.03, of which inpatient services were $63.35 and ambulatory services were $35.18 [30].
Costs of allied health professionals (AHPs; chiropractors, physiotherapists, acupuncturists) were estimated from average Medibank Private rebates (for many AHPs there are no Australian recommended or award fees). Acupuncturist rebates were $25.75 (first visit) and $18.40 (thereafter), for a chiropractor they were $28.60 (first visit) and $20.05 (thereafter), and for a physiotherapist, $27.60 and $21.30 [Medibank Private: personal communication]. Nursing costs were estimated using the SA Nurses’ Award [31] at $27.49 per hour and social worker costs were estimated at $115.00 per consultation [32]. Because the costs of counsellors, alternative therapists and other AHPs are unknown, chiropractor costs were assigned as estimates. For community mental health services and centres we assigned GP costs.
Out-of-pocket costs were estimated at 20% of direct costs. Because the proportion charging above the scheduled fee and the amount charged is unknown, we assumed that 50% of all visits incurred out-of-pocket co-payments of 40%, based on the Medibank Private recognized fee.
Regarding loss of wages, ABS data show average weekly earnings in SA in 2004 of $660.30, or $17.61 per hour or $132.06 per day [32]. Where a person had to reduce their work because of their health, we estimated that this reduction would be 20%.
Statistical analyses
Statistical analyses were undertaken using SPSS 12.0.1 [33]. Using the PRIME-MD method for detection of DSM-IV diagnoses, respondents were classified as having major depression, other depressions (including dysthymia, minor depression, partial remission of major depression) or no depression.
Categorical variables were examined using χ2, and where distributional assumptions were violated the Fisher exact test was used instead. To examine differences in proportions between 1998 and 2004, high log linear analysis was used. To examine differences over time for dichotomous health service variables (used/not used) odds ratios (OR) and 95% confidence intervals (95%CI) were computed using logistic regression, controlling for demographic characteristics (gender, age, education attainment and relationship status). Differences in excess health costs were described using means and 95%CI.
Continuous variables were examined using the independent t-test or, where variance assumptions were violated, Welsh's approximate t was used instead. Differences in AQoL scores between 1998 and 2004 by depression classification were examined using analysis of covariance (ANCOVA). Where data were extremely skewed, Kruskall–Wallis ANOVA was used.
Results
From the 4700 households selected, 127 were found to be vacant dwellings. From the remaining dwellings, 3015 interviews were conducted (65.9% response rate, compared to 70.2% in 1998). Non-response was due to refusal (n = 945), contact not being established after six visits (n = 366), language barrier (n = 82), the selected respondent being absent for the duration of the survey (n = 58), illness (n = 62), inability to gain access to dwelling (n = 39), and termination of the interview (n = 6).
Depression assessment: comparing 2004 with 1998
Of the 3015 respondents to the 2004 survey, 8.0% (95%CI = 7.0–9.0%; 10.1% of female respondents; 5.8% of male respondents) were classified as having major depression compared with 6.8% (95%CI = 5.9–7.7%; 8.2% of female and 5.4% of male respondents) in the 1998 survey. Other depressions were detected in 8.4% (95%CI = 7.4–9.4%; 8.2% of female and 8.5% of male respondents) compared with 10.6% (95%CI = 9.6–11.7%; 11.2% of female and 10.0% of male respondents) in 1998. There was a statistically significant decrease in the number of cases of other depression in 2004 compared with 1998 (LLχ2=10.98, df = 2, p = 0.01), and a statistically significant increase in the number of female respondents with either other or major depression when compared with male respondents (LLχ2=29.29, df = 2, p < 0.01). There was no significant difference in the proportion classified with major depression.
A breakdown of the symptoms of depression is provided in Table 1. As expected, for all symptoms there were elevated proportions among other and major depressions. With regard to the mean number of symptoms reported for the other depression group it was 2.80 (SD = 1.12) in 1998 and 2.62 (SD = 1.32) in 2004 (Welch's t = 1.89, df = 564, p = 0.06). For those with major depression it was 6.41 (SD = 1.33) and 6.52 (SD = 1.34), respectively (Student's t = 0.87, df = 444, p = 0.39).
PRIME-MD symptoms by depression classification, 1998 and 2004
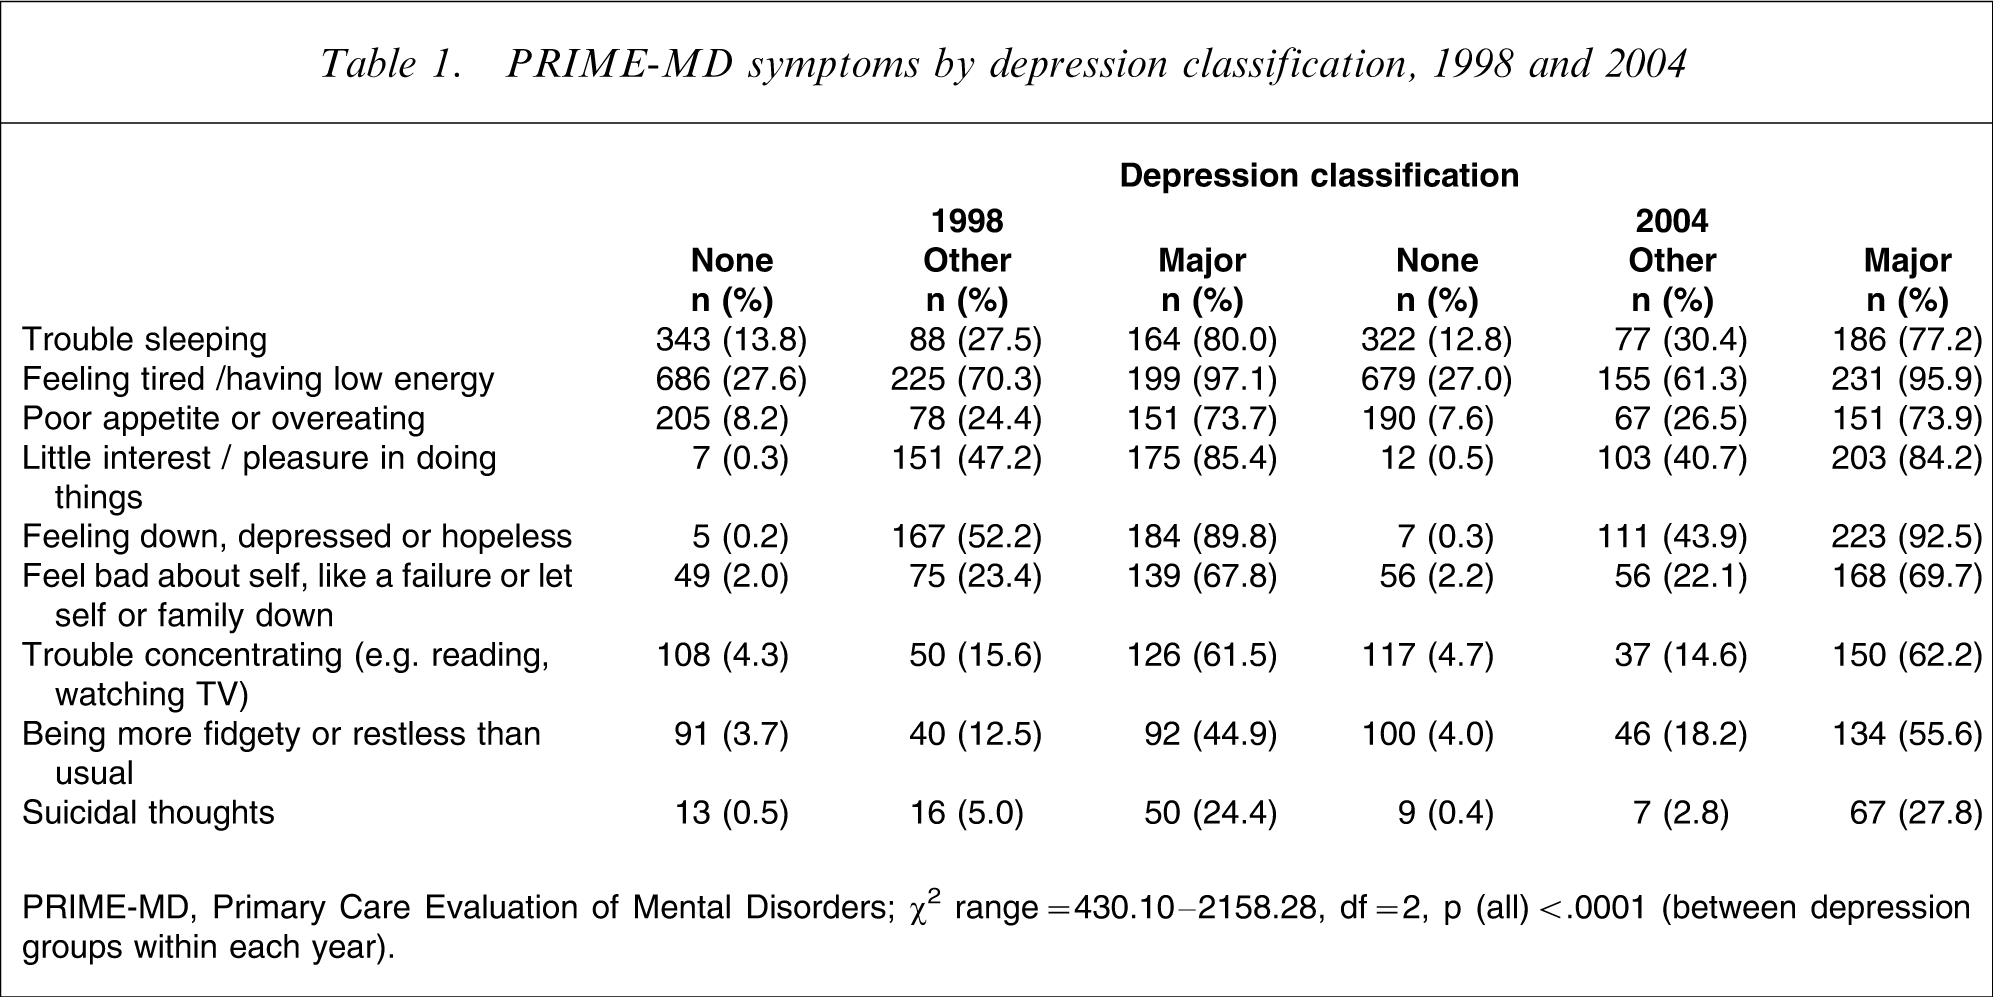
PRIME-MD, Primary Care Evaluation of Mental Disorders.
χ2 range = 430.10–2158.28, df = 2, p (all)<.0001 (between depression groups within each year).
Regarding the reporting of individual PRIME-MD symptoms, there were no significant differences between 1998 and 2004 for those with no depression. Among those with other depressions, there was a significant decrease in the reporting of feeling tired or having low energy (χ2=5.44, df = 1, p = 0.02), and of feeling down, depressed or hopeless (χ2=4.06, df = 1, p = 0.04) in 2004 compared with 1998. Among those with major depression, there was a significant increase in reporting of being fidgety or restless (χ2=5.10, df = 1, p = 0.02) in 2004 compared with 1998.
Health service utilization and health-related quality of life
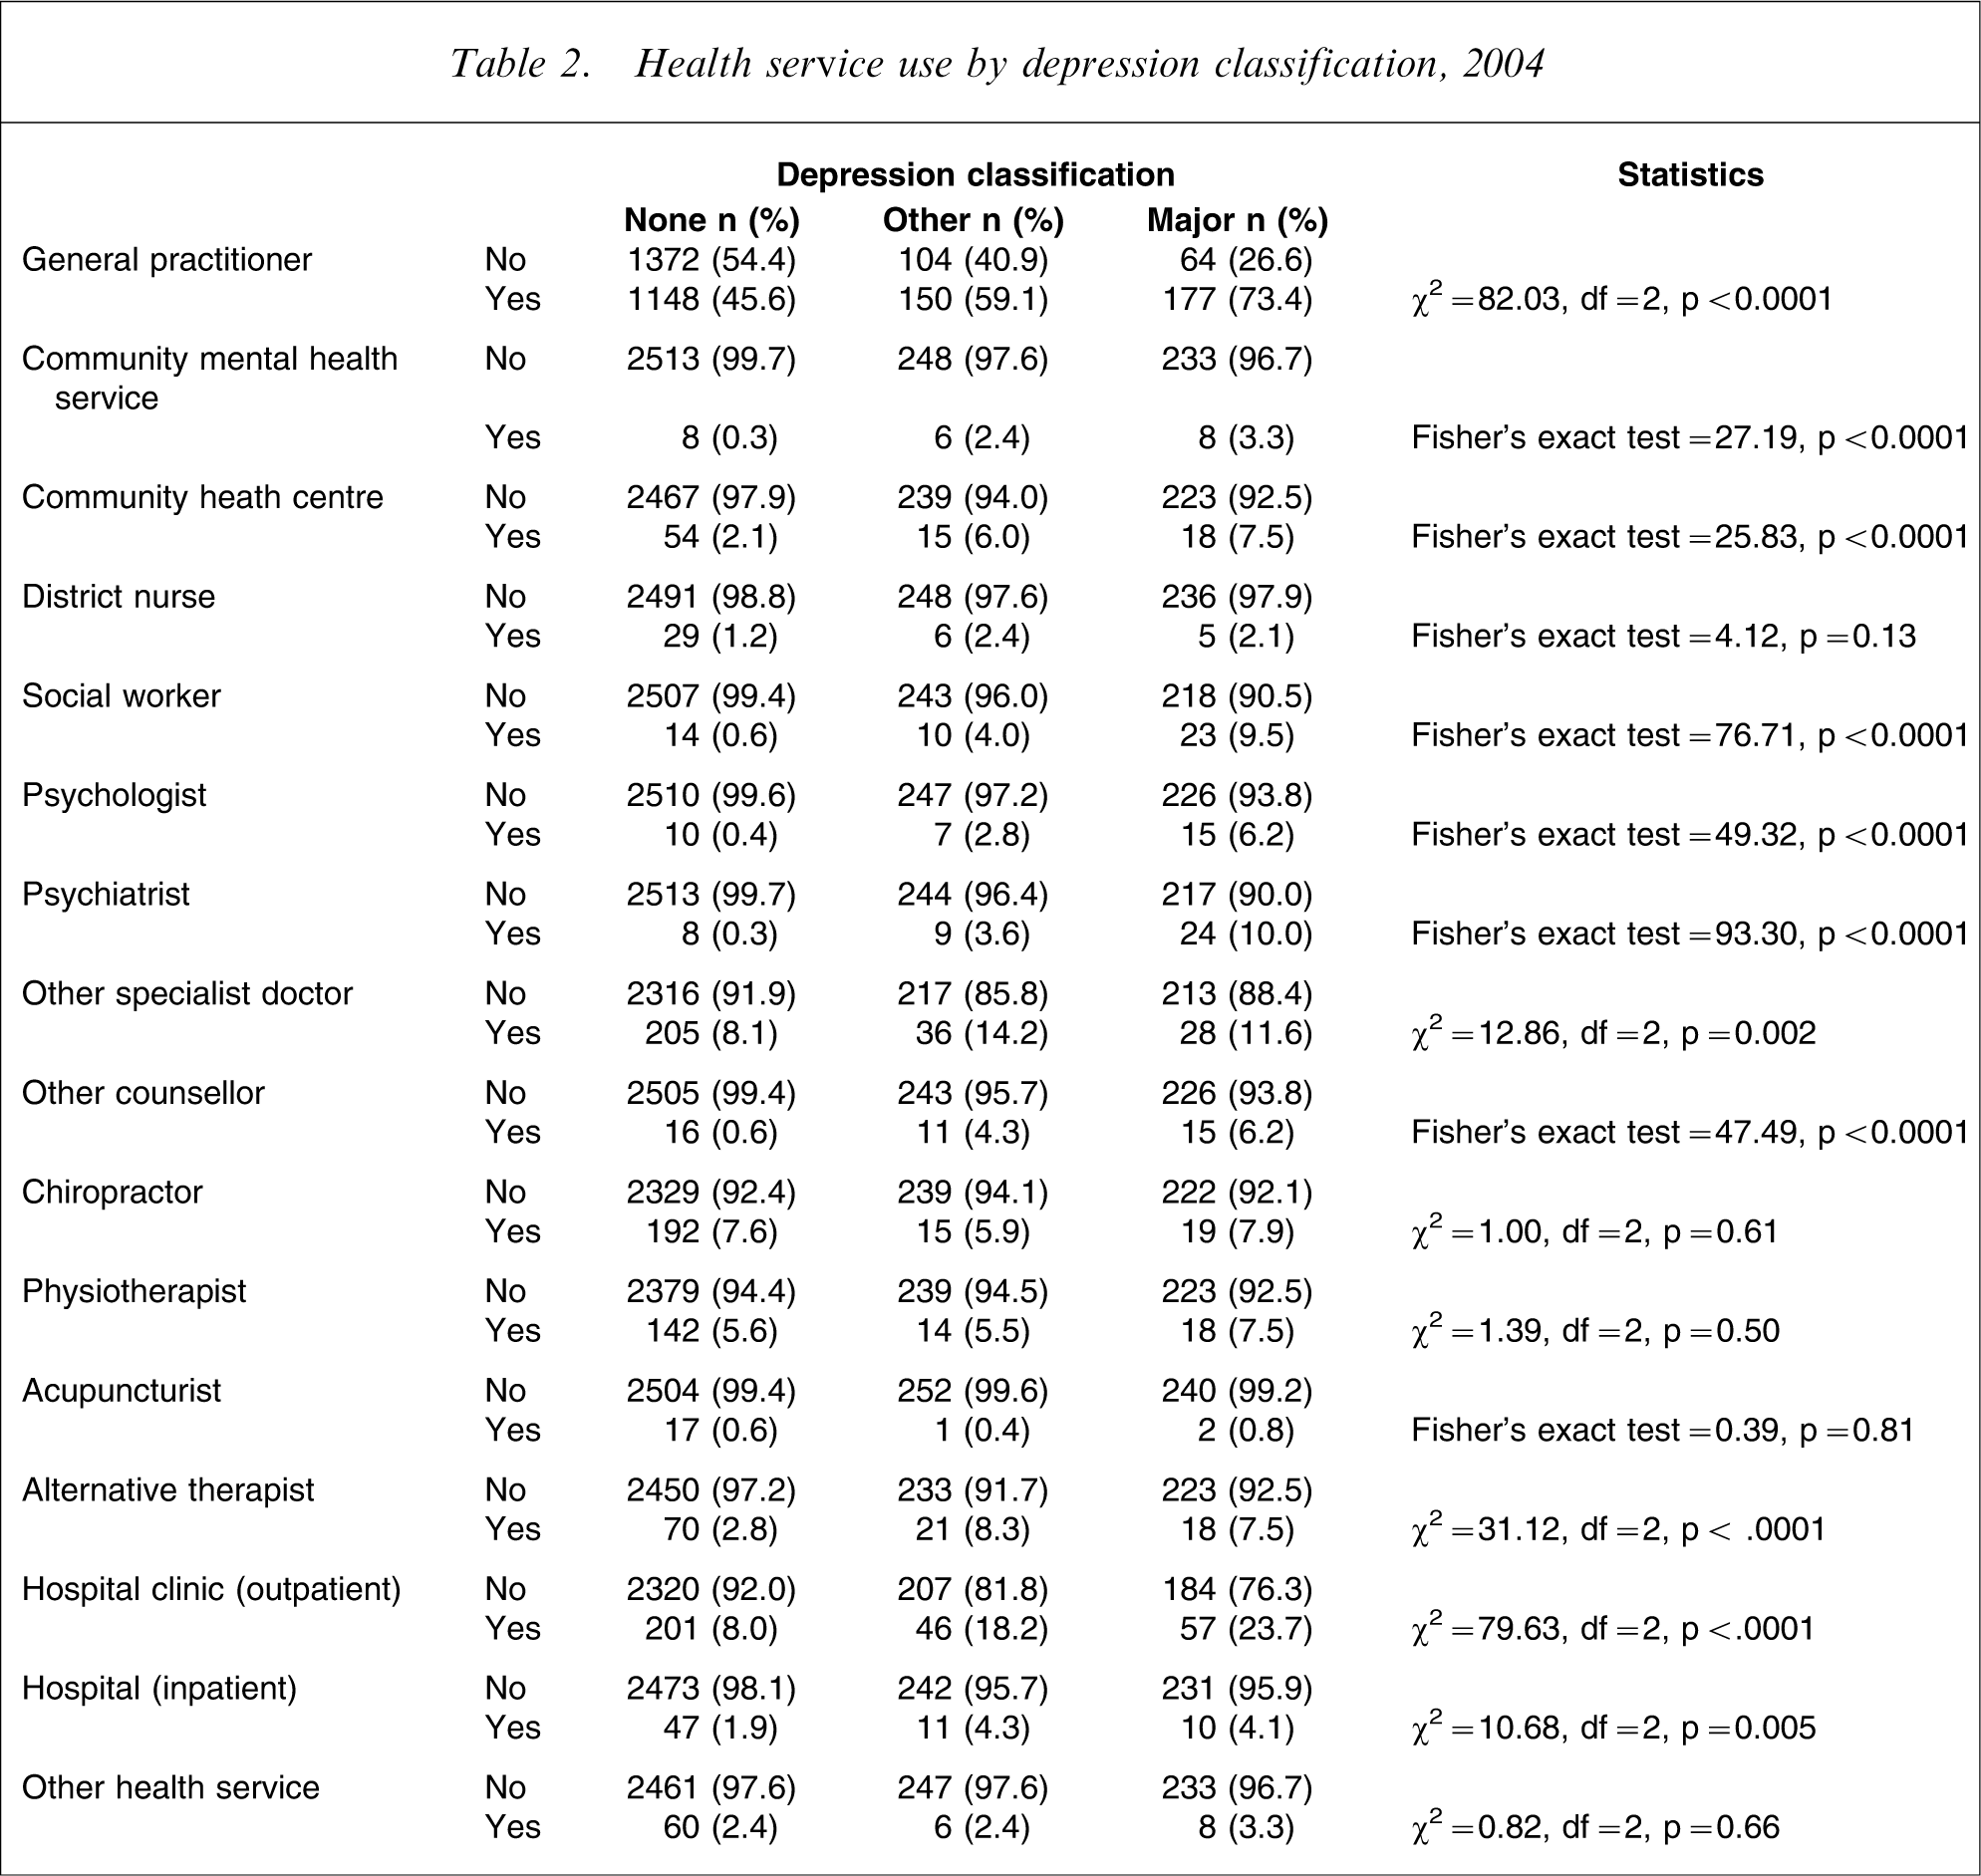
Table 2 shows health services used in the last month for those in 2004, with lowest use among the non-depressed, highest use in those with major depression and intermediate use in the other depressions group. Those with major depression and other depression were more likely to report use of GPs, community mental health services, community health centres, social workers, psychologists, psychiatrists, other medical specialists, other counsellors, alternative therapists, hospital outpatient clinics and to have been admitted as an inpatient.
Health service use by depression classification, 2004
Because of the small numbers for the use of some health services, these were combined into logical groups. Table 3 shows the numbers of patients reporting use of the various services, and Table 4 shows the analysis of these data, after adjustment for selected sociodemographic variables.
Comparison of health service use, 1998 with 2004, by depression classification
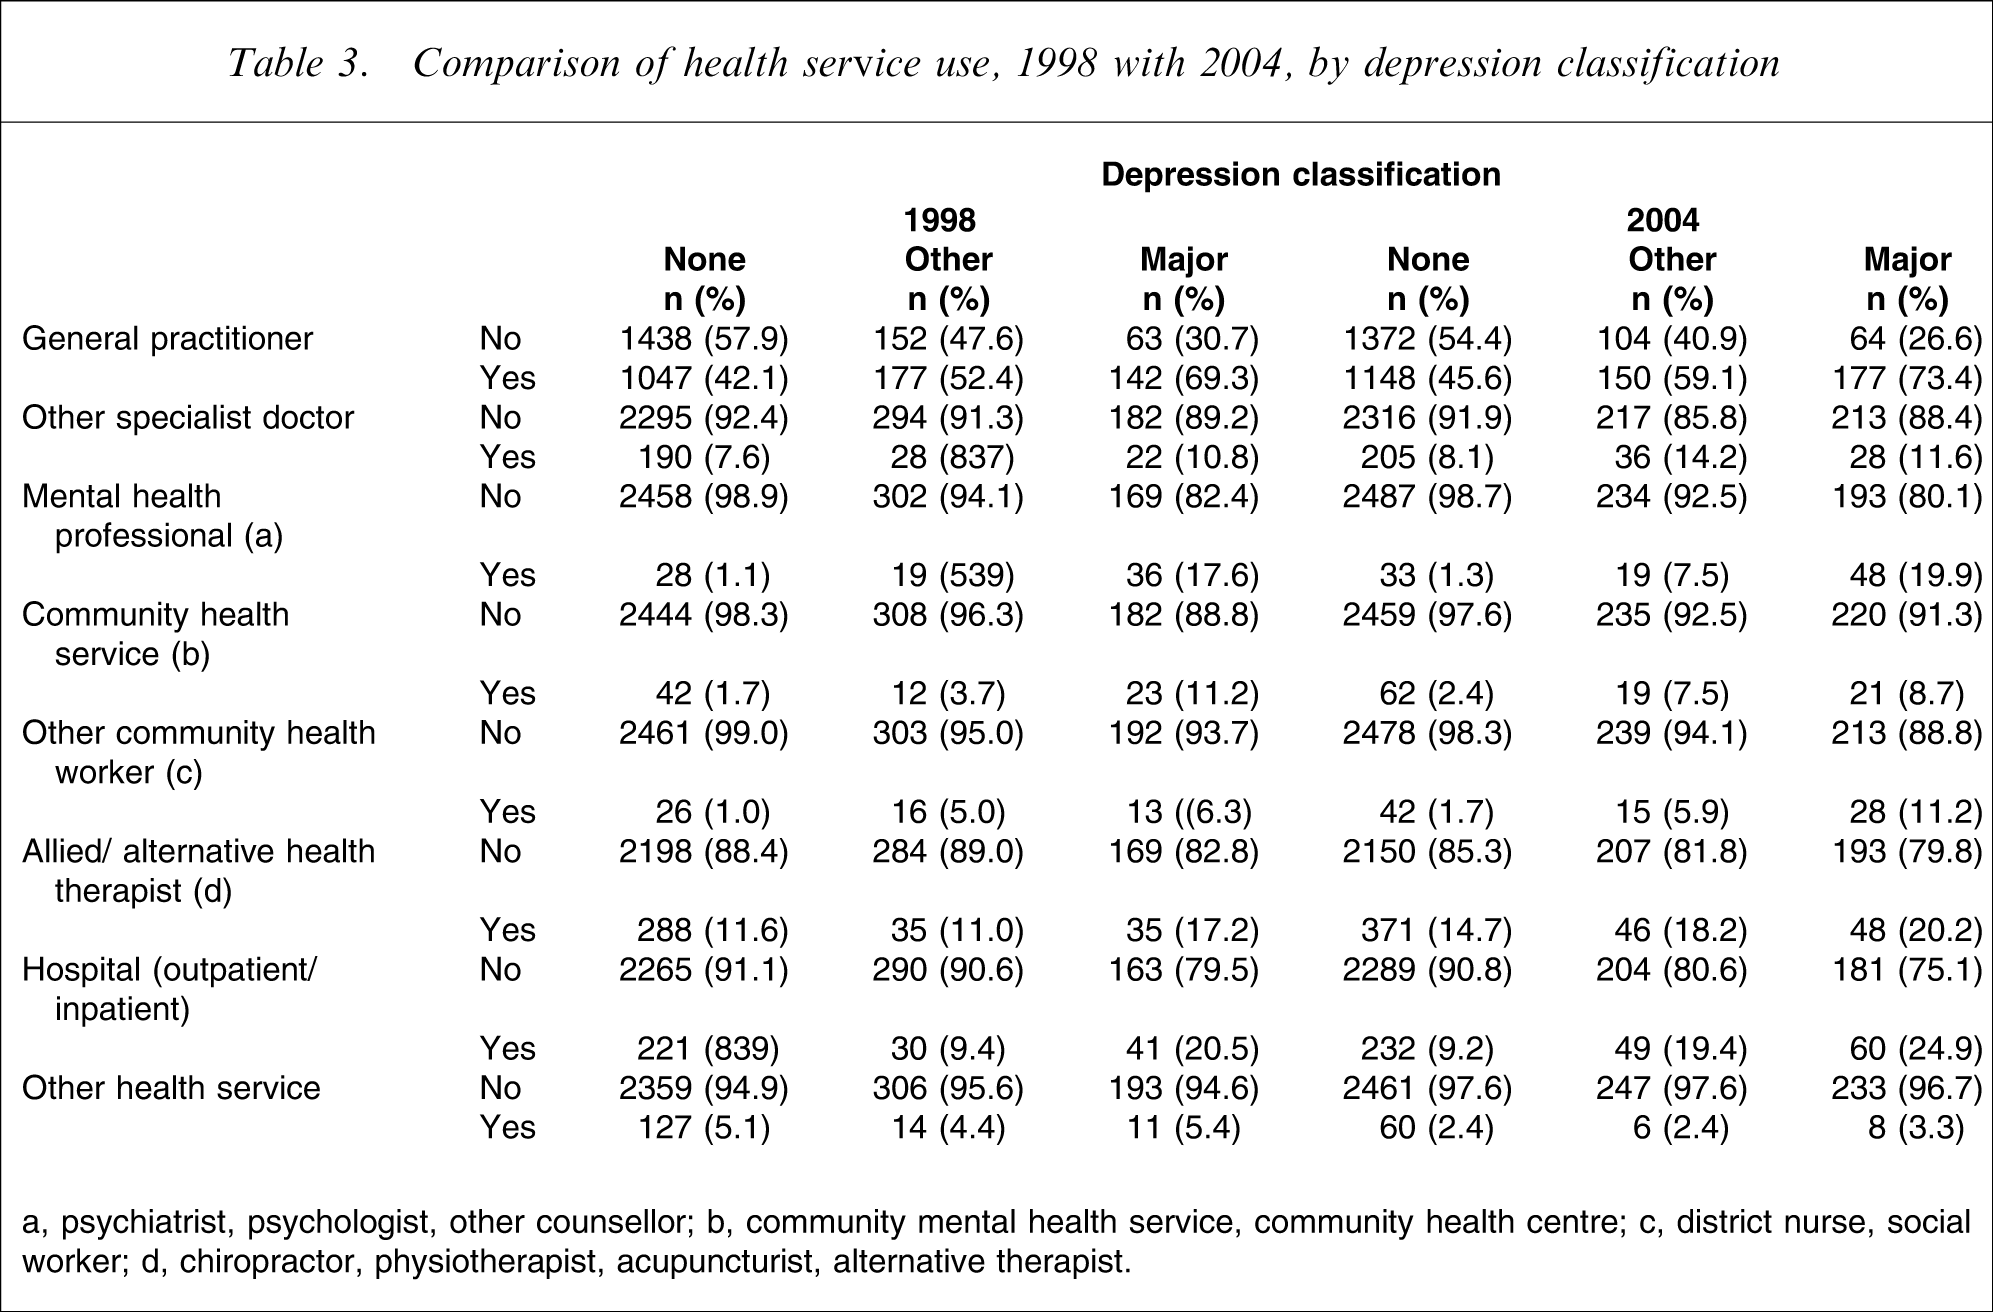
a, psychiatrist, psychologist, other counsellor; b, community mental health service, community health centre; c, district nurse, social worker; d, chiropractor, physiotherapist, acupuncturist, alternative therapist.
Comparison of health service use, 1998 with 2004, by depression status

∗Interaction between Depression and Year.
CI, confidence interval; OR, odds ratio.
a, psychiatrist, psychologist, other counsellor; b, community mental health service, community health centre; c, district nurse, social worker; d, chiropractor, physiotherapist, acupuncturist, alternative therapist.
Procedure: logistic regression, with denominator being no depression and no service use in 1998.
All analyses adjusted for gender, age, education attainment and relationship status.
For the use of GPs there was an increase of 13%, for other community health workers the increase was 73%, and for alternative health therapists it was 31%. This general increase in service use should be kept in mind when interpreting the findings in relation to depression classification.
When compared with those having no depression, those with other depression were 1.8-fold more likely to have visited a GP, fivefold more likely to have visited a mental health professional, twice as likely to have used a community health service, and 4.7-fold more likely to have visited another community health worker. Compared with 1998, those with other depression were significantly more likely to have visited medical specialists or used hospital services in 2004.
For those having major depression, when compared with those with no depression, they were more than threefold as likely to have visited a GP, 18-fold more likely to have visited a mental health professional, 6.6-fold more likely to have used a community health service, 5.5-fold more likely to have used another community health worker, 1.6-fold more likely to have visited an alternative health therapist, and 2.7-fold more likely to have used hospital services. Between 1998 and 2004, there was no statistically significant increase in the use of any of the health services reported by those with major depression.
The absolute number of health services used was also calculated. Because of the extreme data skew, the median number of services used was 1 in both 1998 and 2004. Health service use was dichotomized as 0/1 versus 2+ services used. Analysis of the data showed that compared with those with no depression, those with other depression were 1.7-fold more likely to report using 2+ services, and those classified with major depression were fourfold more likely to report 2+ service use. Between 1998 and 2004, there was a general increase of 44% in the likelihood of using 2+ health services. There was no significant interaction between depression classification and health service use (Table 5).
Comparison of health service utilization, days out of role and use of antidepressant medication, 1998 with 2004, by depression classification
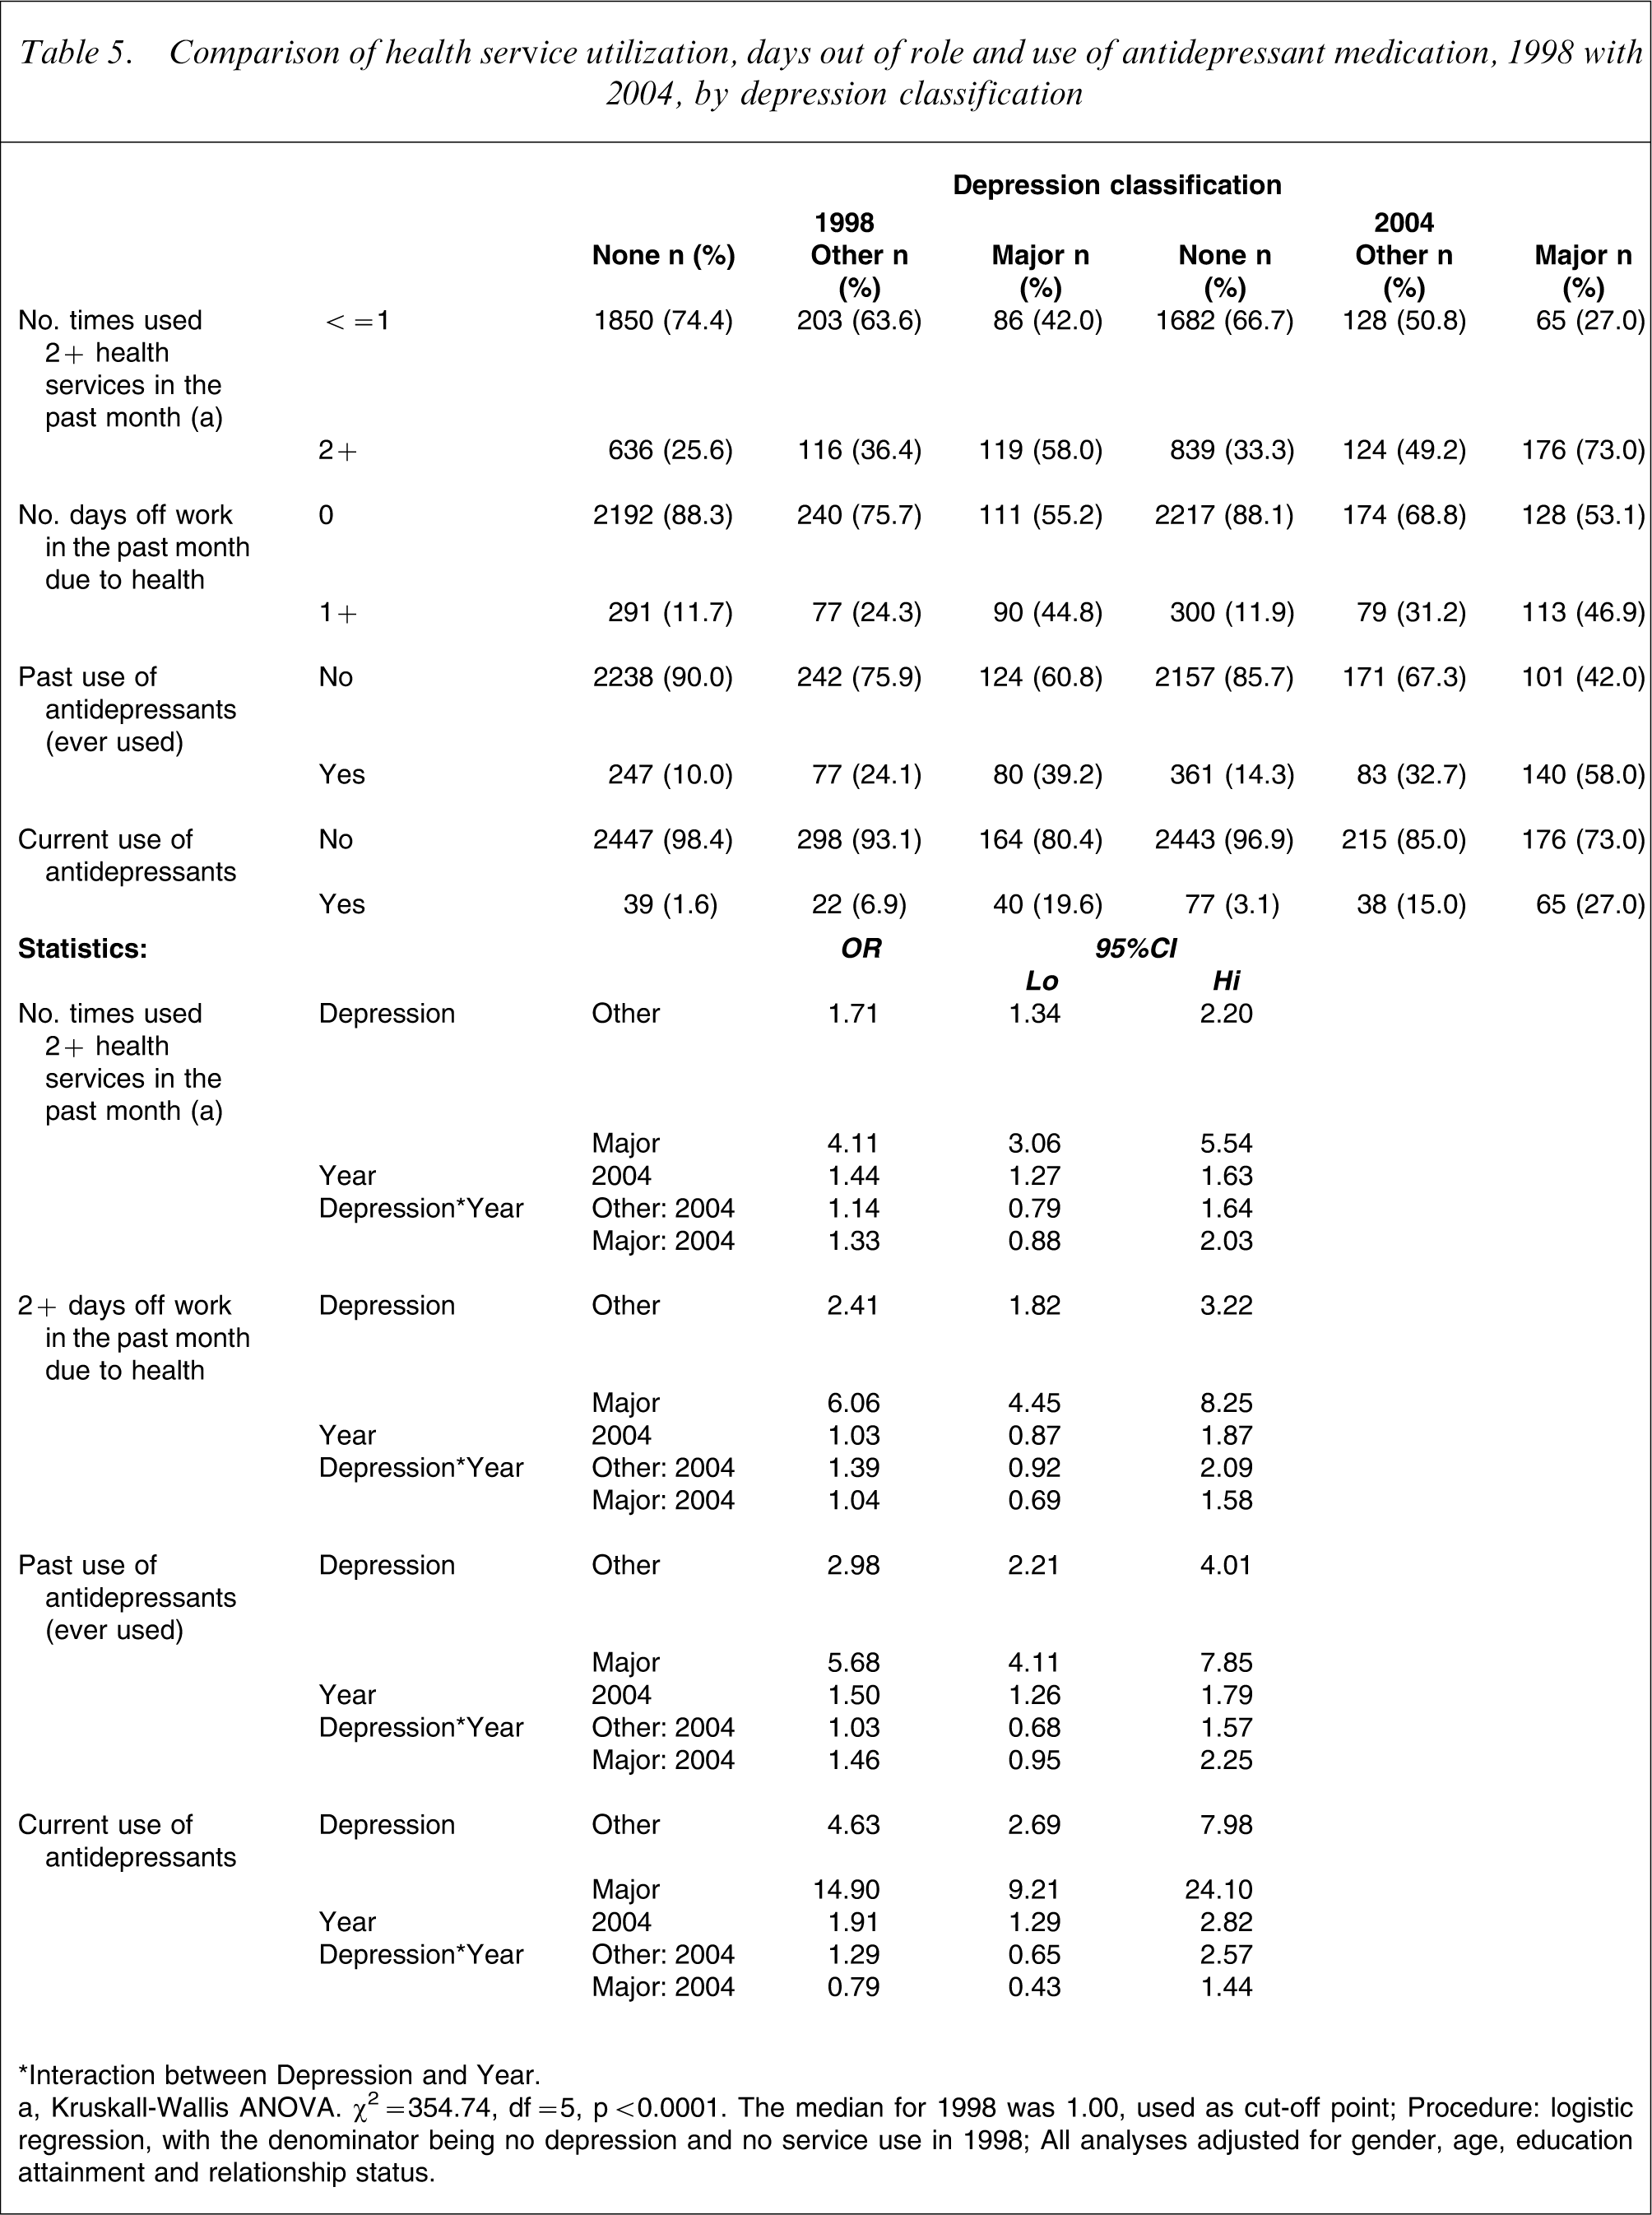
∗Interaction between Depression and Year.
a, Kruskall-Wallis ANOVA. ?2=354.74, df = 5, p < 0.0001. The median for 1998 was 1.00, used as cut-off point.
Procedure: logistic regression, with the denominator being no depression and no service use in 1998.
All analyses adjusted for gender, age, education attainment and relationship status.
Table 5 also shows days out of role and use of antidepressant medications. For days off work in the past month, dichotomized as 0/1 versus 2+ days, those having other depression were 2.4-fold more likely than those with no depression to report taking 2+ days off work, and those with major depression were sixfold more likely to do so.
Regarding the overall use of antidepressant medication, between 1998 and 2004 there was a statistically significant increase of 50% in the likelihood of reporting having ever used antidepressants and a 91% increase in the likelihood of reporting being on current antidepressant medication. There was, however, no significant interaction between depression status and consumption of antidepressant medication. Those with other depression were almost threefold more likely to report lifetime use of antidepressant medication compared with those with no depression, and those with major depression were 5.7-fold more likely to report this. Those with other depression were also 4.6-fold more likely to report taking antidepressant medication, and those with major depression were 14.9-fold more likely.
Assessment of Quality of Life
Overall, between 1998 and 2004, AQoL utility scores for the no depression group declined by 0.01 utilities (95%CI = −0.01 to −0.02) and for the other depression group by 0.02 utilities (95%CI = −0.01 to −0.06; ANCOVA: Model: F = 518.33, df = 1,2,3,5943, p < 0.0001; Year: F = 12.36, df = 1, p < 0.0001; Depression classification: F = 771.32, df = 2, p < 0.0001). For those with major depression there was no significant change in AQoL utility scores (95%CI = −0.06 to +0.04). None of the significant changes, however, reached the minimum important difference of 0.06 utilities reported by Hawthorne and Osborne [34].
Excess costs
Estimated annual excess costs for those with other and major depression, when compared with those with no depression, are presented in Tables 6 and 7. The excess costs have been attributed between costs borne by the health-care sector and those borne by the patient, as described in the methods section.
Estimated annual excess costs (AUD$) associated with depression, 2004: annual per case excess costs
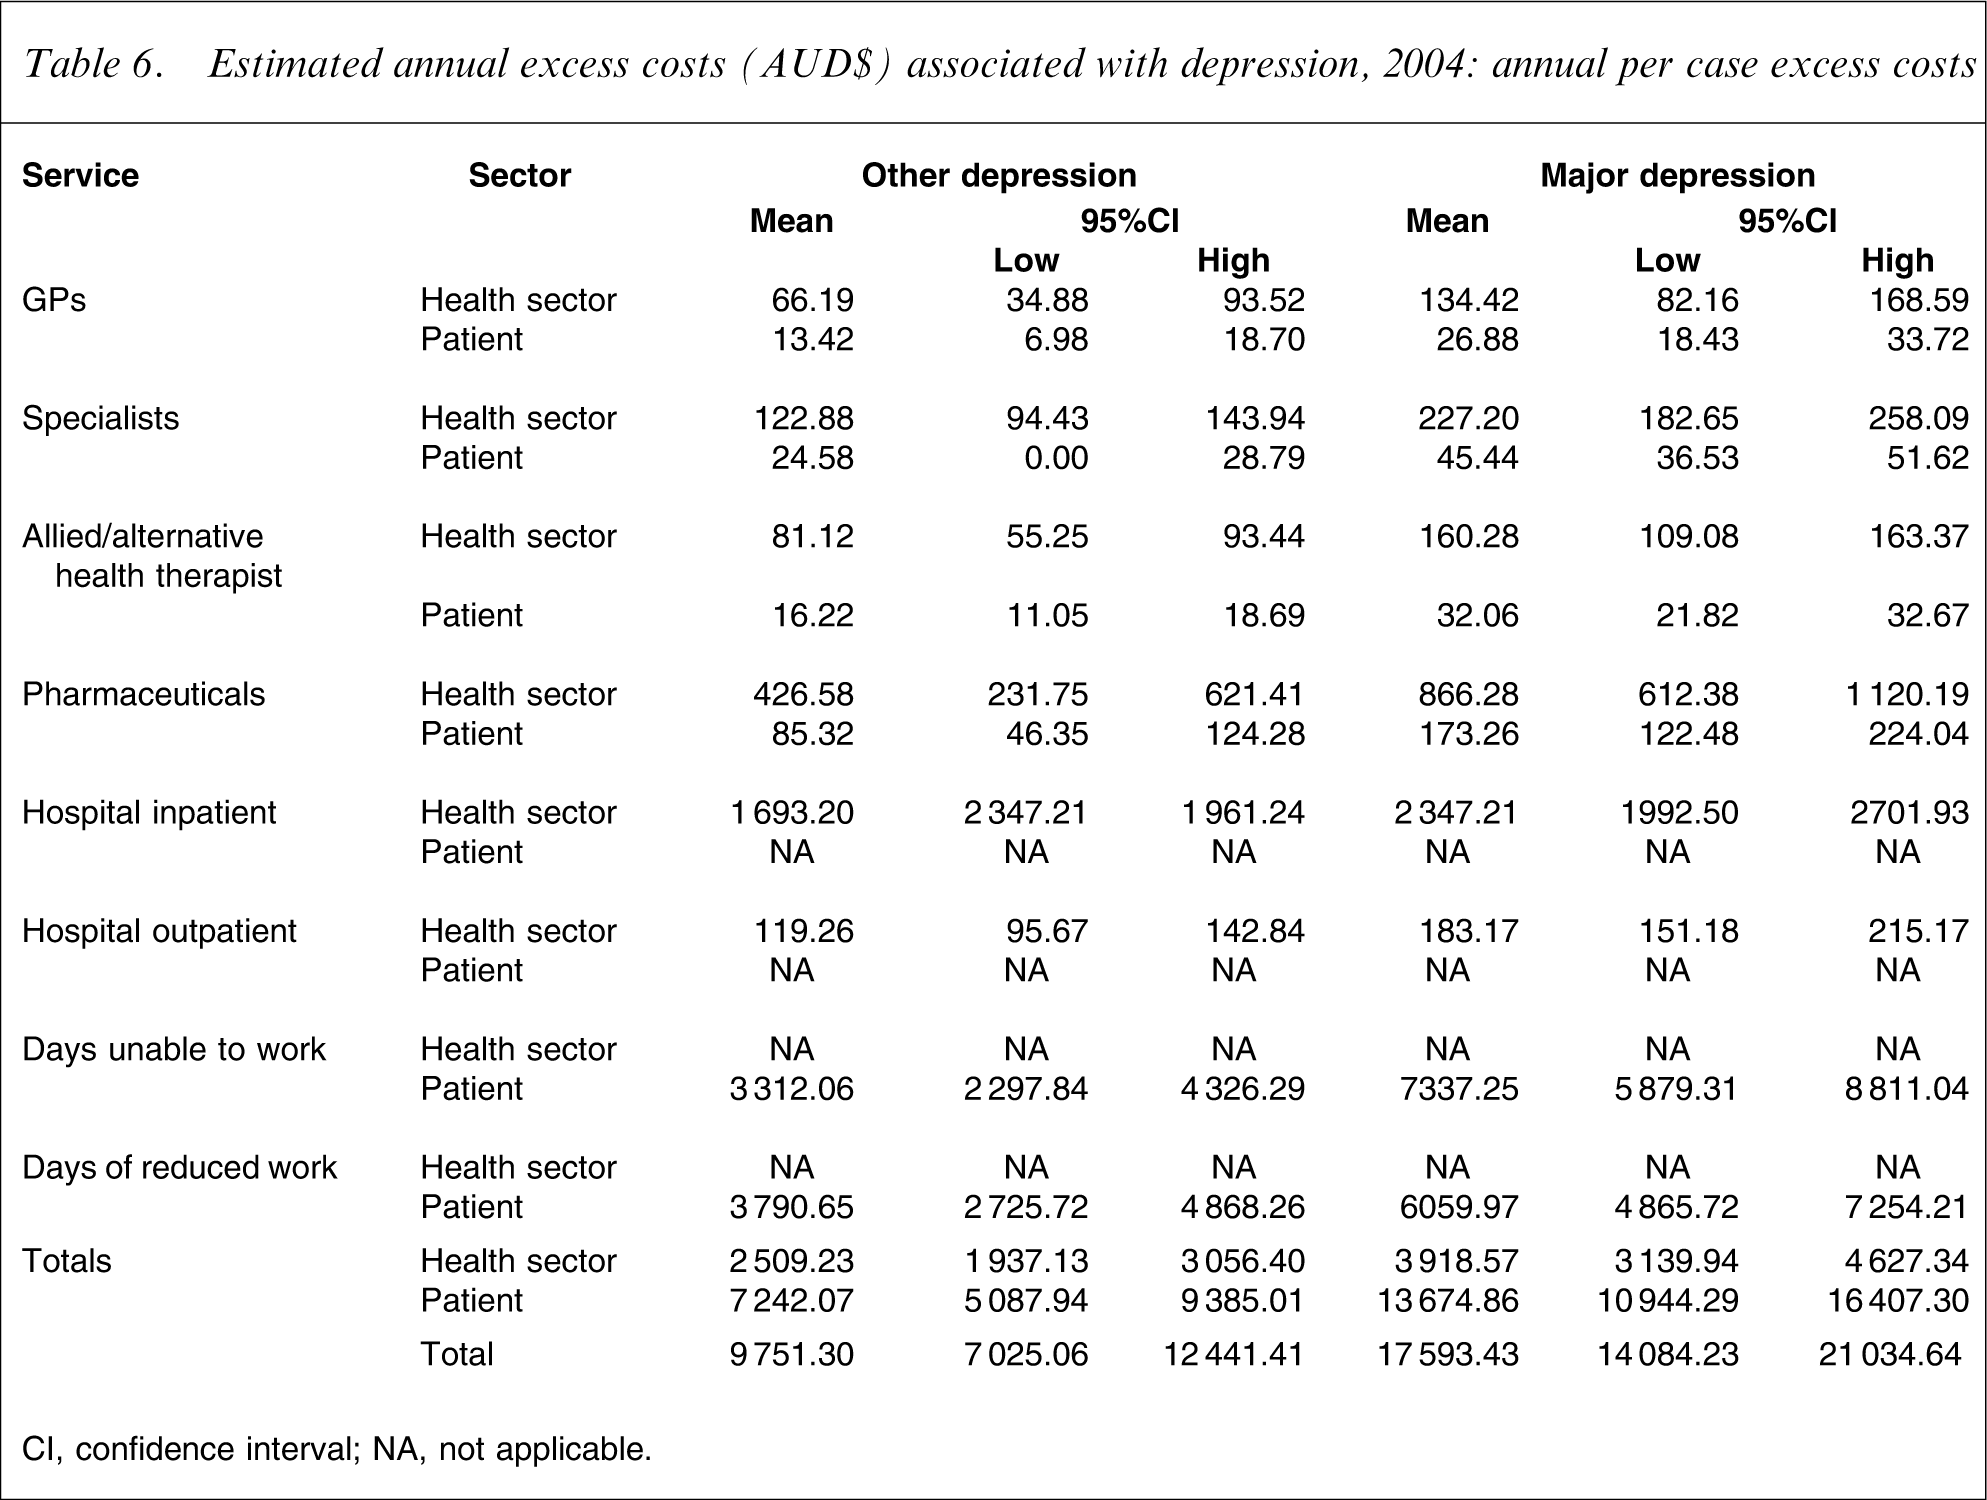
CI, confidence interval; NA, not applicable.
Estimated annual excess costs (AUD$) associated with depression, 2004: annual population excess costs
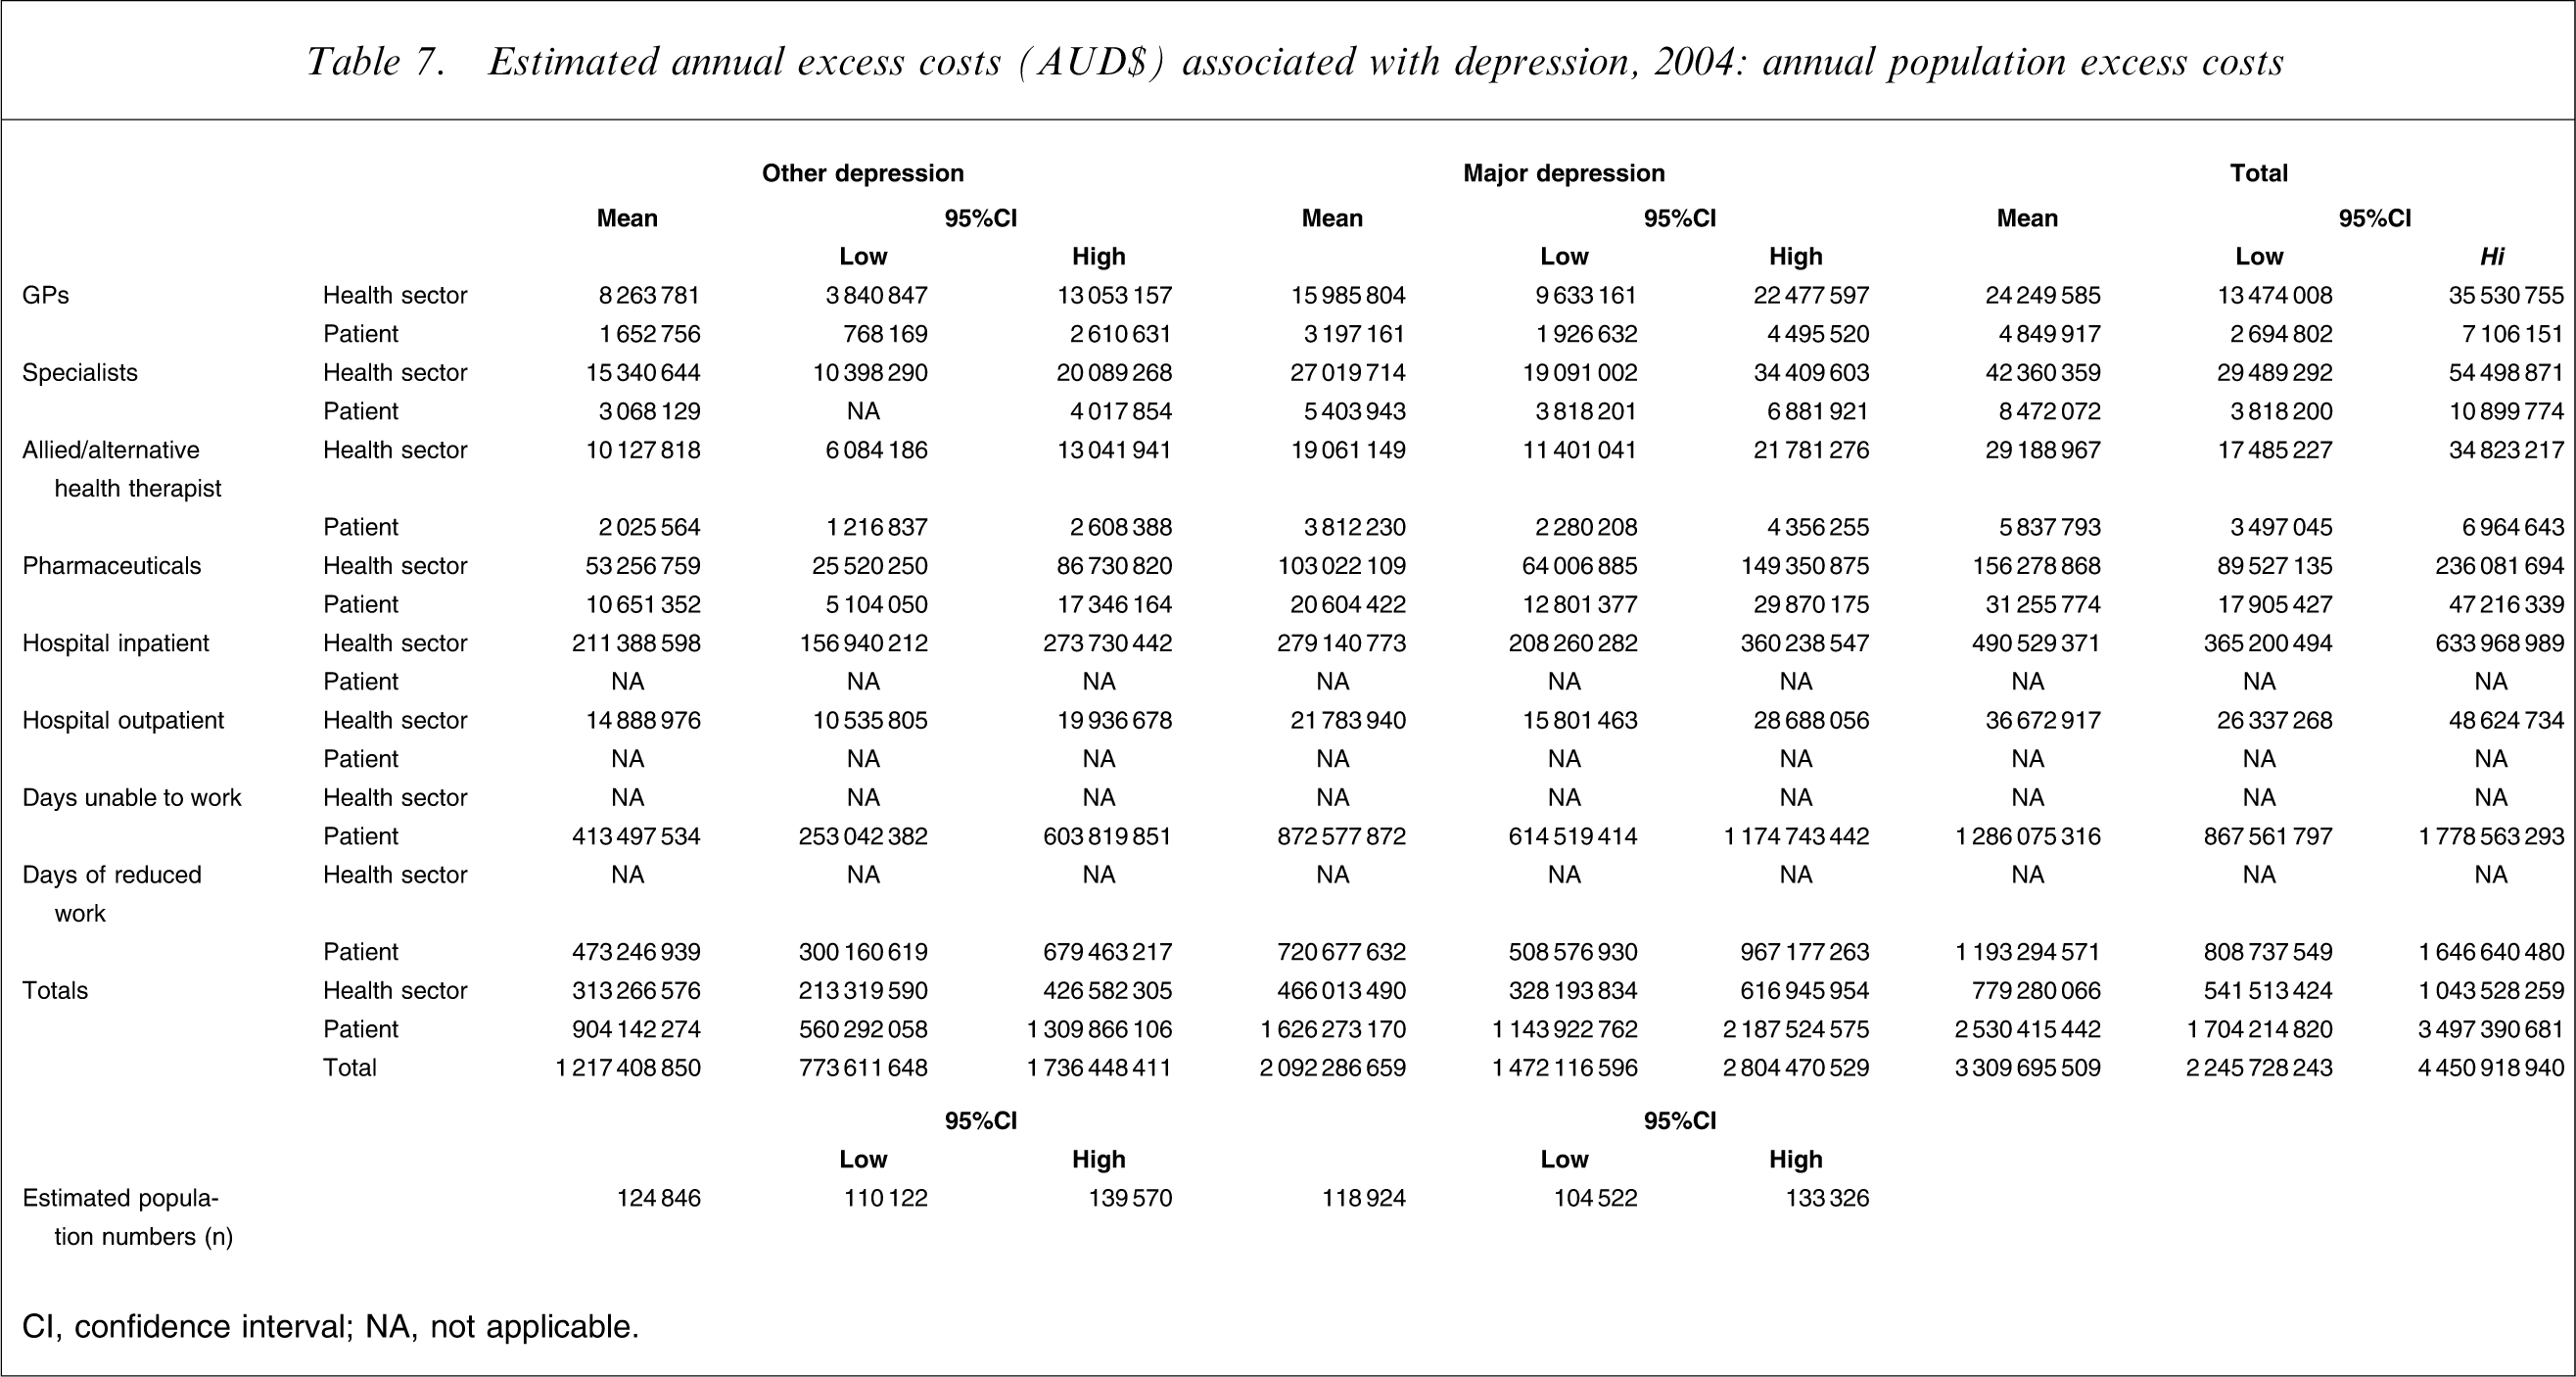
CI, confidence interval; NA, not applicable.
Table 6 presents the excess costs per case. The health-care sector excess costs for those with other depression were estimated to be AUD$2509 per annum per case, and for those with major depression, AUD$3919 per annum. Turning to personal costs, for those with other depression these were estimated at AUD$7242 per annum, and for those with major depression, AUD$13675 per annum. The total excess cost was estimated to be AUD$9751 for those with other depression, and AUD$17593 per annum for those with major depression.
Table 7 shows the per case excess costs extrapolated to the estimated population of those with other and major depression. For those with other depression, the population excess costs were estimated to be AUD$313266575 per annum in health sector excess costs and AUD$904142274 per annum in personal excess costs. For those with major depression, these costs were estimated to be AUD$466013490 and AUD$1626273170 per annum, respectively. Table 7 shows that the largest excess costs, for both those with depression groups, were days unable to work and/or days of reduced work, followed by hospital inpatient costs, pharmaceutical costs and specialist costs.
Excess costs for 2004 were compared with those previously reported by Hawthorne et al. for 1998 [18], which were adjusted to reflect changes in the Consumer Price Index [35]. The differences in estimated excess costs at the population level are presented in Table 8. For those with other depression, there was a significant increase in the costs of attending specialists, alternative health therapists, pharmaceutical use, hospital inpatient and outpatient services, and days unable to work. There were no statistically significant increases in costs for GPs, or days of reduced work. For those with major depression, there were significantly increased costs for using alternative health therapists and pharmaceuticals. There were no statistically significant increases in costs associated with the use of GPs, medical specialists, hospital services, days unable to work or days of reduced working.
Summary of estimated increase in CPI-adjusted excess costs (AUD$m) associated with depression, 2004 compared with 1998
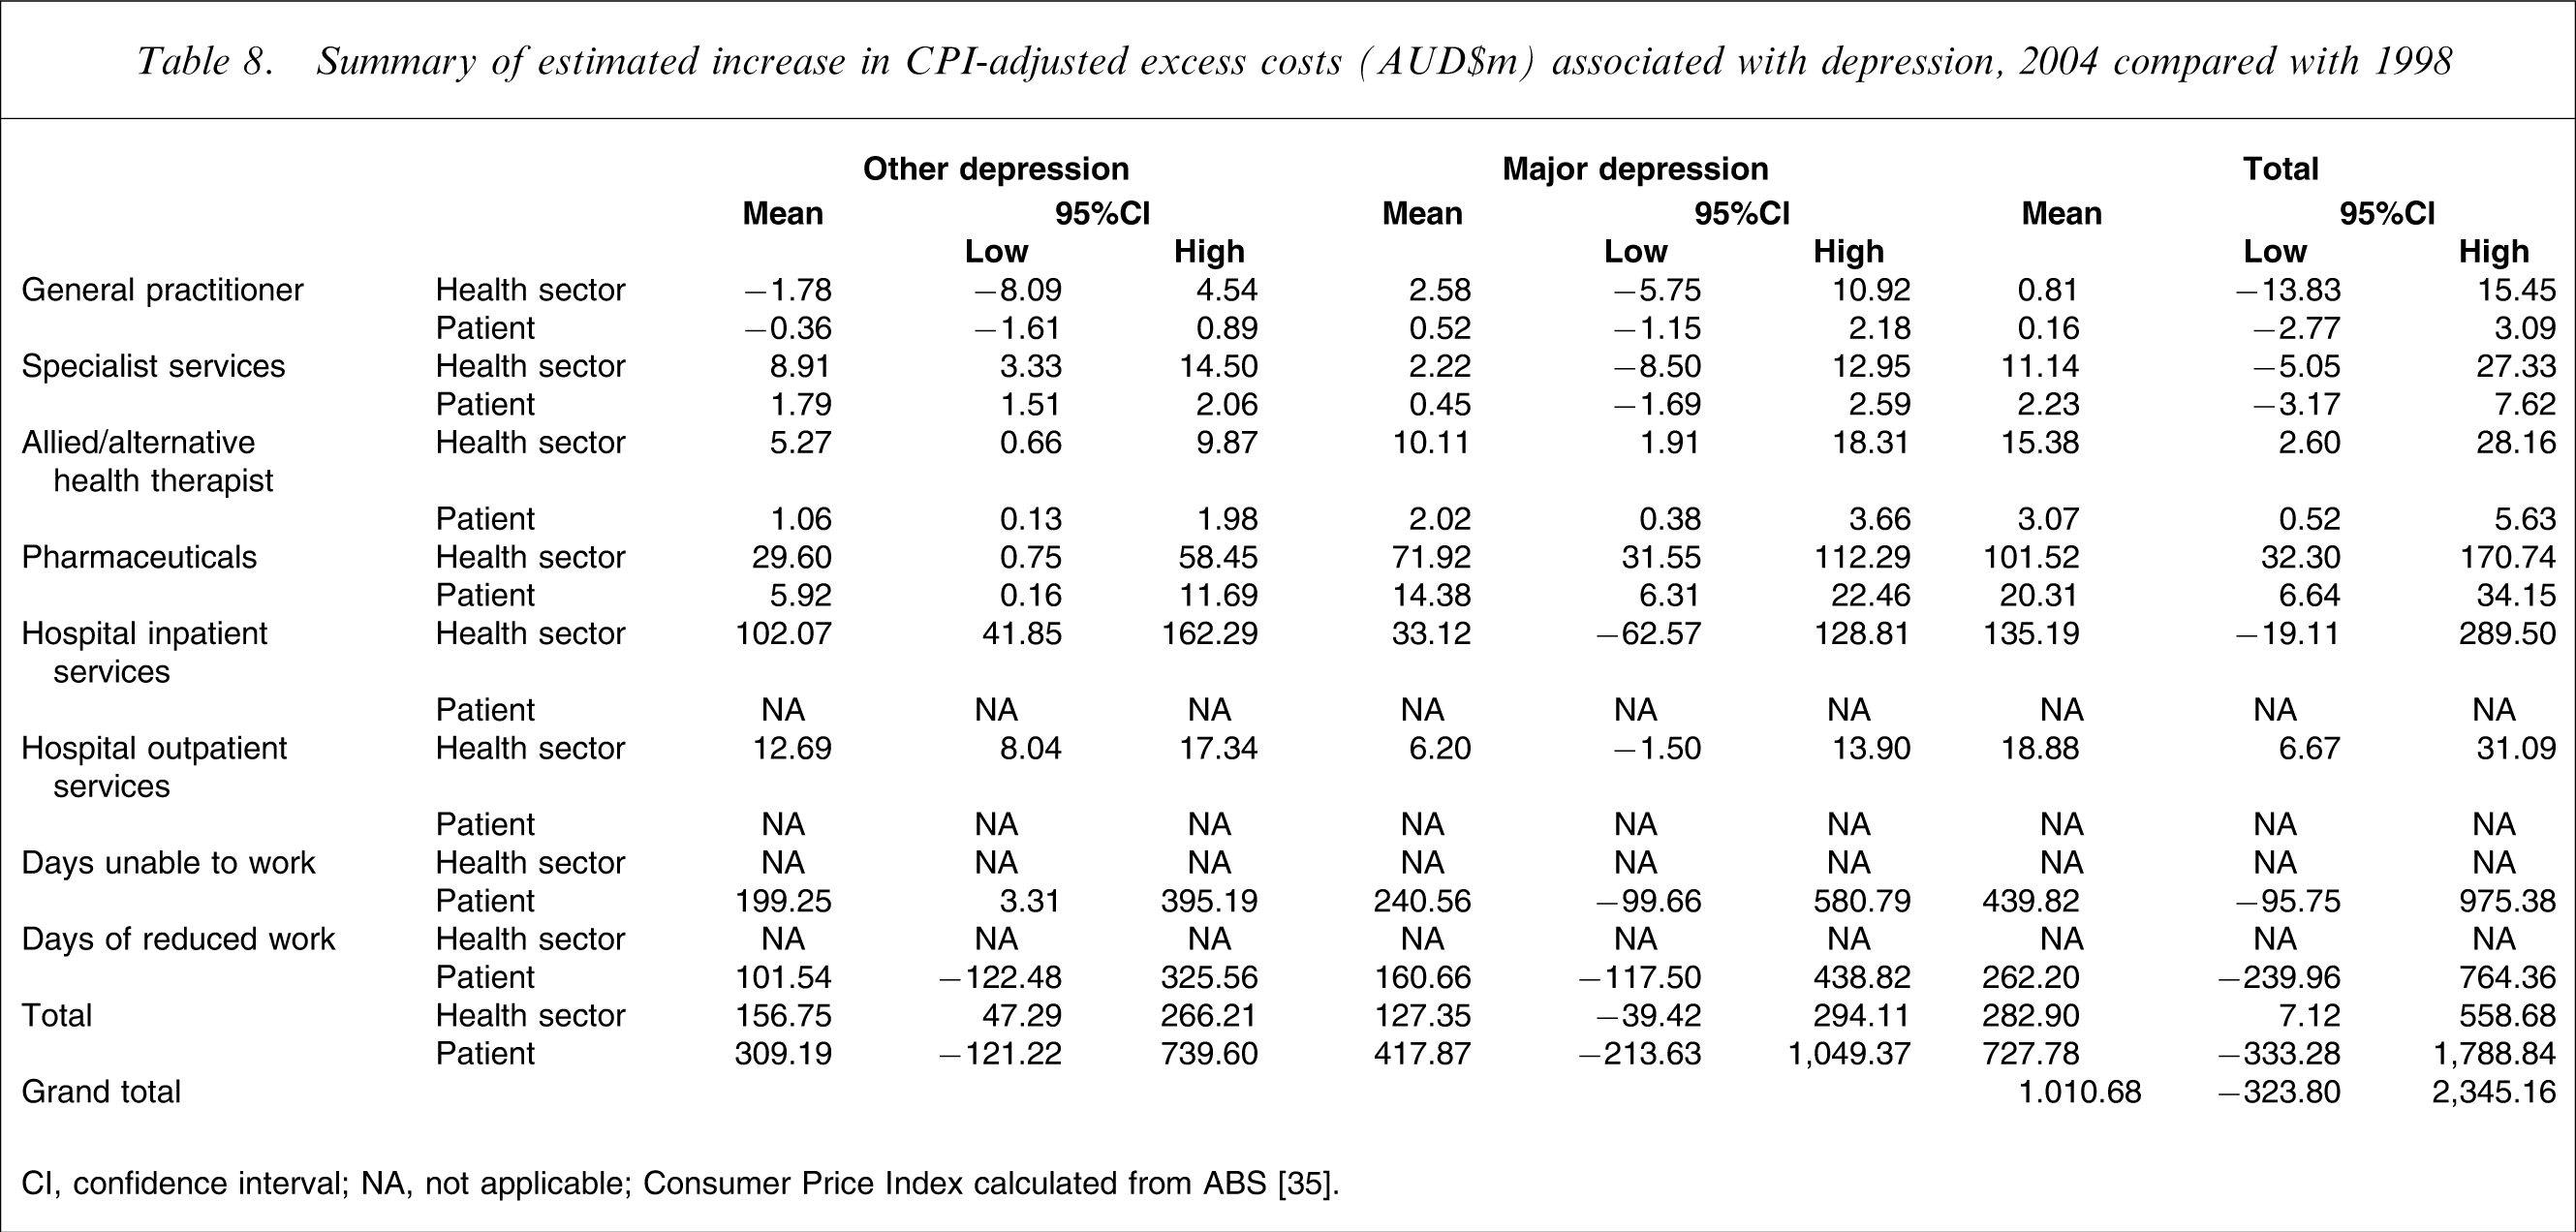
CI, confidence interval; NA, not applicable.
Consumer Price Index calculated from ABS [35].
Overall, however, the best estimate of increased excess costs for 2004 when compared with 1998 was AUD$1010.68m per annum, although it should be noted that the 95%CI suggested that this was a non-statistically significant difference when compared with excess costs for 1998 adjusted for CPI increases.
Discussion
There are a number of potentially important findings in this comparison of depression prevalence, its management and associated HRQoL and excess costs between 1998 and 2004. Although there was no significant change in the proportion of respondents with depression overall, there was a significant decrease in those with other depressions; a significant increase in the use of some treatment services; a significant decrease in QoL; and a non-significant increase in the excess costs associated with depression for some health services.
With regard to diagnosis, there was a significant shift in depression classification between 1998 and 2004, with fewer cases of other depression and more female than male respondents having major and other depression in 2004. Overall, however, there was no significant difference in the prevalence of depression in the community between 1998 and 2004. The fluctuation between the major depression and other depression diagnoses, and also the differences in gender, probably reflect the fluidity of symptoms of depression within patients over time [36, 37].
When the mean number of PRIME-MD depression symptoms were compared, there was no significant difference between the two time periods for those with major depression, whereas there was a significant decrease in the number of symptoms for those with other depression. Compared with the 1998 results, those with other depression in 2004 were less likely to report feelings of being tired or having low energy and feeling down, depressed or hopeless, while those with major depression were more likely to report feeling fidgety and restless. It is possible that these changes in symptomatology occurred by chance, bearing in mind the number of analyses undertaken. However, the decreases in the symptoms may be associated with the significant increase in antidepressant use as well as greater use of non-pharmacological services. It could also be argued that the increase in feeling fidgety and restless in those with major depression was related to side effects of antidepressants. However, a supplementary analysis of those with major depression showed no significant difference in reporting of being fidgety or restless between those who were on selective serotonin re-uptake inhibitor antidepressants (19 of 36), other antidepressants (20 of 31) or no antidepressants (95 of 174; χ2=0.32, df = 2, p = 0.85). Therefore, it is unlikely that antidepressant treatment can be implicated, and there appears to be no simple explanation of this finding.
It is of note that between 1998 and 2004 there were significant increases in the lifetime use of antidepressants (50%), and in the current use of antidepressants (91%). Because there was no significant interaction between depression classification and the use of antidepressant medication over time, the conclusion is that this increase was across the board. For the non-depressed, for example, the proportion reporting lifetime use of antidepressants rose from 39 cases in 1998 to 77 cases in 2004: a 97% increase, compared with a 73% increase for those with other depression and a 63% increase for those with major depression. The lack of impact at the community level of this increase in antidepressant prescribing is consistent with a recent report from Italy of no decline in first admissions for depression despite ‘dramatically increased’ use of antidepressants [38]. Clearly, the increased prescription of antidepressants alone has not been sufficient to influence depression prevalence at the community level. This raises the possibility that the increased use of antidepressants in 2004 was largely due to over-prescription, and adds weight to the observation of Mulder about ‘the medicalization of unhappiness’ [39].
With regard to the use of health services, there was a general increase of 44% in the use of all services between 1998 and 2004. Those with other depression or major depression were significantly more likely to be high health-care consumers when compared with those with no depression. Although there were increases in service use over time among those with other depression or major depression, neither of these interactions reached statistical significance.
When individual health services were examined, it was evident that there was a division between services provided by medical practitioners, including GPs and psychiatrists, and other therapists. For example, for those with other depression or major depression there was no statistically significant increase in use of any health service, other than increased use of hospital services. Yet, in general, there were statistically significant increases in the use of GPs, community health workers, and alternative health therapists. Possible reasons for this include changes in private health insurance, which, since July 2000, have subsidized non-medical treatments resulting in more persons seeking treatment from alternative practitioners. Although there is some evidence that more people also have reservations about traditional medical practice [40], this would not appear to be preventing people from accessing GPs. Indeed, between 1998 and 2004 there was an increased probability of visiting a GP of 13%.
Regarding respondents’ QoL, there were no significant improvements in between 1998 and 2004. Changes in AQoL scores for all study cohorts did not reach minimum important differences [34], even though there were statistically significant decreases for the non-depressed and those with other depression.
These overall results are disappointing considering the additional treatment services utilized in 2004 compared to 1998, and the improvements in mental health literacy in this SA community sample over this time period [16]. Changes in mental health literacy are not unexpected given the increased publicity noted previously, and when it is appreciated that one in five GPs have had additional training through the Better Outcomes in Mental Health Care initiative [41], and that no fewer than 385 of approximately 1700 SA GPs participated in a pharmaceutical industry-sponsored depression education programme between 1998 and 2004 (Meijborg C, McEwin S: personal communication). Indeed, it could be argued that greater mental health literacy allowed more respondents to recognize and acknowledge their symptoms of depression, leading to an increase in prevalence that may have been masked by the effect of increased treatments.
It could also be argued that but for the increased treatment of depression, and putting aside the issue of mental health literacy, there would have been an increase in the prevalence of depression in the community and an even greater financial burden. However, it is unlikely that this was the case, because there are no persuasive reasons why depression in the community should have increased in the study time period. Notwithstanding possible reasons for this lack of change, the present results do not support the view of Jané-Llopis et al. that ‘an 11% improvement in depressive symptoms can be achieved through prevention programmes’ [42], although it is fair to state that their conclusion was based on a meta-analysis of more focused small studies, rather than population data. However, the results are congruent with the views of Whitty and Gilbody, who reviewed the UK National Institute for Clinical Excellence (NICE) depression guidelines and concluded that ‘the implication is clear for the NICE depression guidelines: local publicity and educational events, audit of the guidelines and review by the Healthcare Commission will not be enough to help more people with depression get better’ [43].
We have also reported an enormous increase in excess costs to the community of those with depression. Thus, in 2004 the excess annual costs were estimated at AUD$9751 for those with other depression and AUD$17593 for those with major depression. When these costs were aggregated by the estimated number of cases in SA, the excess costs were AUD$1.22bn for those with other depression and $2.09bn for those with major depression, a total of AUD$3.31bn. The largest contributor to these costs was personal costs (loss of wages through days unable to work or days of reduced work), followed by hospital inpatient costs and pharmaceutical costs.
The 2004 total excess cost of depression of AUD$3.31bn was in contrast to the AUD$2.30bn (95%CI = AUD$1.5–AUD$3.2bn) CPI-adjusted excess cost of depression in 1998: an enormous increase of more than AUD$1.0bn, albeit not statistically significant. In 2004 there was increased use of pharmaceuticals, hospital clinic (outpatient) services and alternative health therapists. There were also large, non-statistically significant increases in loss of wages and use of hospital inpatient services.
These findings are in stark contrast to a US study that noted that ‘the economic burden of depression remained relatively stable between 1990 and 2000, despite a dramatic increase in the proportion of depression sufferers who received treatment’ [44]. It is pertinent that it is not possible to directly compare the two results because of different methodologies and time periods. However, the American 7% increase in costs is substantially lower than the 44% increase we report.
In this context it is germane that Sanderson et al. have asked ‘is evidence-based health care affordable?’, and in doing so they endorsed the use of evidence-based health care for affective disorders, predicting a cost-effective reduction in years lived with disability [45]. Notwithstanding methodological differences between the report of Sanderson et al. [45] and the present study, our QoL results do not offer evidence of a positive impact of various evidence-based education measures promulgated in SA between 1998 and 2004. Indeed, if one equates community publicity with consumer advertising, the present results could be interpreted as supporting the recent views of Kravitz et al. that such advertising may promote over-use of services [46]. Similar reservations have been expressed by Mason et al. in regard to the cost-effectiveness of expenditure on antidepressants [47], a view that would be consistent with the findings from this study, although a more optimistic view for both antidepressant and cognitive-behavioural therapies for depression has recently been expressed by Vos et al. [48].
The question could be posed of whether increased mental health literacy in the community [15, 16] has raised community expectations about the treatment of depression to a level that cannot be met. Indeed, this would be consistent with the views of Heath [49], as it may be that increases in mental health literacy lead to a greater perception of ill health, with consequent increases in health services consumption. Heath referred to investment in health care producing a J curve, where ‘for most of the curve, the more money spent, the better the health outcomes, but after a certain point, the more spending and the more emphasis on health at the expense of other areas of human activity and achievement, the worse overall health becomes’. This is also consistent with the acerbic comments of Sackett who wrote of the ‘arrogance of preventive medicine’ in promulgating measures whose outcomes were not supported by rigorous scientific studies [50].
Finally, it could be argued that the impact of broad national depression management initiatives was not felt in SA. However, we have demonstrated a significant increase in mental health literacy about depression in the SA population between 1998 and 2004 [16], and there has been the increase in educational activities of GPs [41]. It is also pertinent that we were not able to allow for the influence of possible broad sociopolitical influences, such as a change from a Liberal to Labour government at the State level [51], or the changing economic climate of Australia in general. Another possible influence is that changes in the provision of health care, with subsidies for private health insurance introduced in July 2000, may have led to greater utilization of allied and complementary health services. It is also fair to note that we have not allowed for the effects of comorbid conditions, but this was also the case in the 1998 analyses and therefore that should not affect the comparative results. Finally, it could be argued that the services for the provision of mental health care in SA have not been able to implement treatment strategies that in rigorous research settings have been demonstrated to be effective.
Methodological shortcomings in the present study should be acknowledged. The response rate was only 65.9%, similar to the 70.2% in 1998, although these figures are generally considered to be acceptable for studies of this nature. We also recognize that the present study underestimates depression prevalence and health service use and costs because those living in institutions would not have been sampled. In addition, we utilized the PRIME-MD, which was originally developed as a primary care screening instrument. However, the PRIME-MD questions directly reflect DSM-IV categorization of depression, and the prevalence detected was in the range of other community studies. It is also pertinent to note that the measures used to calculate the estimated excess cost of depression to the community are open to interpretation, and may not be directly comparable to other studies, although we endeavoured to make them consistent with our earlier published study [18]. It is also apparent that we do not know the specific treatments used, be they antidepressants with or without specific psychotherapies, and studies such as this cannot be used to detract from smaller randomized trials of focused treatments for depression.
Conclusions
There is increasing interest in demonstrating the overall effectiveness of interventions for psychiatric illnesses [52, 53]. However, Chisholm recently observed that ‘Remarkable as it may sound, no country to date has been able to clearly link mental health strategic policy or investment decisions to a credible, consistent and evidence-based assessment of what interventions actually work best and at what cost’ [53]. While it is reassuring that there are theoretical data derived from research settings that indicate that there should be improvements [4–7, 48], whether such improvements can be translated to the community as a whole has yet to be demonstrated. At the very least, the present results fail to do so.
This research should not be utilized as a reason to discontinue recent depression management initiatives. However, it serves as a caution to any quick fix of the problem, and to well-meaning statements by advocates of health promotion for improving the outcome of treatments for depressive conditions [54]. Furthermore, it presents a challenge to future similar surveys of depression and its associated morbidity in the community. Indeed, it is important that further similar surveys are conducted in order to monitor changes [55, 56], because it may be that sustained improvement occurs only with a generational 20year shift in community and professional awareness, and in administrative and clinical practices, rather than in the relatively short time period that is the focus of this study.
Footnotes
Acknowledgements
This study was supported by unrestricted grants from Eli Lilly Australia, Janssen-Cilag, Lundbeck Australia, Organon Australia, Sanofi-Synthelabo, Wyeth Australia, and Ramsay health Care Australia. None of these organizations participated in the design of the study or in the analysis and interpretation of data. Mr S. McEwin and Ms C. Meijborg of Pfizer Australia provided information about Sphere participants in South Australia. We thank Dr. I. Gordon, University of Melbourne, for statistical advice.