
Abstract
The spatiotemporal evolution of cerebral microcirculatory adjustments to functional brain stimulation is the fundamental determinant of the functional specificity of hemodynamically weighted neuroimaging signals. Very little data, however, exist on the functional reactivity of capillaries, the vessels most proximal to the activated neuronal population. Here, we used two-photon laser scanning microscopy, in combination with intracranial electrophysiology and intravital video microscopy, to explore the changes in cortical hemodynamics, at the level of individual capillaries, in response to steady-state forepaw stimulation in an anesthetized rodent model. Overall, the microcirculatory response to functional stimulation was characterized by a pronounced decrease in vascular transit times (20% ± 8%), a dilatation of the capillary bed (10.9% ± 1.2%), and significant increases in red blood cell speed (33.0% ± 7.7%) and flux (19.5% ± 6.2%). Capillaries dilated more than the medium-caliber vessels, indicating a decreased heterogeneity in vessel volumes and increased blood flow-carrying capacity during neuronal activation relative to baseline. Capillary dilatation accounted for an estimated ˜18% of the total change in the focal cerebral blood volume. In support of a capacity for focal redistribution of microvascular flow and volume, significant, though less frequent, local stimulation-induced decreases in capillary volume and erythrocyte speed and flux also occurred. The present findings provide further evidence of a strong functional reactivity of cerebral capillaries and underscore the importance of changes in the capillary geometry in the hemodynamic response to neuronal activation.
Keywords
Introduction
On the mesoscopic scale accessible by current neuroimaging techniques, such as positron emission tomography, functional magnetic resonance imaging (fMRI), and optical imaging of intrinsic signals, the vascular response to functional stimulation is spatially restricted and temporally locked to neuronal activity under a wide range of conditions (Kuschinsky and Wahl, 1978). Such remarkable coupling between neuronal and hemodynamic responses to stimulation enables brain function mapping via hemodynamically weighted signals. Nonetheless, the mechanism underlying this phenomenon, the range of spatial scales across which the neurovascular coupling is preserved, and hence a detailed understanding of fundamental limits on the spatial, temporal, and amplitude resolution of present neuroimaging methods are still unclear (Villringer and Dirnagl, 1995; Attwell and Iadecola, 2002; Lauritzen, 2005; Berwick et al, 2005). Specifically, little is known about the functional response of capillaries—the vessels most proximal to the activated neurons and the site of dilatory signal generation (Iadecola et al, 1997).
The superficial cerebral microvessels have traditionally been imaged using intravital (Hudetz, 1997; Schulte et al, 2003) or confocal (Villringer et al, 1994; Seylaz et al, 1999) fluorescence microscopy. Two-photon microscopy has more recently been employed to extend the imaged volume hundreds of microns deeper into the highly scattering brain tissue, thereby enabling the imaging of vessels closer to the epicenter of neuronal activation (Kleinfeld et al, 1998; Chaigneau et al, 2003; Hillman et al, 2007; Chaigneau et al, 2007). The assessment of the capillary response to functional stimulation in these investigations has been restricted to line scanning-derived measurements of RBC flux and velocity. Although line scanning necessarily results in under-sampling of the capillary network, statistically significant changes in RBC flux and velocity in some capillaries have invariably been observed.
On the other hand, stimulation-induced capillary volume changes have not been examined, although capillary dilatation in response to hypercapnia has been reported (Atkinson et al, 1990; Duelli and Kuschinsky, 1993; Villringer et al, 1994; Hutchinson et al, 2006). In these studies, the capillary caliber changes have been assessed via changes in the apparent distance between the vessel boundaries in either single slice or maximum intensity projection images at a single point along the vessel under baseline and hypercapnic conditions. However, these estimates are clearly confounded by the vessel architecture and the geometry of the evoked volume changes. Indeed, morphological data suggest pronounced heterogeneity of vessel diameter changes along the longitudinal microvessel axis, evidenced by the discontinuous perivascular strips formed by smooth muscles on small arterioles, the dependence of the perivascular strip distribution and size on vessel caliber, and the discontinuities in the pericytic processes along the capillary walls (Rodriguez-Baeza et al, 1998; Peppiatt et al, 2006). Furthermore, of particular importance for studies of functional reactivity of the microvasculature, stimulation-induced changes in capillary diameter have exhibited strong heterogeneity along the vessel length in situ (Peppiatt et al, 2006).
In the present work, we sought to investigate the microvascular response to functional brain stimulation in further detail. Given the aforementioned work and the recent evidence for stimulation-induced capillary flow regulation (Peppiatt et al, 2006), we postulated that cerebral capillaries exhibit a strong response to functional stimulation in vivo. Our prior study of capillary reactivity to a CO2 challenge indicated a large heterogeneity in capillary perfusion that was decreased during mild hypercapnia, with smaller capillaries dilating more than larger capillaries (Hutchinson et al, 2006). Here, we hypothesized that neuronal activation, likewise, reduces the resting heterogeneity in microvascular calibers. To allow the interpretation of the current data in the broader context of neuroimaging studies, we used an electrophysiologically well-described paradigm (Matsuura and Kanno, 2001; Ureshi et al, 2005) that is frequently employed in fMRI and optical imaging (Hyder et al, 1994; Spenger et al, 2000; Ances et al, 2001; Sheth et al, 2003) and focused on steady-state rather than transient responses. We employed intracranial electrophysiology and bolus tracking for region of interest validation. Furthermore, bolus tracking enabled estimation of the total change in the regional blood volume. We measured the stimulation-induced changes in the volume of individual vessels, in addition to RBC speed and flux, to extend the characterization of the microvascular hemodynamics, allow the assessment of the capillary contribution to the total blood volume change, and overcome the potential limitations of the point diameter estimates.
Materials and methods
Animal Preparation
Experiments were conducted on 15 male adult Sprague-Dawley rats, weighing 120 to 250 g. During the surgical procedures, the animals were anesthetized with isoflurane (5% for initial induction and 2% for maintenance) in O2-enriched medical air, orally intubated, and mechanically ventilated for the remainder of the experiments. The right femoral artery and the right femoral veins were cannulated using PE-50 catheters for blood gas analysis and intravenous administration of anesthesia and fluorescent agents, respectively. Stereotaxic surgery was performed to prepare a small (˜5mm diameter), closed (1% agarose) cranial window over the forelimb representation in the primary somatosensory cortex (˜3.5mm lateral to bregma). Rectal temperature was monitored via thermistor rectal probe and maintained at 37.0°C ± 1.0°C via a low-voltage DC proportional controller using a resistive heating blanket (CWE Inc., Ardmore, PA, USA). Isoflurane was discontinued and anesthesia switched to α-chloralose (80 mg/kg initial bolus, followed by a constant infusion of 26.7 mg per kg per h) for the remainder of the experiment. Pancuronium bromide was administered as a 2 mg/kg bolus (1 mL/kg) every 45 mins to minimize residual motion. Respiratory parameters, including end-tidal CO2 levels, were monitored via a capnograph (BCI 300 Capnocheck, BCI Inc., Waukesha, WI, USA). Blood gases were periodically sampled and adjusted, as needed, to ensure physiological stability throughout the experiments. Rectal temperature, tidal pressure of ventilation, arterial blood pressure, and heart rate were monitored and recorded using a BIOPAC MP system (Biopac Systems Inc., Goleta, CA, USA) throughout the experiments: data recorded when temperature, blood pressure, or heart rate was outside of the physiological range were excluded from the analysis. The functional paradigm comprised electrical stimulation of the forepaw in 90 sees off/60 sees on/90 sees off blocks, with each 60-sec stimulation interval made up of 180 0.3-ms, 2-mA pulses, given a frequency of 3 Hz. All measurements were commenced 30 sees after the change in the stimulation state to ensure steady-state conditions.
Electrophysiology
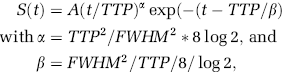
To provide electrophysiological description of the functional response with high sensitivity and specificity but without compromising the local vasculature, we recorded somatosensory evoked potentials (SEPs) intracranially. Specifically, three burr holes, 0.3 mm in diameter and < 1mm in extent below the skull, were made via a hand-driven drill, over left and right forelimb areas of the primary somatosensory cortices (S1FL), ± 3.5 mm lateral to bregma, as well as at the midline of the cerebellum, ˜10mm posterior to bregma (for the reference electrode). A 100-μm-diameter platinum electrode was inserted into each of these holes (tripolar recording electrode, Plastics 1, Roanoke, VA, USA), with the tip of each wire in the epidural space, so that no damage was made to either dura or the cortex. The use of tripolar electrodes allowed the recording of differential voltage between left and right S1FL areas, with the cerebellum as the reference. Using a BIOPAC MP150 system (Biopac Systems Inc., Goleta, CA, USA), the SEPs were amplified 20,000-fold, band-pass filtered between 0.5 and 500 Hz, digitized at a sampling rate of 2.5 kHz, and transferred to a computer.
In each subject, the SEP recording over the latter 30 sees of the 60-sec stimulus on period was averaged, locked to the time of each 2-mA, 333-μs pulse presentation, to arrive at the mean SEP trace describing the neuronal response to forepaw stimulation at steady state. The standard deviation on this average trace was used to gauge the stability of the electrophysiological response to stimulation.
Two-Photon Laser Scanning Microscopy
Two-photon microscopy was performed using a BioRad Radiance 2100 MP TPLSM (BioRad Cell Science, Hercules, CA) or Zeiss LSM Meta 510 microscope (Carl Zeiss MicroImaging, Thornwood, NY) (Ti: Sapphire fs pulsed laser; Λex = 805 nm; using 10 × 0.3NA or 20 × 0.5NA water immersion objectives). Emitted fluorescence was detected with a PMT using a 620/100 nm band-pass filter (BioRad) or 560 nm long-pass filter (Zeiss). Two 150 to 300 μL boluses (5 mg/mL in phosphate-buffered saline) of rhodamine-labeled dextran (70,000 MW) were administered intravenously.
Three types of acquisitions were performed. To measure the vascular transit time, the bolus passage was tracked by acquiring a time series of a single 1,024 × 1,024 μm2 imaging slice, about 150 μm below the cortical surface, at 225 ms per frame and with a spatial resolution of 8.0 × 8.0 μm. To estimate vessel volume, we obtained a stack of high-resolution images: 60 to 70 slices at 1 to 2 μm nominal lateral resolution and 1.5 to 3 μm axial step. Finally, to track RBC flow, line scans were acquired along the longitudinal axis of selected capillaries at 1.5 to 2 ms per line. Each recording was performed during both baseline and stimulation (in randomized order) and commenced after at least 30 sees of a given functional state, to ensure steady-state conditions.
Two-Photon Data Analysis
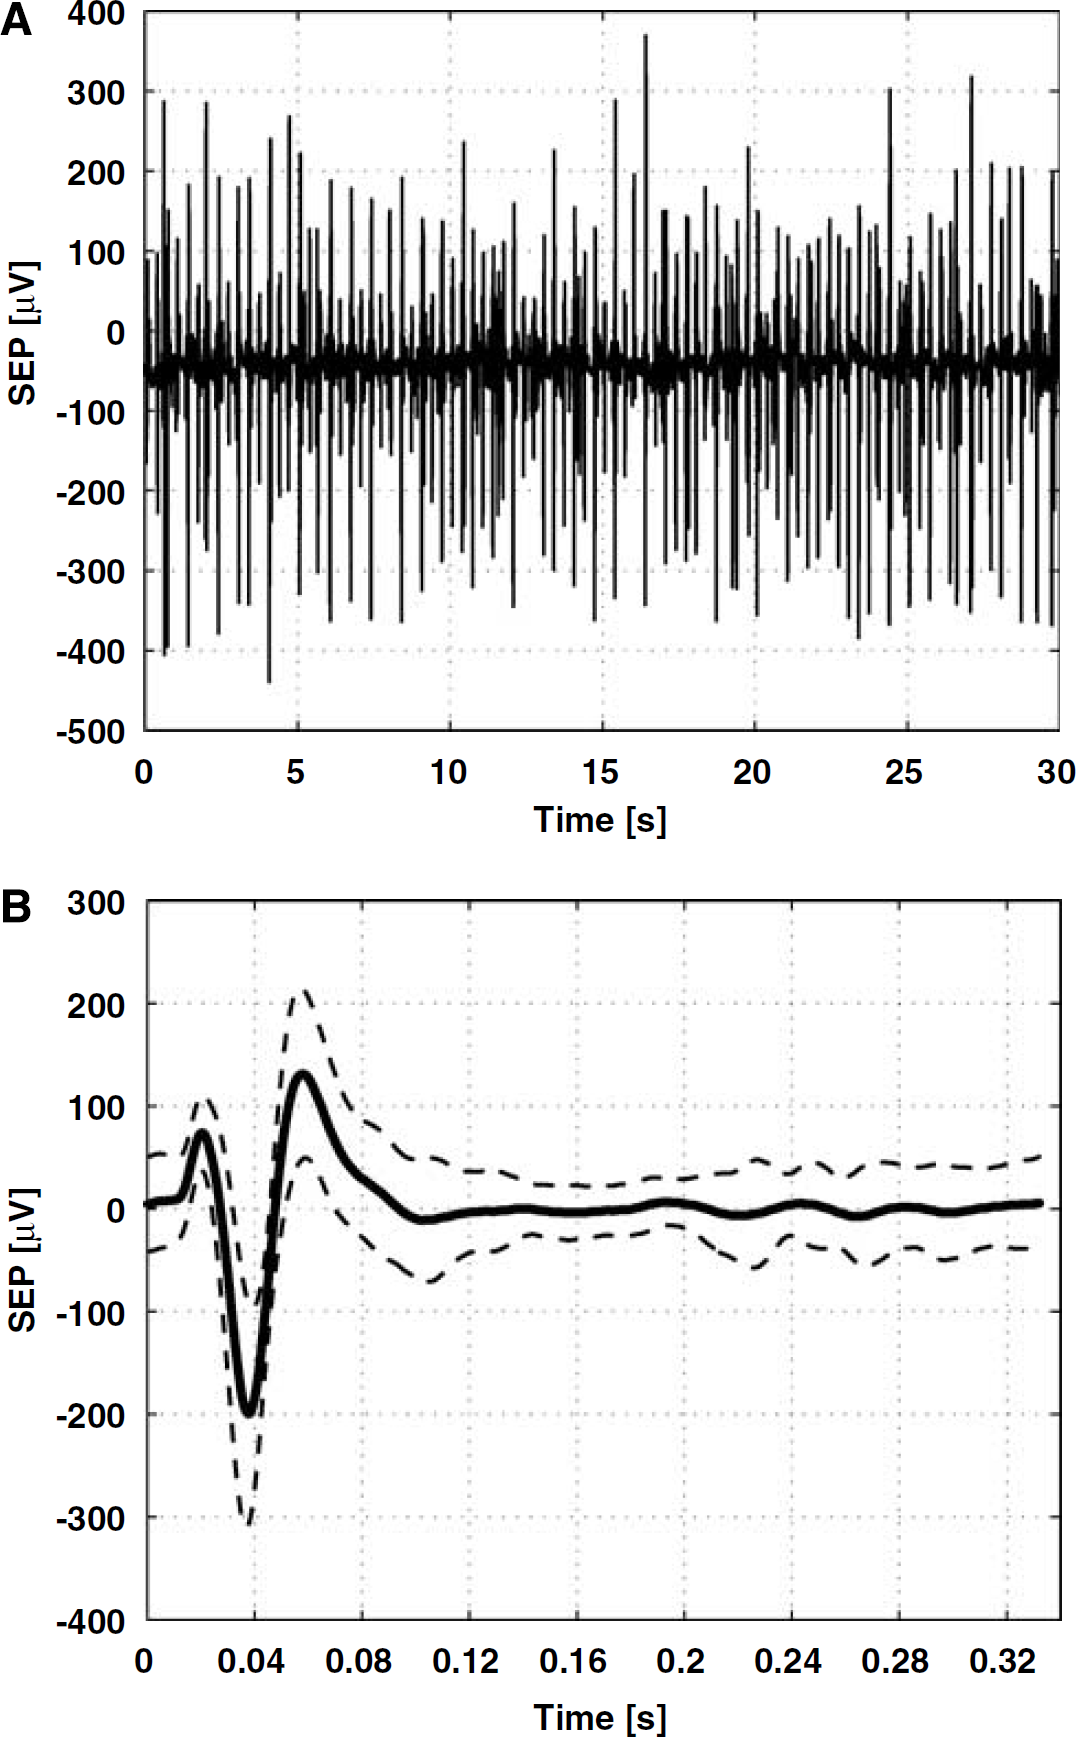
Transit Time Measurements: The bolus data series were low-pass filtered (with a Gaussian kernel, δ x,y = 2δ x,y ) and coarsely segmented into extra- and intravascular spaces. Voxel-wise nonlinear least squares optimization (based on the interior reflective Newton method) was performed in the intravascular voxels (subsampled by a factor of 3 to reduce the computation time) to fit a standard gamma variate function, while modeling the baseline drift. The signal intensity in each voxel was thus fit to
where A is a scaling constant, TTP is the time to peak, FWHM is the full-width at half-maximum, and t is the time. The time to peak parameter estimate from this analysis was normalized to bolus time arrival in the imaged slice so as to produce estimates of vascular transit times.
Vessel Blood Volume Measurements: The z-stacks underwent exponential correction for depth intensity attenuation and were low-pass filtered using a 3D Gaussian kernel (δ x,y,z = 3δ x,y,z ). Semiautomated segmentation of both baseline and activation stacks was performed based on the region growing from manually defined seeds in each vessel that was fully enclosed in the acquired stack under both resting and activation conditions (i.e., vessels for which branches at both ends were clearly identified during both baseline and stimulation). Given the limited extent of the imaged stack, this criterion necessarily led to elimination of all macrovessels. To enable comparisons with literature data and rough vessel categorization at rest, we also performed single point diameter estimates on the segmented vessels. Briefly, the signal profile along the normal to a local tangent to each segmented vessel in the maximum intensity projection image was fit to a Gaussian function, and the corresponding estimate of full-width at half-maximum was used as a measure of the vessel diameter.
RBC Velocity Measurements: The line scan data were filtered using a 5 × 5 median filter followed by low-pass Gaussian filtering. Thereafter, the average RBC speed during each 150 to 200 ms of line scan data was estimated according to a previously described algorithm (Kleinfeld et al, 1998). In short, the line scan data sections were incrementally rotated and singular value decomposition performed on each rotated image until the rotation angle (αmax) resulting in the maximum first singular value had been identified. The average RBC speed for the given line scan data was then estimated as

where X is the length of the line scan along the capillary (typically ˜30 to 50 μm) and τ is the temporal extent of the current window (i.e., 150 to 200ms).
RBC Labeling
Because line scanning as a way of estimating RBC speed requires that a single vessel be interrogated at a time, the data acquisition efficiency is poor, limiting the number of repeated measurements that may be made in a given vessel. To investigate the RBC flow in a network of capillaries at a time, we performed standard intravital fluorescence microscopy of the superficial vasculature using ex vivo-labeled erythrocytes. Specifically, ˜1 mL of whole blood was obtained from a donor rat and the erythrocytes were labeled using the PKH67 Green Fluorescent Cell Linker kit (Sigma-Aldrich, Saint Louis, MO, USA) according to the manufacturer's instructions, suspended in phosphate-buffered saline, and injected the next day. In preliminary in vitro experiments, we have observed fairly uniform labeling of more than 90% of erythrocytes, with minimal dye leakage for injections performed at least 12 h after labeling. The fluorescently labeled RBC (FRBC) suspension was injected intravenously in tracer quantities to produce ˜4% to 5% labeled cell population.
Intravital Fluorescence Microscopy
A 100-W mercury vapor short-arc lamp was used for excitation, and a 20 × 0.5NA objective was employed to image the labeled RBC passage through a network of superficial capillaries (within ˜40μm of the surface) at both rest and during forepaw stimulation, employing the same functional paradigm as described above. The 10242 512 × 512-μm2 images were acquired at 30 to 60 frames/sec using a CCD camera (DALSA Pantera TF 1M60, DALSA, Waterloo, ON, Canada) mounted on the LSM Meta 510 microscope.
For all vessels exhibiting a single file FRBC flow and hence labeled as capillaries, line profiles were drawn perpendicular to the local vessel orientation. From these profiles, the fluorescent cell passage times were identified and FRBC flux (defined as the number of FRBC passing through the capillary per unit time) was estimated during both rest and activation. The FRBC flux data were subsequently binned into 1-sec intervals and temporal variation in the flux examined during each condition. Finally, the changes in the FRBC flux between the two conditions were estimated for all capillaries imaged.
Results
We observed no statistically significant changes (P > 0.05) in any of the physiological parameters monitored with either stimulation or fluorescent dextran administration and found no evidence for an anaphylactoid reaction to the fluorescent dextran administration in any subject. The somatosensory evoked potentials were composed of three major components: an early small positive peak (P1), followed by a strong negative peak (N1), and another positive peak (P2). The SEP recording over the latter 30 sees of the 60-sec stimulation period, in the typical subject, is displayed in Figure 1A. The corresponding mean SEP trace, along with the standard deviation, is shown in Figure 1B. While the signal-to-noise ratio of the raw EEG recording after a single 333-μS pulse prevented reliable pulse-wise estimation of peak amplitudes, the SEP recording clearly indicated a sustained neuronal response throughout the stimulation period.
SEP recording over the latter 30-s period of the 60-s stimulation interval (containing 90 333-μs pulses) in a typical subject (
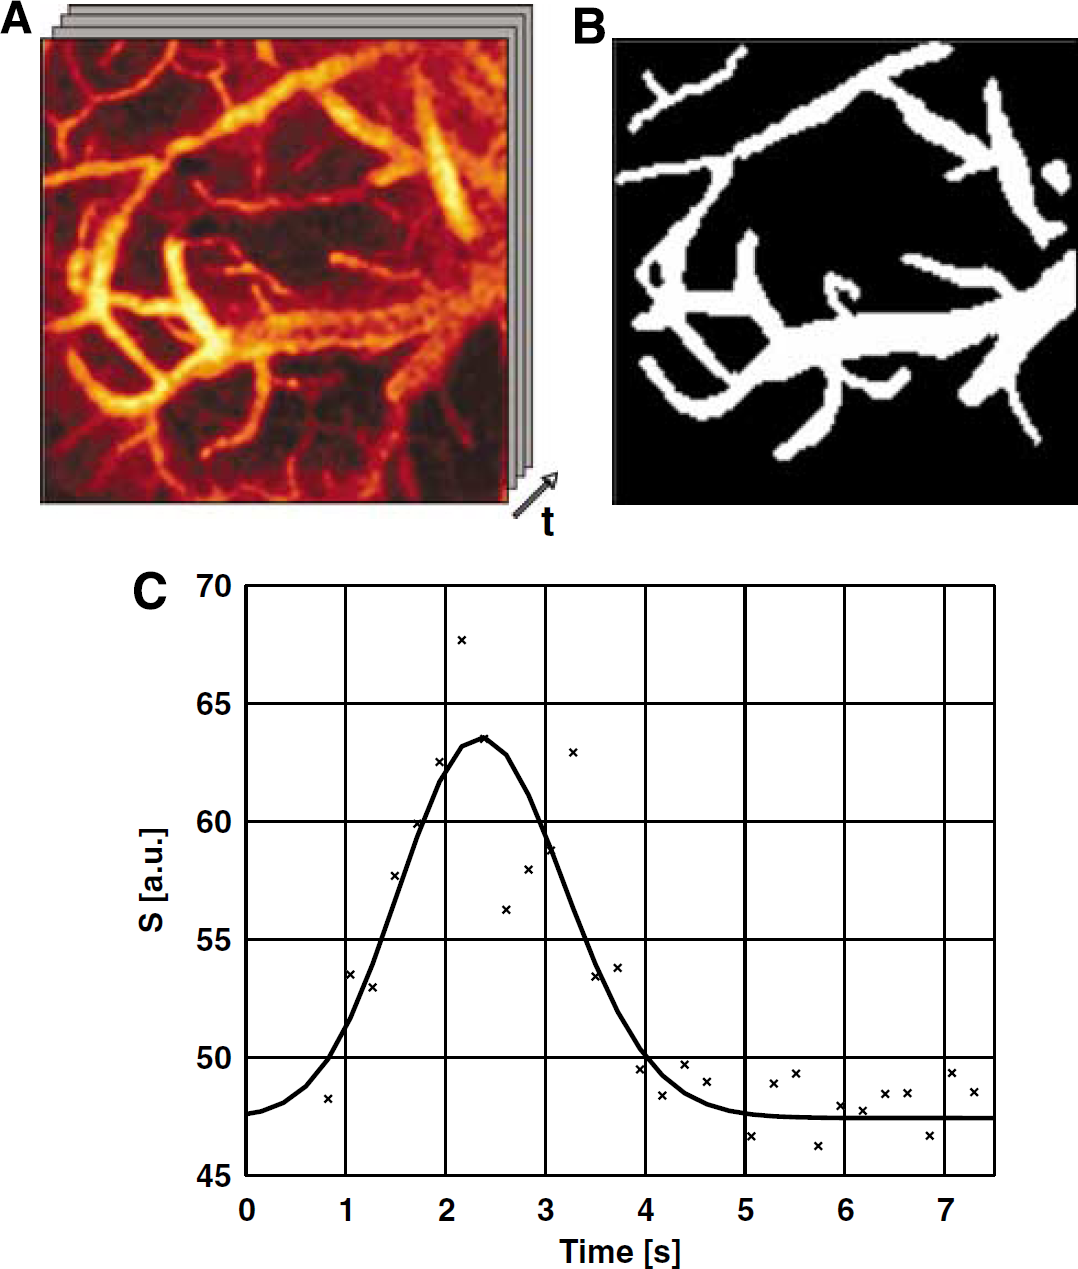
We observed a consistent decrease in the transit time across the imaged vasculature in each subject, validating the location of the cranial window and hence the imaged ROI. Across all subjects, two-way ANOVA revealed a statistically significant effect of stimulation on transit time when controlling for intersubject variability (P<0.05). Across subjects, the transit time decreased from 1.6 ± 0.3 sees at rest to 1.2 ± 0.2 sees during stimulation. Normalizing the transit time at activation by the transit time at rest in each subject, and then averaging across all subjects, the stimulation induced an average change of 20% ± 8% or 0.5 ± 0.1 sees in the transit time. A frame of the bolus tracking series in a sample subject, with the corresponding intravascular map, and the gamma variate fit to the representative voxel's signal time course are shown in Figures 2A to 2C. The time-to-peak maps resulting from the voxel-wise fitting of the bolus passage data to the gamma variate function in this subject are shown in Figure 3. The map of transit time estimates (i.e., time-to-peak estimates of the bolus passage, normalized to bolus arrival time) in this subject are displayed at rest (A) and during activation (B). The histograms of transit time estimates across all intravascular voxels in the same subject are shown in Figures 3C and 3D. The across-voxel mean transit time in this subject decreased from 1.34 ± 0.4 sees at rest to 0.78 ± 0.02 sees during activation.
A 1,024 × 1,024-μm2 frame in the bolus tracking series of a typical subject at rest (
Maps of transit time estimates, overlaid on a single frame of the bolus tracking time series in the subject of Figure 2 at baseline (
The stimulation condition produced a statistically significant effect (P<0.05) on the vessel volume of the 120 vessels (average diameter = 8.2 ± 0.6 μm) analyzed. On stimulation, the cerebral blood volume (CBV) of these vessels increased by an average 9.9% ± 1.0%. Figure 4 displays the results of semiautomatic segmentation of all vessels identified, on close visual inspection, as fully enclosed in the imaged volume (i.e., found to both originate and terminate within the imaged stack) in a sample subject at rest. As observed earlier for the hypercapnic challenge (Hutchinson et al, 2006), the degree of stimulation-induced dilatation exhibited a strong dependence on the resting vessel caliber. Following the literature data on the microvascular diameters (Pawlik et al, 1981), the 120 analyzed vessels were categorized into small vessels or capillaries, with diameter below 10 μm, and medium-size vessels, with diameter above 10 μm and below 30 μm. Given this ad hoc data segmentation, the smaller vessels or capillaries (mean d = 4.8 ± 0.2 μm; range 1.5 to 9.9 μm; N = 87) dilated by 10.9% ± 1.2% on average (P<0.05), a figure that was significantly (P<0.05) larger than the average 6.4% ± 1.0% dilation (P<0.05) of the medium-size vessels (mean d = 17.1 ± 1.6 μm; range 10.2 to 28.9 μm; N = 33). In terms of absolute CBV changes, the capillaries dilated by an average (1.4 ± 0.2) × 103 μm3, whereas the volume of medium-caliber vessels increased, on average, by (11.8 ± 2.3) × 103 μm3. These findings suggest a larger functional reactivity of capillaries when compared with medium vessels (on this caliber range) and a decreased heterogeneity of vessel calibers at activation with regard to resting condition. The decreased CBV heterogeneity is also indicated by the statistically significant (P < 0.05) stimulation-induced decrease in the coefficient of variation of the vessel volume of 3.4% ± 1.5%. Figure 5 shows the individual vessel CBV change as a function of the resting vessel diameter (Figure 5A) and as a function of the resting vessel volume (Figure 5B). The histograms of relative volume changes in capillaries and medium-caliber vessels are displayed in Figures 5C and 5D, respectively.
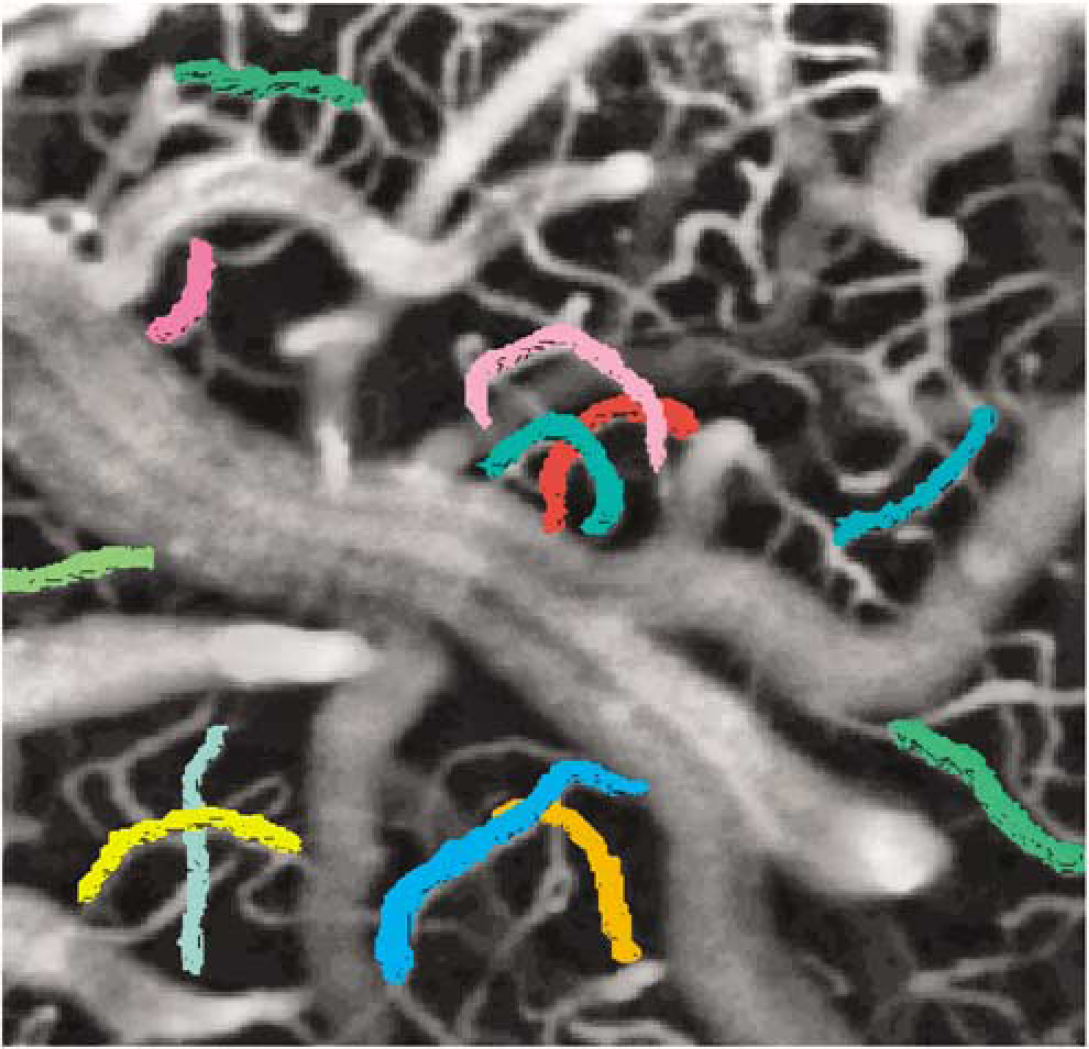
Results of semiautomatic segmentation of those vessels identified as being strictly included in the imaged stack (i.e., those found to both originate and terminate within the imaged volume) overlaid on the maximum intensity projection image (along axial direction) in a sample subject.
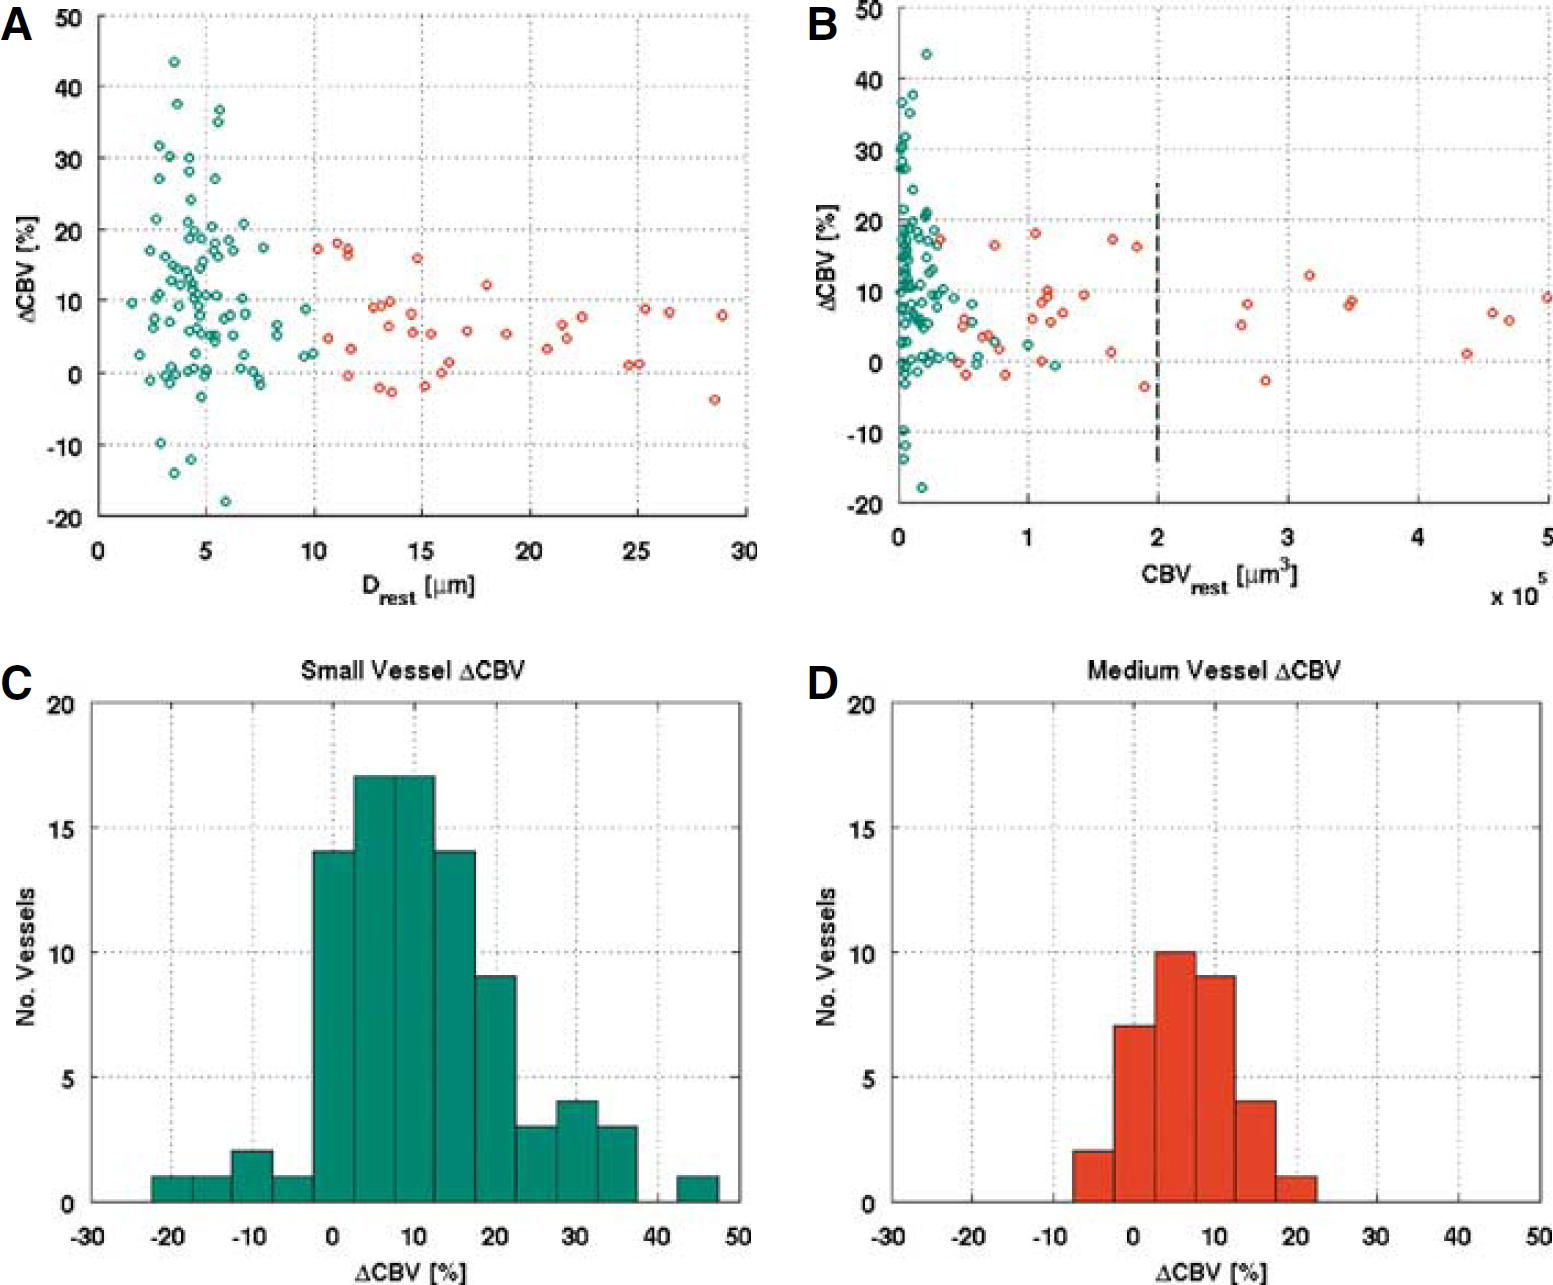
The vessel-wise blood volume change as a function of a point estimate of the resting vessel diameter (
It is instructive to note that whereas the above discussion segments the data using an ad hoc literature-based threshold of 10 μm to define capillaries, a very similar clustering may also be arrived at via data-driven segmentation. In particular, performing k-means clustering of the CBV change as a function of resting CBV data, a robust segregation (with mean silhouette value of 0.94) is achieved, with two clusters having the boundary roughly at the resting volume of 2 × 105 μm3, indicated by the dashed line in Figure 5B. Taking the resulting two groups as those representing small (capillary) and medium vessels, in turn, results in a capillary ΔCBV estimate of 10.0% ± 1.0% and a medium vessel ΔCBV change of 6.0% ± 1.3%, in close concordance with the preceding results.
When controlling for intervessel variability, forepaw stimulation produced a statistically significant effect on the RBC speed across the imaged capillaries (P<0.05, N = 25). The histograms of mean RBC speed during baseline and stimulation are shown in Figures 6A and 6B. Across the entire population, the mean change in the RBC speed was 12.3% ± 7.2%. Of these 25 capillaries, the change in the RBC speed between baseline and activation acquisitions was individually statistically significant (P<0.05) in 16 vessels, with an average response of 16.3% ± 10.1%: the mean changes in the RBC speed in the responding capillaries are plotted in Figure 6C. Twelve of these vessels exhibited an increase in RBC speed on stimulation (33.0% ± 7.7%) while the remaining four capillaries showed a decrease in RBC speed (–33.8% ± 16.8%) during forepaw stimulation relative to their baseline values. We observed no significant correlation between the stimulation-induced change in the RBC speed and the resting RBC speed (P > 0.9).
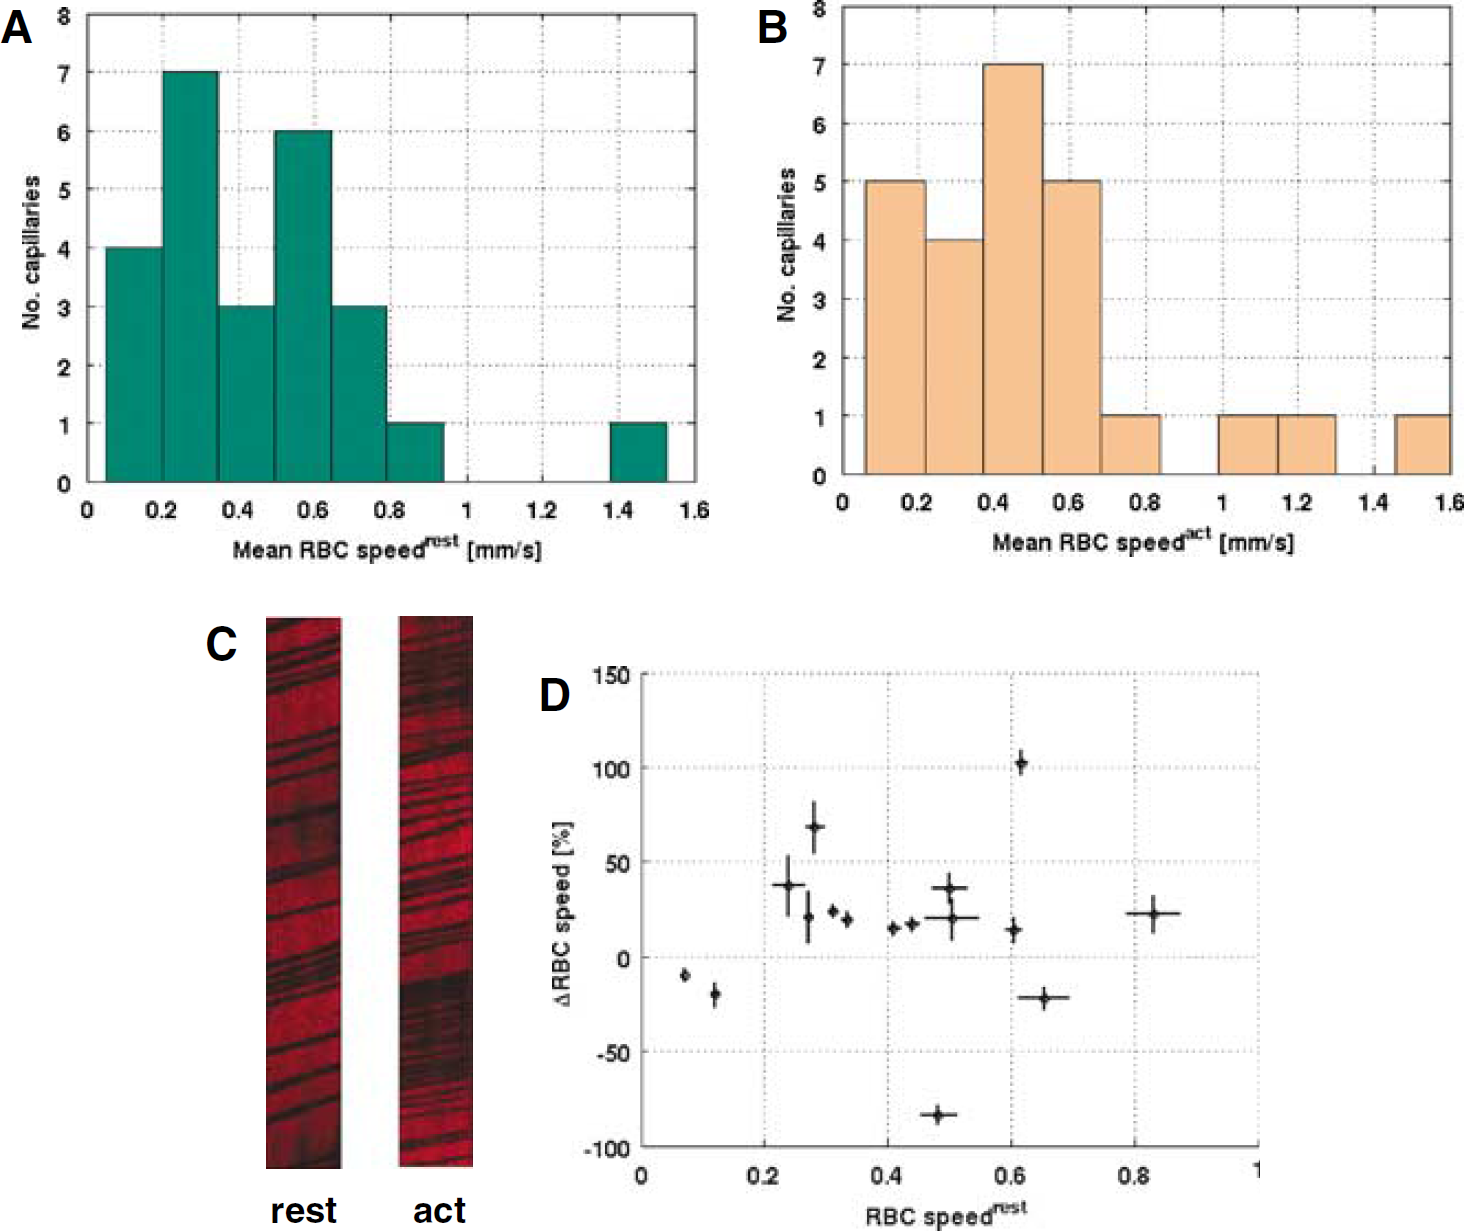
The histogram of RBC speed during baseline (
The mean fluorescent RBC flux across the superficial capillaries visualized in intravital fluorescence microscopy experiments increased by 19.5% ± 6.2% (P<0.05) after functional stimulation. The histogram of FRBC flux estimates, normalized to the total number of FRBCs that passed through each vessel during the acquisition period, is shown in Figure 7 at rest (A) and during activation (B). The stimulation-induced changes in the average FRBC flux as a function of average baseline FRBC flux are displayed in Figure 7C.
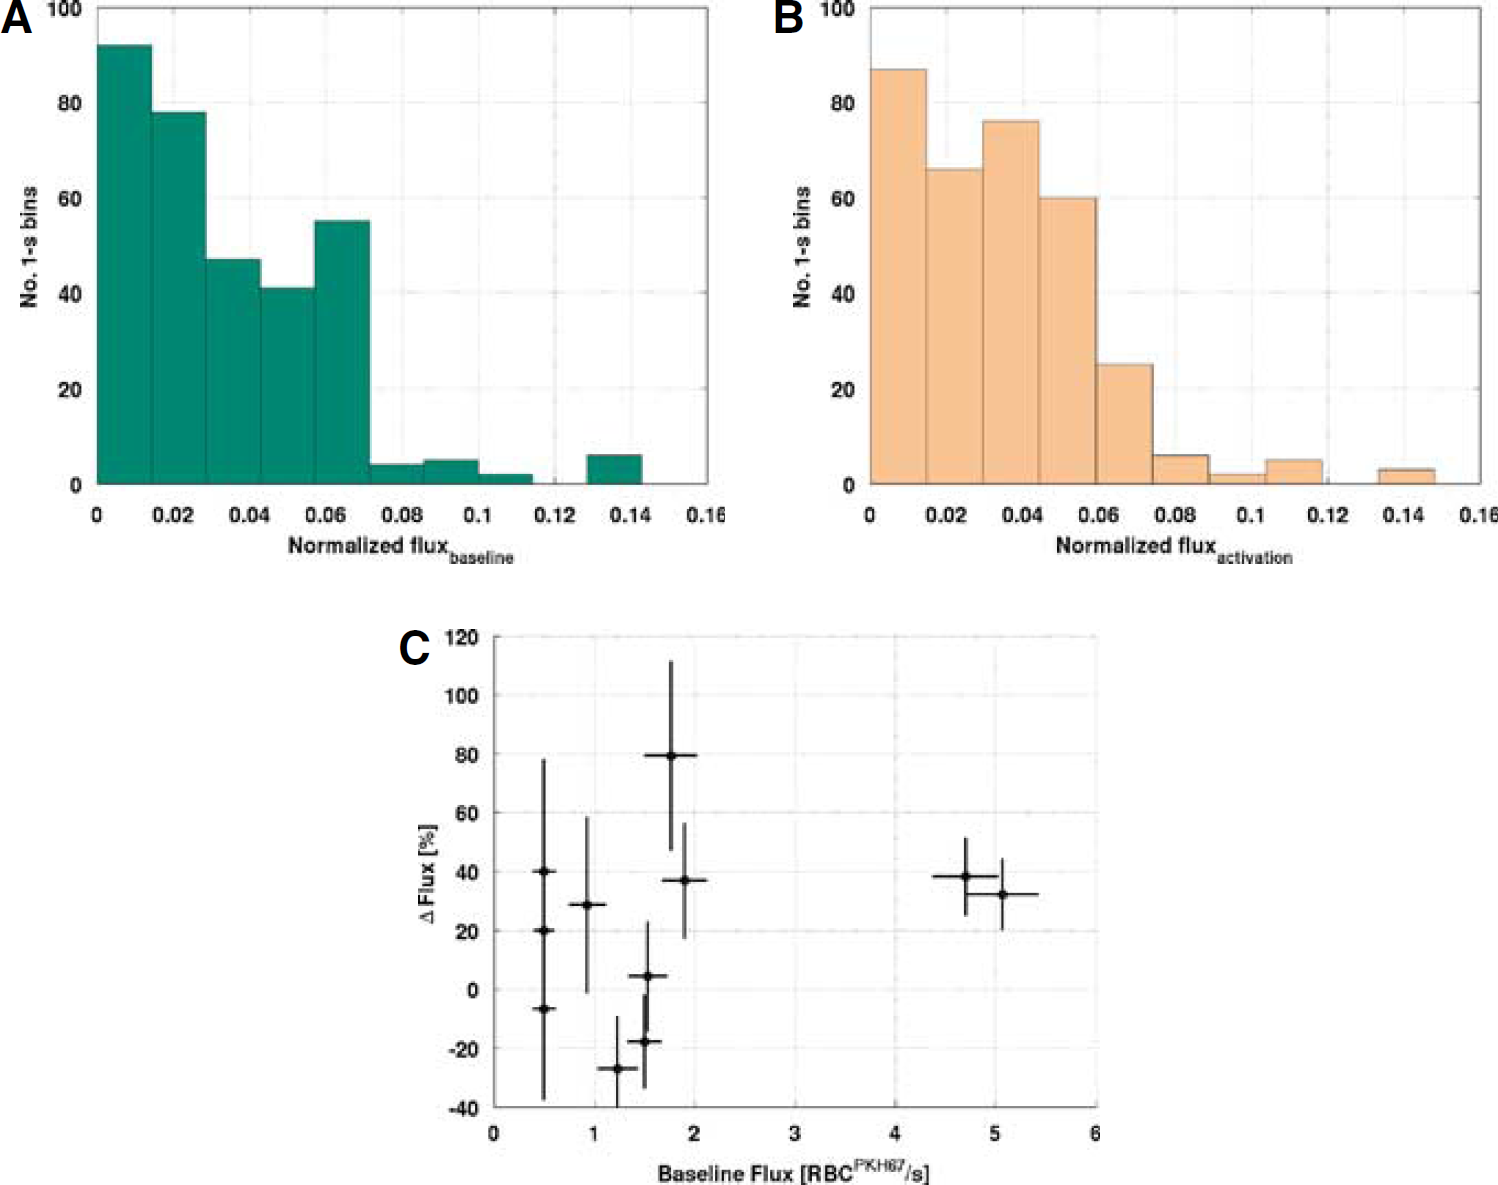
The histogram of normalized fluorescent RBC flux during baseline (
To investigate the temporal variation of the FRBC flux, the standard deviation and the coefficient of variation of the 1-sec binned FRBC flux estimates were plotted against mean flux, following earlier work (Hirase et al, 2004). There was a positive correlation between the standard deviation of FRBC flux and mean FRBC flux under both baseline (rank correlation = 0.94, P < 0.05) and activation (rank correlation = 0.95, P < 0.05) conditions. The inverse of coefficient of variation and the mean FRBC flux exhibited linear correlation (baseline: r = 0.77, P< 0.05, slope = 0.0040 sec/FRBC, offset = 0.0068; activation: r =0.73, P <0.05, slope = 0.0033 sec/FRBC, offset = 0.0082). Inthe correlation analysis of the 1-sec binned FRBC flux and time, we did not observe time-dependent changes of FRBC flux in any capillary under resting condition (P>0.05); only one capillary showed time-dependent increase in FRBC during the activation period (P<0.05).
Discussion
The present study investigated spatial and temporal characteristics of cortical microcirculatory changes during steady-state functional stimulation. Two-photon microscopy afforded imaging of individual vessels in the supragranular layers of the primary somatosensory cortex of anesthetized rats. For the first time, vessel volume rather than point measurements of the vessel diameter were employed to estimate the stimulation-induced changes in the vessel caliber. Intracranial SEP recordings were employed to show a sustained neuronal response throughout the stimulation period. Independent validation of the region of interest was afforded via tracking of the fluorescent bolus and subsequent estimation of transit times under baseline and stimulation conditions. Combined, the findings testify to (1) decreased vascular transit times, (2) increased microvessel blood volume with larger dilatation of the smaller vessels and hence decreased vascular heterogeneity, and (3) significant increases in RBC speed and flux with a small proportion of capillaries exhibiting RBC speed/flux decreases, suggestive of focal redistribution of capillary flow during stimulation relative to rest.
Forepaw stimulation induced an average decrease of 0.5 ± 0.1 sees in the transit time across the imaged vasculature, indicating a robust vascular response in the imaged region to forepaw stimulation. The transit time measurement provided independent validation of the mesoscopic region of interest. In addition, maps of transit times were produced for both baseline and stimulation periods, providing a view of the spatial distribution of the vascular transit time shortening. Combining these measurements with vessel volume measurements, although beyond the scope of the present study, will allow estimation of stimulation-induced plasma flow changes in smaller vessels (where it can be contrasted to patterns of RBC flow adjustments measured via line scanning) as well as in larger vessels (where the speed and geometry of RBC flow preclude vRBC measurements via line scanning).
The mean stimulation-induced increase in blood volume was achieved by larger dilatation of the smaller vessels or capillaries (10.9% ± 1.2% of capillaries versus 6.4% ± 1.0% of medium-caliber vessels), suggesting decreased vascular heterogeneity at activation relative to rest, in agreement with our earlier study of the microcirculatory response to mild hypercapnia (Hutchinson et al, 2006). While capillary caliber changes have not been the focus of previous studies of functional activation, capillary dilatation in response to hypercapnia has been reported by a number of groups, including our own (Atkinson et al, 1990; Duelli and Kuschinsky, 1993; Villringer et al, 1994; Hutchinson et al, 2006).
More than 60% of the studied capillaries showed a statistically significant change in RBC speed with stimulation. The erythrocyte speed increased in the majority of these capillaries (ΔvRBC = 33.0% ± 7.7%, N = 12). Stimulation-induced increases in RBC speed have been reported in prior two-photon microscopy studies after brief (1 to 5 sees) vibrissal (ΔvRBC ≥ 20%; 5 of 14 capillaries) and hindlimb stimulation (ΔvRBC ≥ 15%; 3 of 9 capillaries) (Kleinfeld et al, 1998) and 2-sec odor stimulation (ΔvRBC = 23% ± 10%) in rats (Chaigneau et al, 2003). The larger amplitude changes observed here likely resulted from the sustained stimulation and steady-state conditions.
In contrast to earlier studies of direct electrical stimulation of the somatosensory cortex (Schulte et al, 2003), we observed no significant correlation between basal RBC speed and stimulation-induced changes in RBC speed. As the level of hyperemia was therein found to significantly affect the degree of ΔvRBC dependence on
The CCD recordings of fluorescently labeled RBCs afforded an independent measure of erythrocyte flow changes after functional stimulation. The mean fluorescent RBC flux across the superficial capillaries thus visualized increased by 19.5% ± 6.2% (P<0.05) after functional stimulation, well in the range of previous investigations (Schulte et al, 2003). (The poor spatial resolution of the images in combination with limited contrast between blood and vascular wall under epiillumination prevents reliable vessel caliber estimation.) Consistent with vRBC measurements, we observed no significant dependence of RBC flux change on baseline RBC flux.
It is of note that while functional stimulation principally resulted in capillary dilatation and RBC speed and flux increases, we also observed stimulation-induced capillary constriction, as well as decreases in erythrocyte speed and flux, albeit at much lower frequency. Indeed, brief (1 sec) forepaw stimulation has recently been reported to result in vasodilatation followed by vasoconstriction of cortical vessels mostly less than 30 μm in diameter, with vasoconstriction dominating the response distant from the center of the neuronal activation (Devor et al, 2007). Capillary constriction has also been observed in the cerebral cortex of mice (Fernandez-Klett et al, 2007). A small portion of the responding capillaries (3 out of 32) in the study of rat olfactory bulb glomeruli exhibited odor-induced decreases in RBC speed (Chaigneau et al, 2003). Similar observations of a combination of increased and decreased erythrocyte speed have been reported in capillaries closer to the cortical surface when applying a low current amplitude cortical stimulation (Schulte et al, 2003). The combination of increases and decreases in capillary volume, RBC speeds, and RBC flux observed suggests a focal redistribution of capillary flow/volume after functional stimulation and a capacity for local flow/volume changes in the absence of net changes in cerebral blood flow or volume, in support of earlier findings in the olfactory bulb (Chaigneau et al, 2003).
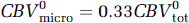
Given the present data, it is tempting to speculate on the contribution of the capillaries to the total stimulation-induced CBV changes. Under the central volume principle, CBV = CBF+TT, so that the ˜20% shortening in the transit time, in combination with our earlier CASL fMRI measurements of an ˜50% average increase in flow using the same functional paradigm (Stefanovic et al, 2007), yields a 20% predicted increase in the total blood volume. This figure is to be compared with the average ˜14% total CBV increase measured via MION fMRI in the aforementioned study (Stefanovic et al, 2007) and an ˜17% total CBV increase predicted by the empirically derived power law dependence of volume on flow (Grubb et al, 1974). Assuming that capillary compartment comprises 33% of the total vascular volume (Sharan et al, 1989) and given the ˜11% dilatation in the capillary volume, the total CBV at rest is given by

During stimulation, in turn, CBV is given by
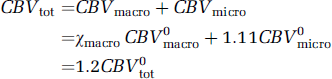
Solving equations for the noncapillary blood volume fraction at activation relative to rest, χmacro, we estimate a ˜24% increase in the non-capillary (i.e., arterial, arteriolar, venular, and venous) blood volume in response to functional stimulation. At the same time,

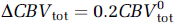
It is at present not clear whether the observed capillary dilatation is a passive consequence of arteriolar dilatation or a result of an active regulation of the capillary diameter (for a review of the possible mechanisms, see Hudetz, 1997). Direct investigation of this mechanism in vivo poses very stringent requirements on both spatial and temporal resolution. Recently, electrical stimulation- and neurotransmitter release- induced capillary constriction via pericytes have been shown in both whole retina and cerebellar slices, with the localized constriction propagating so as to cause constriction of distant capillaries (Peppiatt et al, 2006). On the mesoscopic scale, functional activation has been found to result in the production of a variety of vasoactive agents by both neurons and astrocytes (Villringer and Dirnagl, 1995; Attwell and Iadecola, 2002; Iadecola, 2004; Lauritzen, 2005; Takano et al, 2006). In an fMRI study employing the current functional paradigm, we have recently reported that cyclooxygenase-2 (COX-2) inhibition causes maximal attenuation of the stimulation-induced blood flow response in layer IV (Stefanovic et al, 2006), consistent with COX-2 expression in the axonal terminals of excitatory neurons in the capillary-rich layer IV (Wang et al, 2005), which receive direct input from the thalamus (Brecht and Sakmann, 2002). We thus postulate that COX-2-mediated production of vasodilatory prostanoids affords a fast, afferent-driven response of the microvasculature (Iadecola et al, 1997) to the early increases in neuronal activity (Armstrong-James et al, 1992). Future studies involving a reconstruction of vascular architecture and analysis of transient changes in hemodynamics across the vascular compartments in relation to the spatiotemporal pattern of neuronal activity are needed to refine our understanding of microvascular hemodynamics and hemodynamic response generation.
On the methodological note, a number of factors ought to be considered when translating the present findings to awake, behaving animals. The closed cranial window preparation, while offering a powerful method for in vivo observation of cerebral microcirculation, is at least ‘semiinvasive,’ and leads to progressive degradation of the preparation. The capillary hemodynamics is particularly sensitive to arterial CO2 tension, necessitating close monitoring of arterial blood gases. Furthermore, the amount of heating of the capillaries in the course of line scans (the recordings having the smallest target volume and yet the highest scanning rate), while nondestructive, may affect the hemodynamics of interest. Every effort has been made in the course of this study to minimize the data acquisition time, rigorously monitor the animal physiology, and ensure normal systemic physiological conditions throughout the experiments. In addition, close attention has been paid to the reproducibility of the reference responses from a subset of capillaries identified in each preparation. The currently employed functional paradigm has been optimized, with regard to the hemodynamic response amplitude, in extensive fMRI studies by our and other groups doing functional neuroimaging of anesthetized rodents (Silva et al, 1999; Ureshi et al, 2005). The agreement between the nature of the microvascular response in the present study and earlier studies of mild hypercapnia (Atkinson et al, 1990; Duelli and Kuschinsky, 1993; Villringer et al, 1994; Hutchinson et al, 2006) further suggests generalizability of the current findings. In the light of the preserved neurometabolic and neurovascular coupling under α-chloralose (Ueki et al, 1992; Lindauer et al, 1993), this anesthetic is routinely used for brain function investigations, with a wealth of data showing strong, focal neuronal, metabolic, and hemodynamic responses under its influence (Hyder et al, 1997; Ureshi et al, 2005; Devor et al, 2007).
In conclusion, the microcirculatory response to functional stimulation is characterized by a pronounced decrease in vascular transit times; microvascular blood volume increase, with larger dilatation of the smaller vessels and thus decreased heterogeneity of microvessel calibers at stimulation relative to rest; and increases in both RBC speed and flux. Significant, though less frequent, stimulation-induced decreases in microvessel volume as well as erythrocytic flow suggest a capacity for focal redistribution of microcirculatory flow and volume during functional stimulation. The present findings testify to a strong capillary response to functional stimulation, suggest an ˜18% contribution of the capillary compartment to the total CBV increase, and underscore the importance of capillaries in the hemodynamic response to neuronal activation.
Footnotes
Acknowledgements
The authors would like to thank Ruperto Villadiego for machinery services and Sachy Orr-Gonzalez for animal surgery and preparation. This work was supported by the Intramural Research Program of NIH, NINDS.