
Abstract
Effects of mitochondrial calcium signaling blockade on neural activation-induced CBF response were studied in urethane-anesthetized rats. Ruthenium red (RuR), a nonspecific inhibitor of the mitochondrial calcium uniporter (MCU), and Ru360, a highly specific inhibitor of the MCU, were delivered intravenously (i.v.) or intracerebroventricularly (i.c.v.). Baseline cerebral blood flow (CBF) and cerebral hyperemic response to whisker stimulation were measured through a thinned skull over the somatosensory cortex using laser Doppler imaging (LDI). Ruthenium red or Ru360 did not alter the baseline CBF at all doses used. However, the hyperemic response, defined as the activation area and amplitude of CBF increase in response to mechanical whisker stimulation, was significantly reduced in the presence of either RuR or Ru360 delivered i.c.v. The hyperemic response reduced significantly with a dose of 14.5 nmol RuR (i.c.v.), showing a further decrease with 29 nmol RuR (i.c.v.). A comparable decrease in the hyperemic response was observed during treatment with a relatively lower dose of 4.5 and 9 nmol Ru360 (i.c.v.). Delivered intravenously, Ru360 significantly diminished the cerebral hyperemic response at doses greater than 80 μg/kg i.v., up to a dose of 320 μg/kg i.v. However, RuR (i.v.) had an opposite effect with an enhancement in the cerebral hyperemic response at all doses studied. Ruthenium red or Ru360 had no significant effect on the cerebral reactivity to hypercapnia, indicating that altered cerebral hyperemic response to whisker stimulation was predominantly neural. We conclude that mitochondrial calcium signaling through the MCU mediates neural activation-induced CBF response in vivo.
Keywords
Introduction
Functional magnetic resonance imaging studies have indicated stimulated neuronal activity to be accompanied by increased oxygen usage. Increased oxygen consumption is followed by a larger fractional increase in cerebral blood volume and cerebral blood flow (CBF), resulting in a net decrease of deoxyhemoglobin in the activated regions (Ogawa et al, 1992). This phenomenon gives rise to a change in the blood oxygen level-dependent signal contrast in functional magnetic resonance imaging, interpreted as brain activity. The underlying (neurometabolic coupling) hypothesis for functional magnetic resonance imaging is that CBF increases in response to greater energy demand in terms of glucose and oxygen utilization by activated neural cells. However, it has been argued that though CBF change correlates with oxygen consumption during functional activation of the brain, it need not imply oxygen or energy consumption to be the cause (Attwell and Iadecola, 2002). Experimental results suggest that glucose and oxygen delivery may not be completely controlled by glucose or oxygen lack alone to increase CBF (Powers et al, 1996; Mintun et al, 2001, 2004) and neither signaling messengers related to energy metabolism such as CO2 or H+ alone account for CBF changes related to neural activity (Astrup et al, 1978; Pinard et al, 1984). Recently, it has been proposed that the increase in CBF during evoked neural activity is a consequence of a relatively small increase in energy usage in comparison to energy consumed during the resting state (Shulman et al, 2004).
Blood oxygen level-dependent signal contrast used in functional imaging may be alternately interpreted as signaling of the neural population than as a locus of energy utilization (Attwell and Iadecola, 2002). Thus, mechanisms leading to the blood oxygen level-dependent signal contrast need to be understood as an outcome of neural signaling as much as it is a problem of brain energy metabolism. Recent hemodynamic models of the brain have suggested intracellular calcium ([Ca2+]i) signaling to be an important aspect of any biophysically realistic model of neural activity (Aubert and Costalat, 2002; Tiveci et al, 2005). Mitochondria, ‘the power house of the cell,’ controls cellular oxidative metabolism and is an important organelle in the brain tissue, as it is heavily dependent on oxidative energy. In addition to cellular Ca2+ signaling, mitochondrial Ca2+ signaling is an important mechanism through which mitochondrial dehydrogenases are regulated to produce reduced equivalents for the electron transport chain, which aids oxidative ATP synthesis.
In this study, we tested the ‘neuro-metabolic coupling’ hypothesis by inhibiting mitochondrial Ca2+ transport. It was hypothesized that a disruption of Ca2+-mediated stimulation of mitochondrial dehydrogenases necessary for the acceleration of oxidative energy metabolism results in an altered cerebral hemodynamic response to a sensory stimulus. To this end, we used potent inhibitors of the mitochondrial calcium uniporter (MCU), namely ruthenium red (RuR) and Ru360, in urethane-anesthetized rats. Spatio-temporal characteristics of the CBF response to whisker stimuli was measured using laser Doppler imaging (LDI). The two inhibitors were tested due to differences in their specificity to the MCU. Ru360, in addition to being more specific as an MCU blocker, has been shown to penetrate cells in vitro relatively better than RuR. Two modes of delivery were used, namely intravenous (i.v.) or intracerebroventricular (i.c.v.), to address RuR penetration through the blood—brain barrier (BBB) when delivered i.v.
Methods
Surgical Preparation
Sprague—Dawley rats (weighing 250 to 300 g, n=46) from Taconic (Germantown, NY, USA) were anesthetized with urethane (1.2 g/kg, intraperitoneally). An additional bolus of anesthesia (20% of initial dose) was injected later if blood pressure increased to a tail pinch during the protocol. The animal's core temperature was monitored and maintained at 37±0.5°C with a rectal probe and homeothermic blankets (Baxter K-MOD100; Gaymar Industries, Orchard Park, NY, USA). Rats were endotracheally intubated and administered with a single dose of gallamine triethiodide (250 mg/kg, intraperitoneally), a muscular paralysis agent, before mechanical ventilation. Arterial blood pressure, end-tidal CO2, and inspired oxygen concentration were continuously monitored (8100 POET Vital Signs Monitor; Criticare Systems Inc., Waukesha, WI, USA). The left femoral artery was catheterized using PE50 tubing for measurement of mean arterial pressure (MAP), whereas the left femoral vein was catheterized for infusion of drugs. Arterial blood gases were maintained in the normal range by appropriate ventilatory adjustments. The study protocol followed institutional guidelines and was approved by the Animal Research Center of the University of Medicine and Dentistry of New Jersey.
After stabilizing the rat in an adjustable stereotaxic frame (Stoelting Instruments, Wood Dale, IL, USA), the scalp was retracted from the frontoparietal cortex by a dorsal midline incision to expose the cranium. The temporalis muscle was disconnected from the cranium, and the skull area of 5 × 5 mm (2 mm posterior and 5 mm lateral to the bregma) enclosing the whisker barrel area on the left hemisphere was thinned to translucency using an air-cooled dental drill. The translucent window was subsequently coated with mineral oil. The stereotaxic frame was tilted to provide an inclination of 45° on the midline axis. This ensured the alignment of the cortical surface surrounding the whisker barrel area was normal to the laser beam. Stereotaxic coordinates for the i.c.v. injections were as follows: anterio-posterior=0.0 relative to the bregma, lateral=1.5 to the midline, and depth=4.4 mm from the cranial surface. The skull area of 1 × 1 mm was thinned at the above stereotaxic coordinates to enable smooth i.c.v. injections through a Hamilton microsyringe.
Drug Treatments
Ruthenium red was from Sigma (St Louis, MO, USA) and Ru360 from EMD Biosciences (San Diego, CA, USA). Rats were grouped into RuR (i.v., n=8; i.c.v., n=6,) and Ru360 (i.v., n=5; i.c.v., n=5) for the whisker stimulation experiments and into RuR (i.v., n=3) and Ru360 (i.v., n=3) for the hypercapnia experiments. Laser Doppler imaging measurements were made during control conditions without the presence of the RuR or Ru360 in all rats. In a separate group of rats (n=3), measurements were made with vehicle infusion (i.c.v.), temporally corresponding to the first and second dose of RuR or Ru360 (i.c.v.) to obtain an active time control. Artificial cerebrospinal fluid (ACSF), which contained 126 mmol/L NaCl, 2.5 mmol/L KCl, 2 mmol/L CaCl2, 1.2 mmol/L MgCl2, 25 mmol/L NaHCO3, 1.25 mmol/L NaH2PO4, and 10 mmol/L
Laser Doppler Imaging
A high-resolution Moor LDI device (Moor Instruments, Sussex, UK) was used for the LD measurements. A set of plane mirrors in the device directed a beam of laser from a low-power (2 mW±20%, 632.8 nm) He-Ne source onto the tissue surface and collected the scattered Doppler shifted beam from the tissue, which was focused onto a photodetector. A mirror controlled by a motor enabled the laser beam to scan in a raster pattern across the surface of the thinned skull. The complete procedure is described in detail by Kannurpatti and Biswal (2005). Briefly, the distance between the LDI scanner head and the thinned skull was 20 cm, leading to an in-plane resolution of approximately 110 × 110 μm2 with LDI images of 45 × 45 pixel matrix obtained covering a field of view of 5 × 5 mm2. Images were obtained over the contralateral cortex where the image field of view completely covered the thinned skull window. Images were obtained at a rate of 16 secs/image and a dead time of 4 secs between each image. Twenty-five images were obtained during four ‘rest’ blocks (first three rest blocks=80 secs; last rest block=140 secs) alternated by three ‘stimulus’ blocks (each=40 secs) of mechanical whisker stimulation. The right vibrissae were cut to a length of approximately 3 cm from the face and fitted through a mesh screen fixed to a solenoid-driven actuator arm, whereas the left vibrissae were completely trimmed. The screen was positioned approximately 1 cm from the rat's face to ensure facial hair was not stimulated during mechanical stimulation of the whiskers. A frequency of 8 Hz was used during stimulation. For the hypercapnia experiments, 25 images were obtained during a normocapnia block (220 secs), followed by a brief hypercapnia block (60 secs) and finally by a normocapnia block (220 secs). Rats were ventilated with room air for the normocapnic condition and with room air+5% CO2 for the brief hypercapnic condition.
After the end of each experiment, rats that received an i.c.v. injection of RuR were euthanized while still under complete surgical-level anesthesia with a bolus of intravenous KCl injection. The brain was removed after decapitation and placed in ice-cold ACSF. Coronal slices of thickness 2 mm were cut to observe the staining of RuR in different regions including the ventricles to ascertain the accuracy of the i.c.v. injection.
Image Processing and Statistical Analysis
The Moore LDI data analysis software package was used to acquire LDI images during experiments. The flow-related signal derived from the Doppler spectrum was processed by an A/D converter in the imaging system and the signal was compensated for noise effects and color-coded in relative perfusion flux units (r.p.u.). Image data were imported and analyzed using custom programs written in MATLAB (Math Works Inc, Natick, MA, USA). The average signal intensities from the temporal sequence of images at resting condition and whisker stimulation were, respectively, determined and subtracted to compute the difference image. Subsequently, the percent change in signal was estimated on a pixelwise basis by dividing the difference image from the average baseline intensity image.
For detection of whisker activation-induced cortical activation, the LDI signal time series from the experimental trials for each treatment condition were crosscorrelated with a reference function similar to the timing of the whisker stimulus on a pixelwise basis. Subsequently, the crosscorrelation coefficients were used to detect task-activated pixels in the cortex. A threshold of 1.96 times the s.d. for the null distribution corresponding to an error probability of P<0.05 was used for determining the threshold, which corresponded to a correlation coefficient value of 0.4. The optimal probability threshold of P<0.05 was chosen using a simple data-driven approach depending on the visual activation pattern to detect most active pixels while minimizing the number of false positives (Baudewig et al 2003). The percent change in the LDI signal during different experimental conditions was estimated as the mean percent change in LDI signal from the top 20% of the activated pixels detected after crosscorrelation. Statistical significance between control and treated conditions was tested using one-way analysis of variance. P<0.05 was considered significant.
Results
High LD flux arising from large pial vessels was clearly distinguishable in the baseline LD images. Intermediate and low baseline flux pixels typically belonged to lower caliber and deeper vessels and were more distributed. As observed earlier, the baseline noise was proportional to the LDI flux in each pixel (Kannurpatti and Biswal, 2005). Figures 1A to 1D show the mean normalized baseline LD flux over the image field of view in all rats treated with RuR or Ru360. No significant change in the baseline LDI flux was observed during treatment with RuR or Ru360 in all rats except for a significant increase in baseline LD flux during treatment with RuR i.c.v. (Figure 1C).
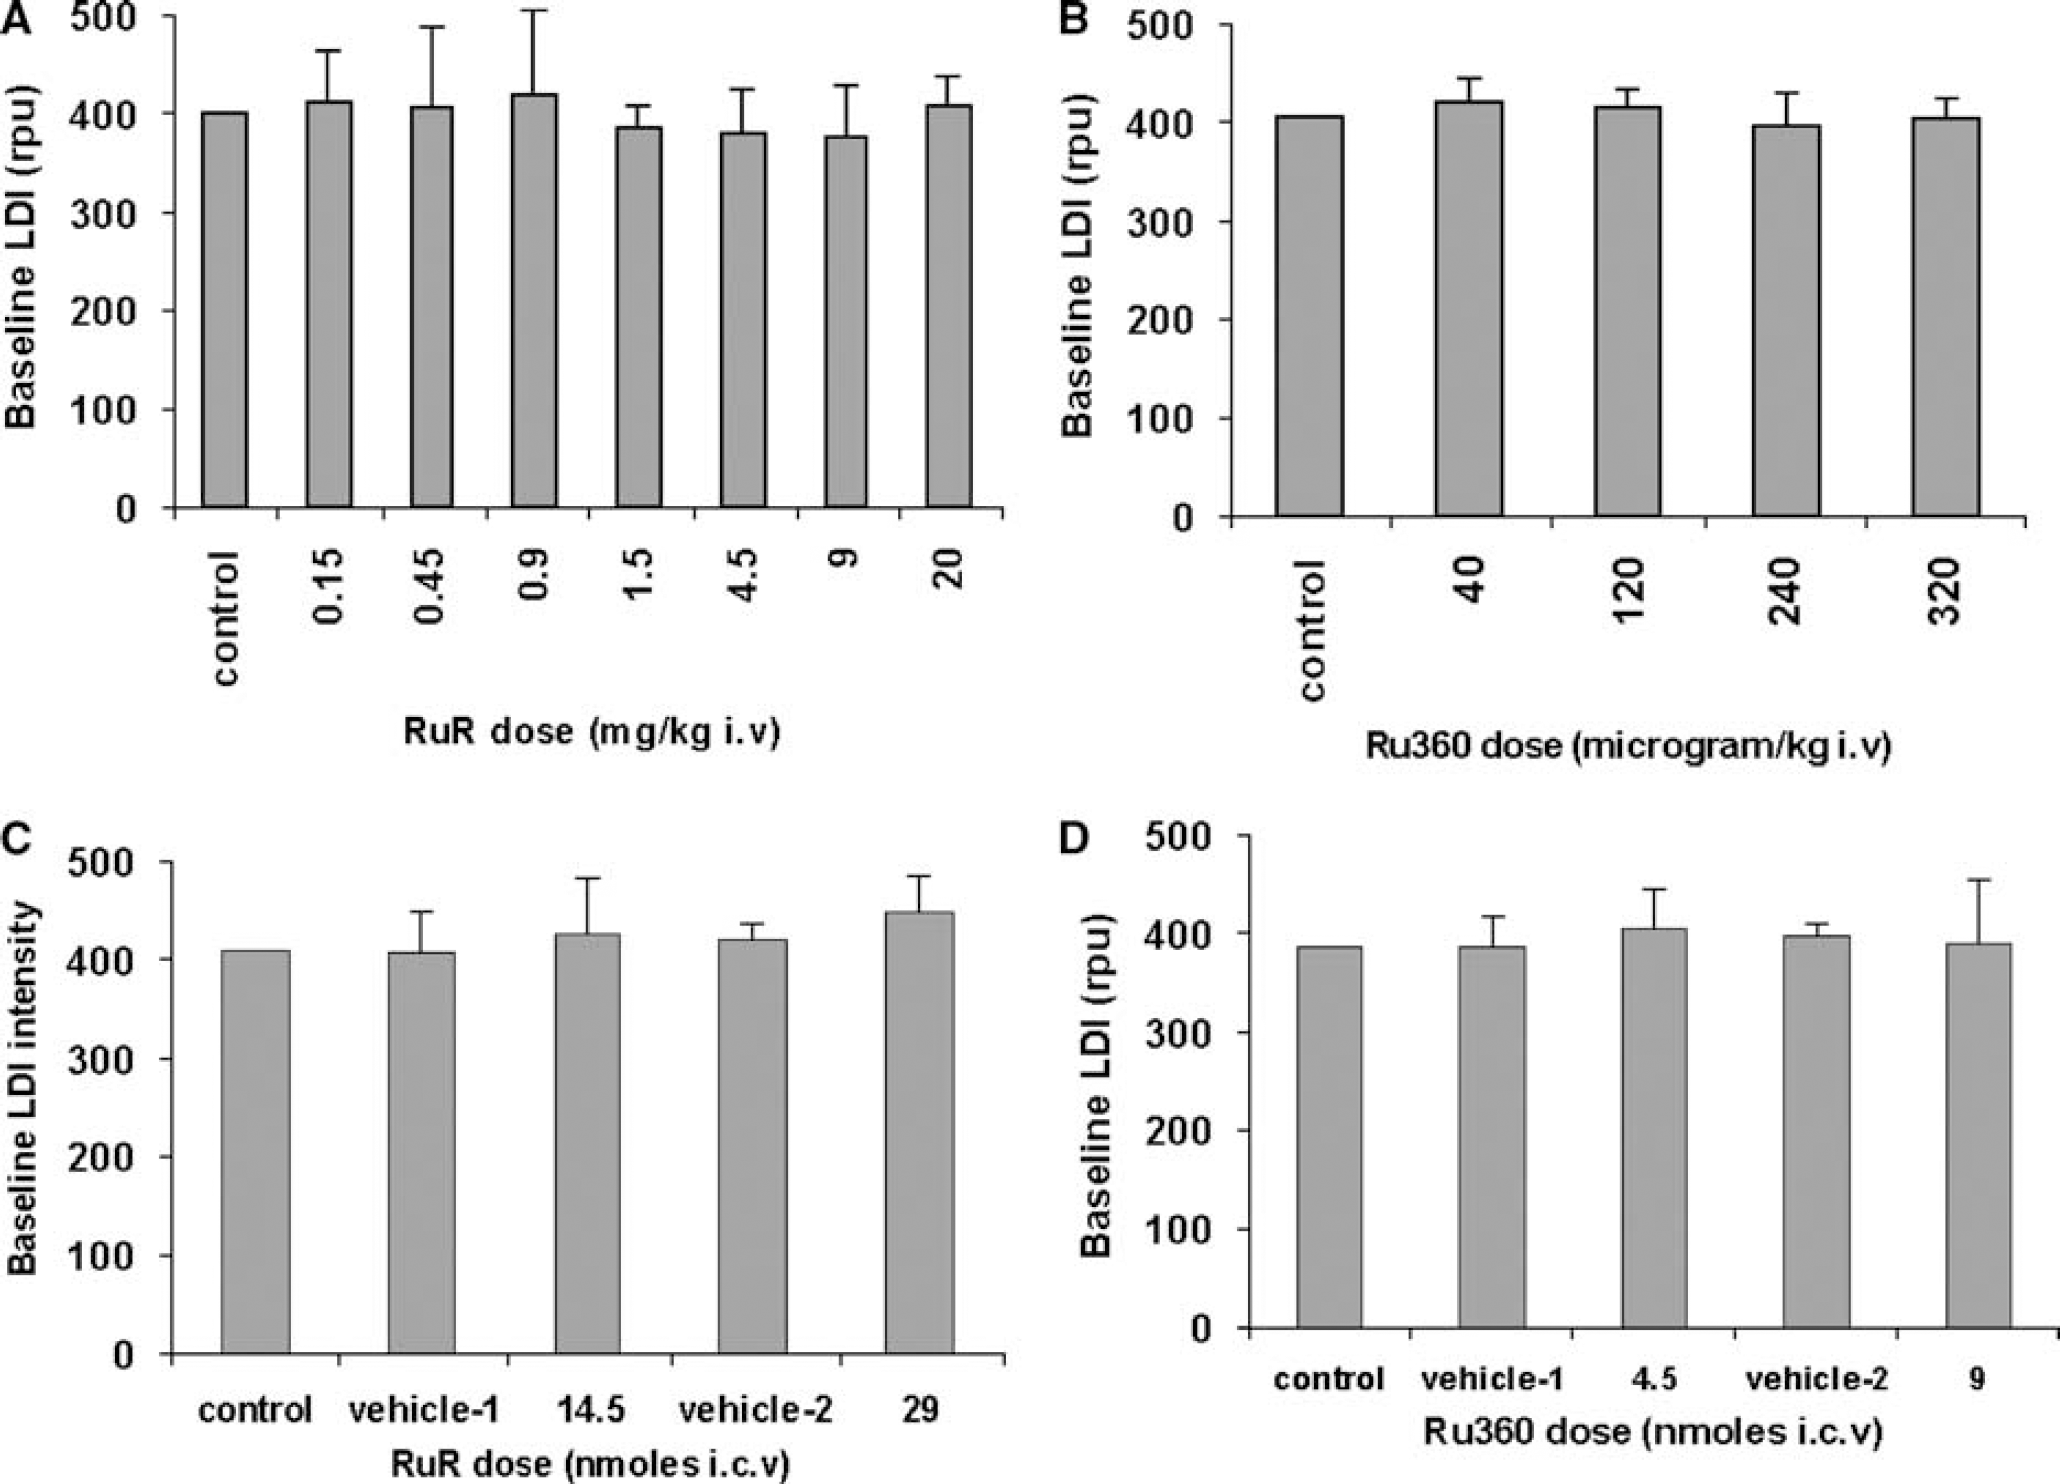
Mean normalized baseline LDI flux from all rats treated with (
Laser Doppler imaging signal time series from the experimental trials for each treatment condition were crosscorrelated with a reference function similar to the timing of the whisker stimulus on a pixelwise basis. Subsequently, the crosscorrelation coefficients were used to detect task-activated pixels in the cortex. Stimulation-induced increase in signal was primarily from regions with intermediate to low baseline LD flux and distinctly away from macroscopic and pial vessels with high flux value.
Intravenous Administration of Drugs Blocking Mitochondrial Ca2+ Entry
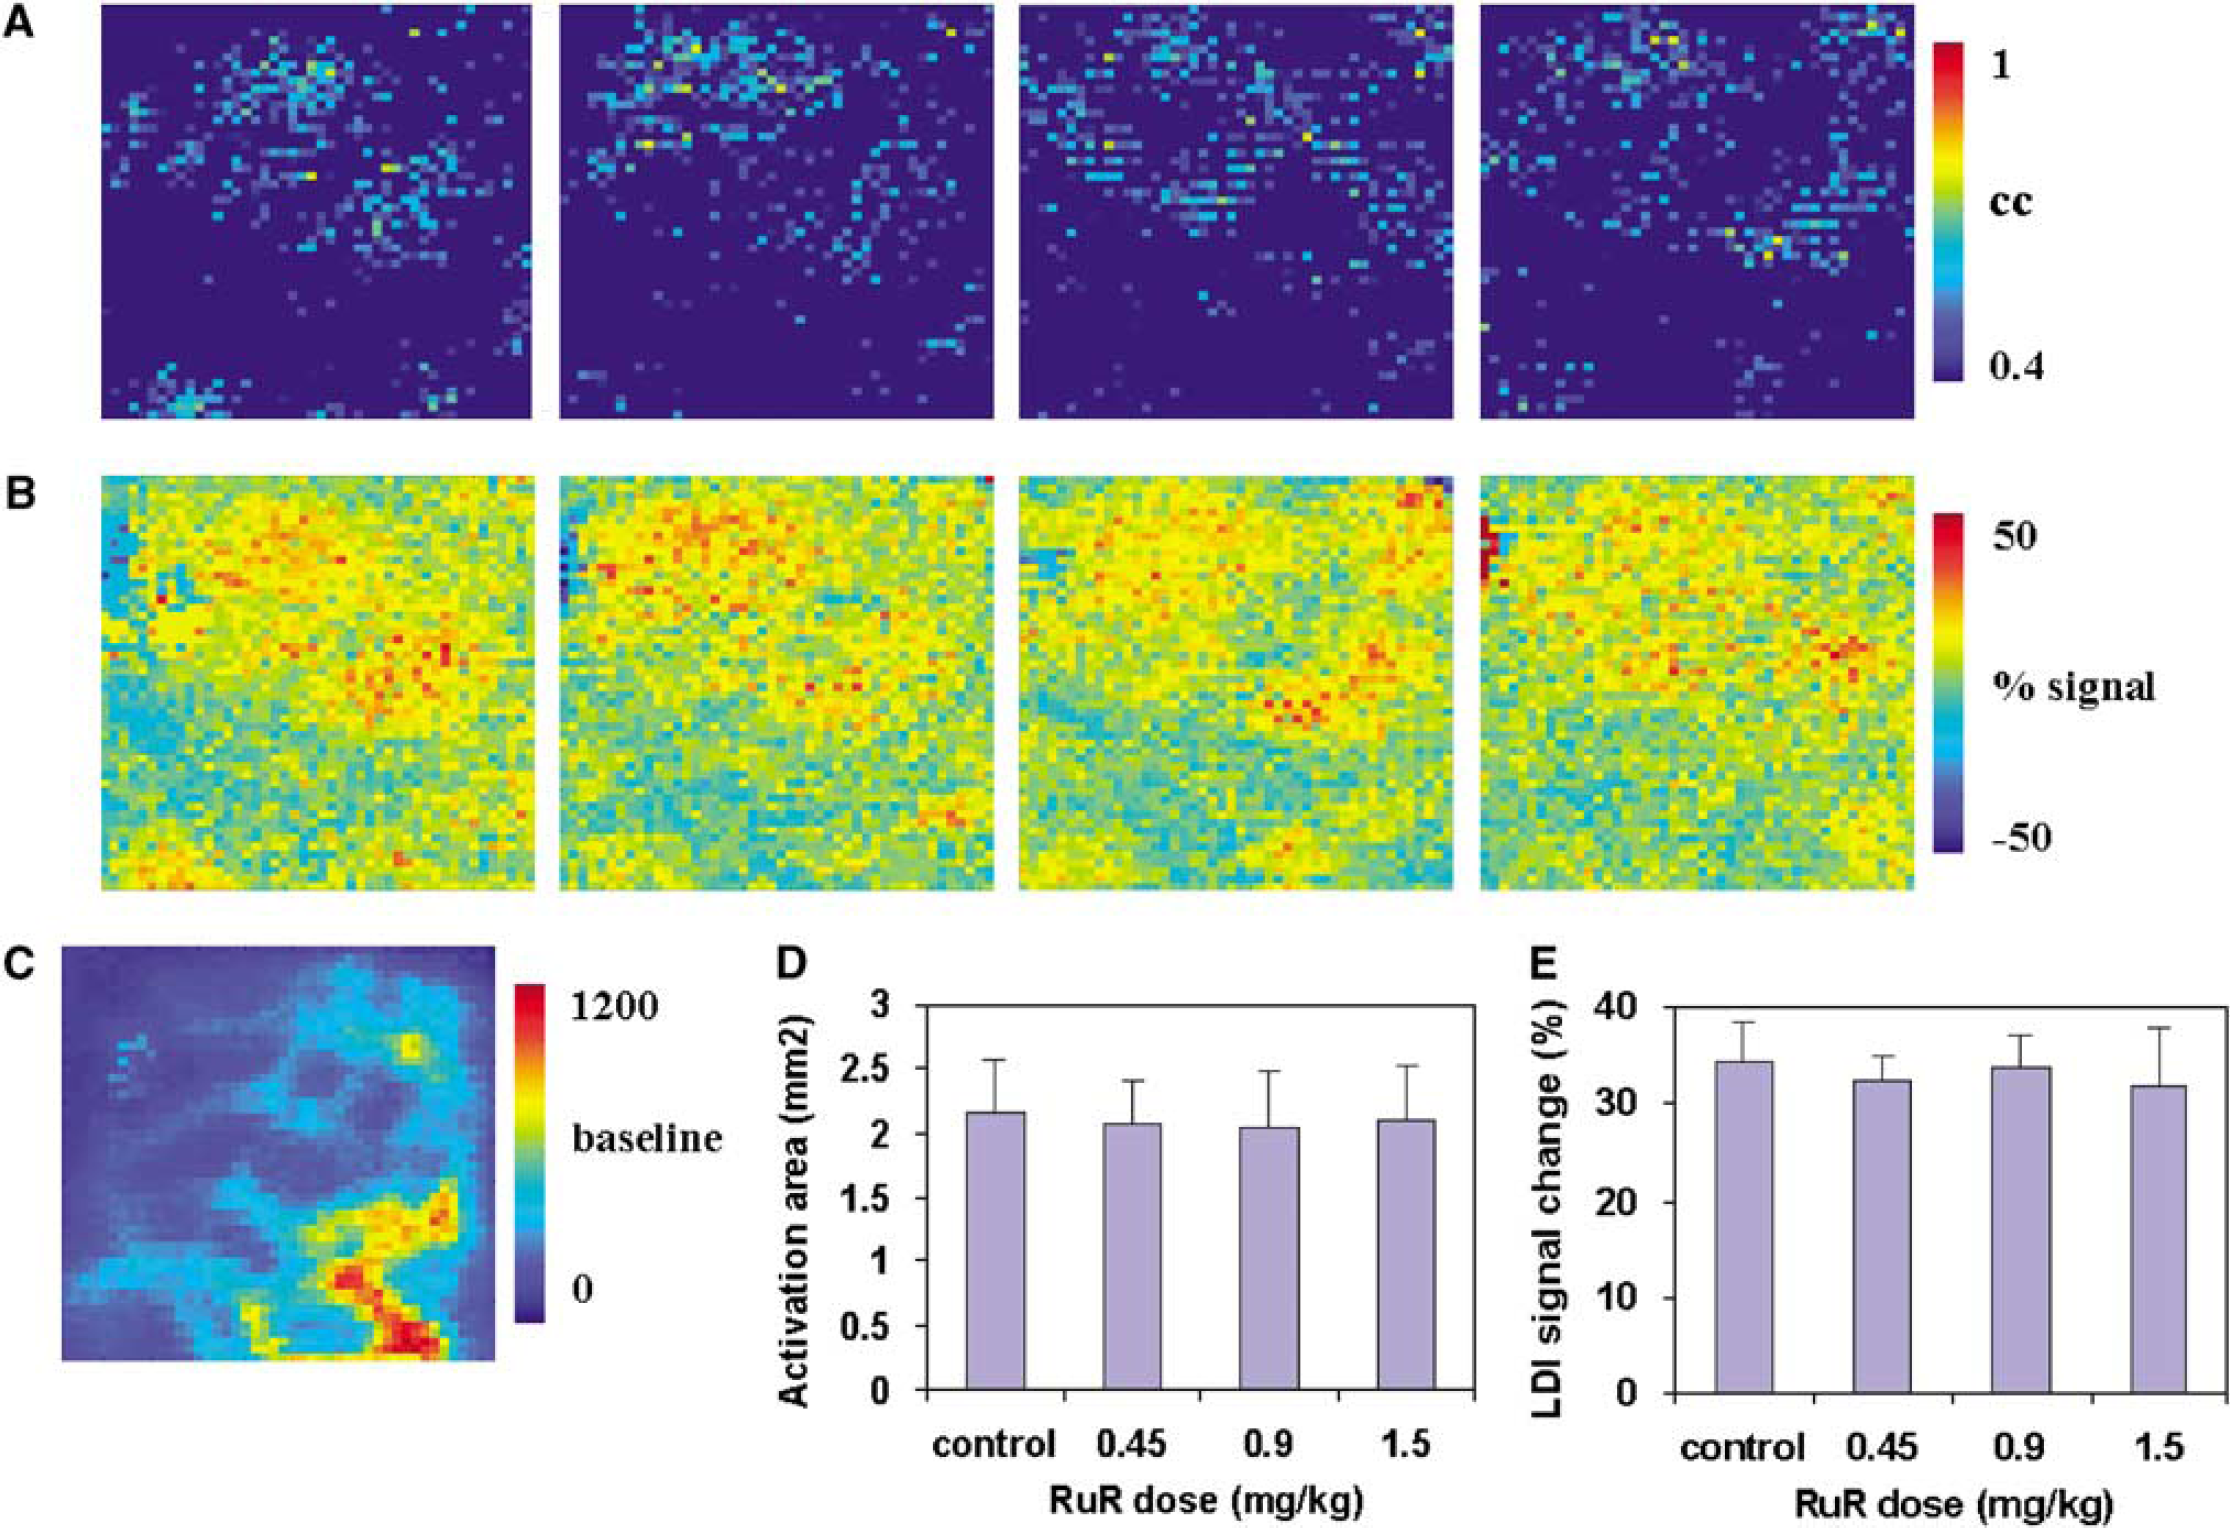
The MCU blockers RuR and Ru360 were initially administered systemically by intravenous infusion. Starting with a dose of 0.15 mg/kg, RuR treatment up to a dose of 4.5 mg/kg led to an increase in the spatial extent and amplitude of LDI activation. Figures 2A and 2B show the effect of RuR (i.v.) on the LDI activation pattern and the amplitude change over the somatosensory cortex in a typical rat during whisker stimulation. The LDI activation area and amplitude change in response to whisker stimulation and treatment with various doses of RuR over all rats are shown in Figures 2C and 2D. The activation area, after an initial increase at lower doses, started to diminish at levels greater than 4.5 mg/kg. The diminished activation area at the highest dose level of RuR (20 mg/kg) was still significantly larger than that obtained in the absence of RuR. Active time controls in the absence of MCU inhibitors (i.v.) were not necessary, as we observed no significant change in the cerebral hyperemic response to whisker stimulation up to 4 h in urethane-anesthetized rats (Kannurpatti and Biswal, 2006).
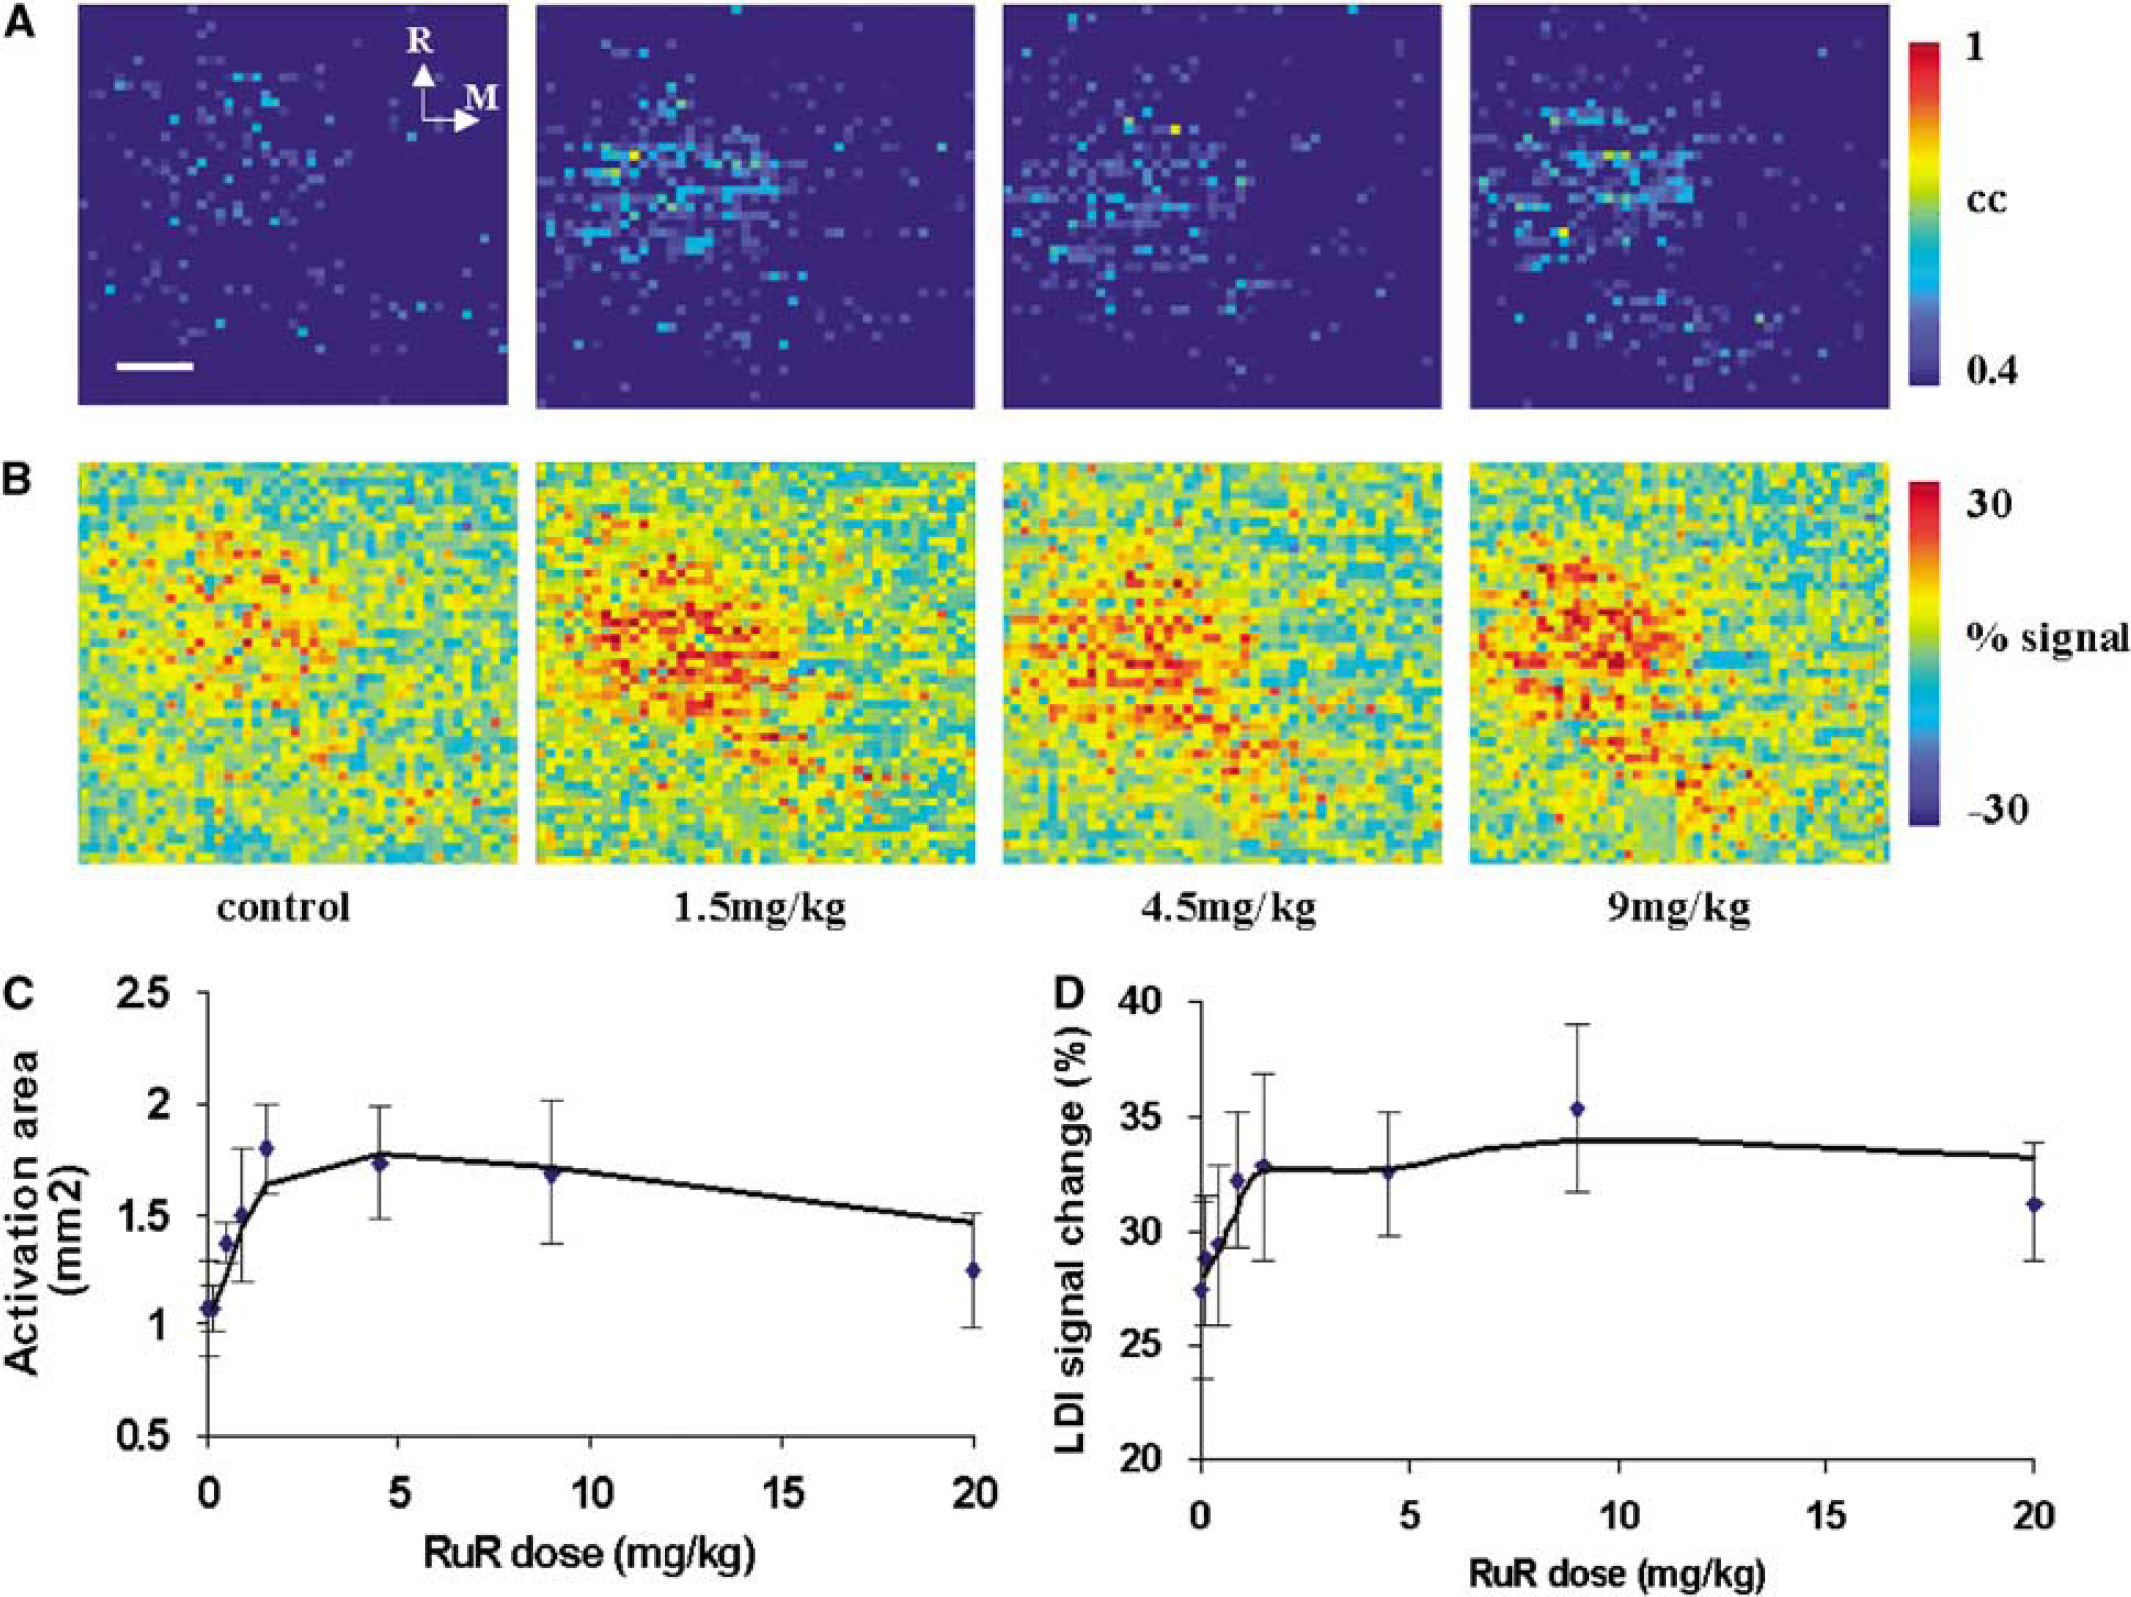
(
Ruthenium red treatment did not have any significant effect on heart rate (HR), MAP, or end-tidal pCO2 (pETCO2) up to a dose of 0.45 mg/kg. However, at higher doses, a decrease in pETCO2 occurred with no significant change in HR or MAP up to a dose of 20 mg/kg. The pETCO2 decreased from 35±2 mm Hg during control conditions to 32±2 mm Hg during treatment with 20 mg/kg RuR.
Average baseline LD flux intensity did not change significantly during treatment with different doses of RuR. In separate experiments (n=3), rats were administered a single dose of 1.5 mg/kg RuR i.v. (a dose that enhanced the activation area by approximately 50%) and the baseline LDI levels were monitored over a period of 180 mins. No significant change was observed in the average baseline LD flux throughout the measurement, and the effect of RuR at a constant dose did not deteriorate the activation-induced CBF response up to 90 mins. Thereafter, the spatial extent of LD activation decreased gradually up to 180 mins. Physiologic parameters such as HR, MAP, and pETCO2 did not change significantly during treatment with 1.5 mg/kg RuR up to 180 mins. These results suggest that RuR in the dose range up to 1.5 mg/kg i.v. does not lead to any systemic physiologic deterioration up to 180 mins, though cerebrovascular response to sensory stimulation deteriorated beyond 90 mins of treatment with RuR.
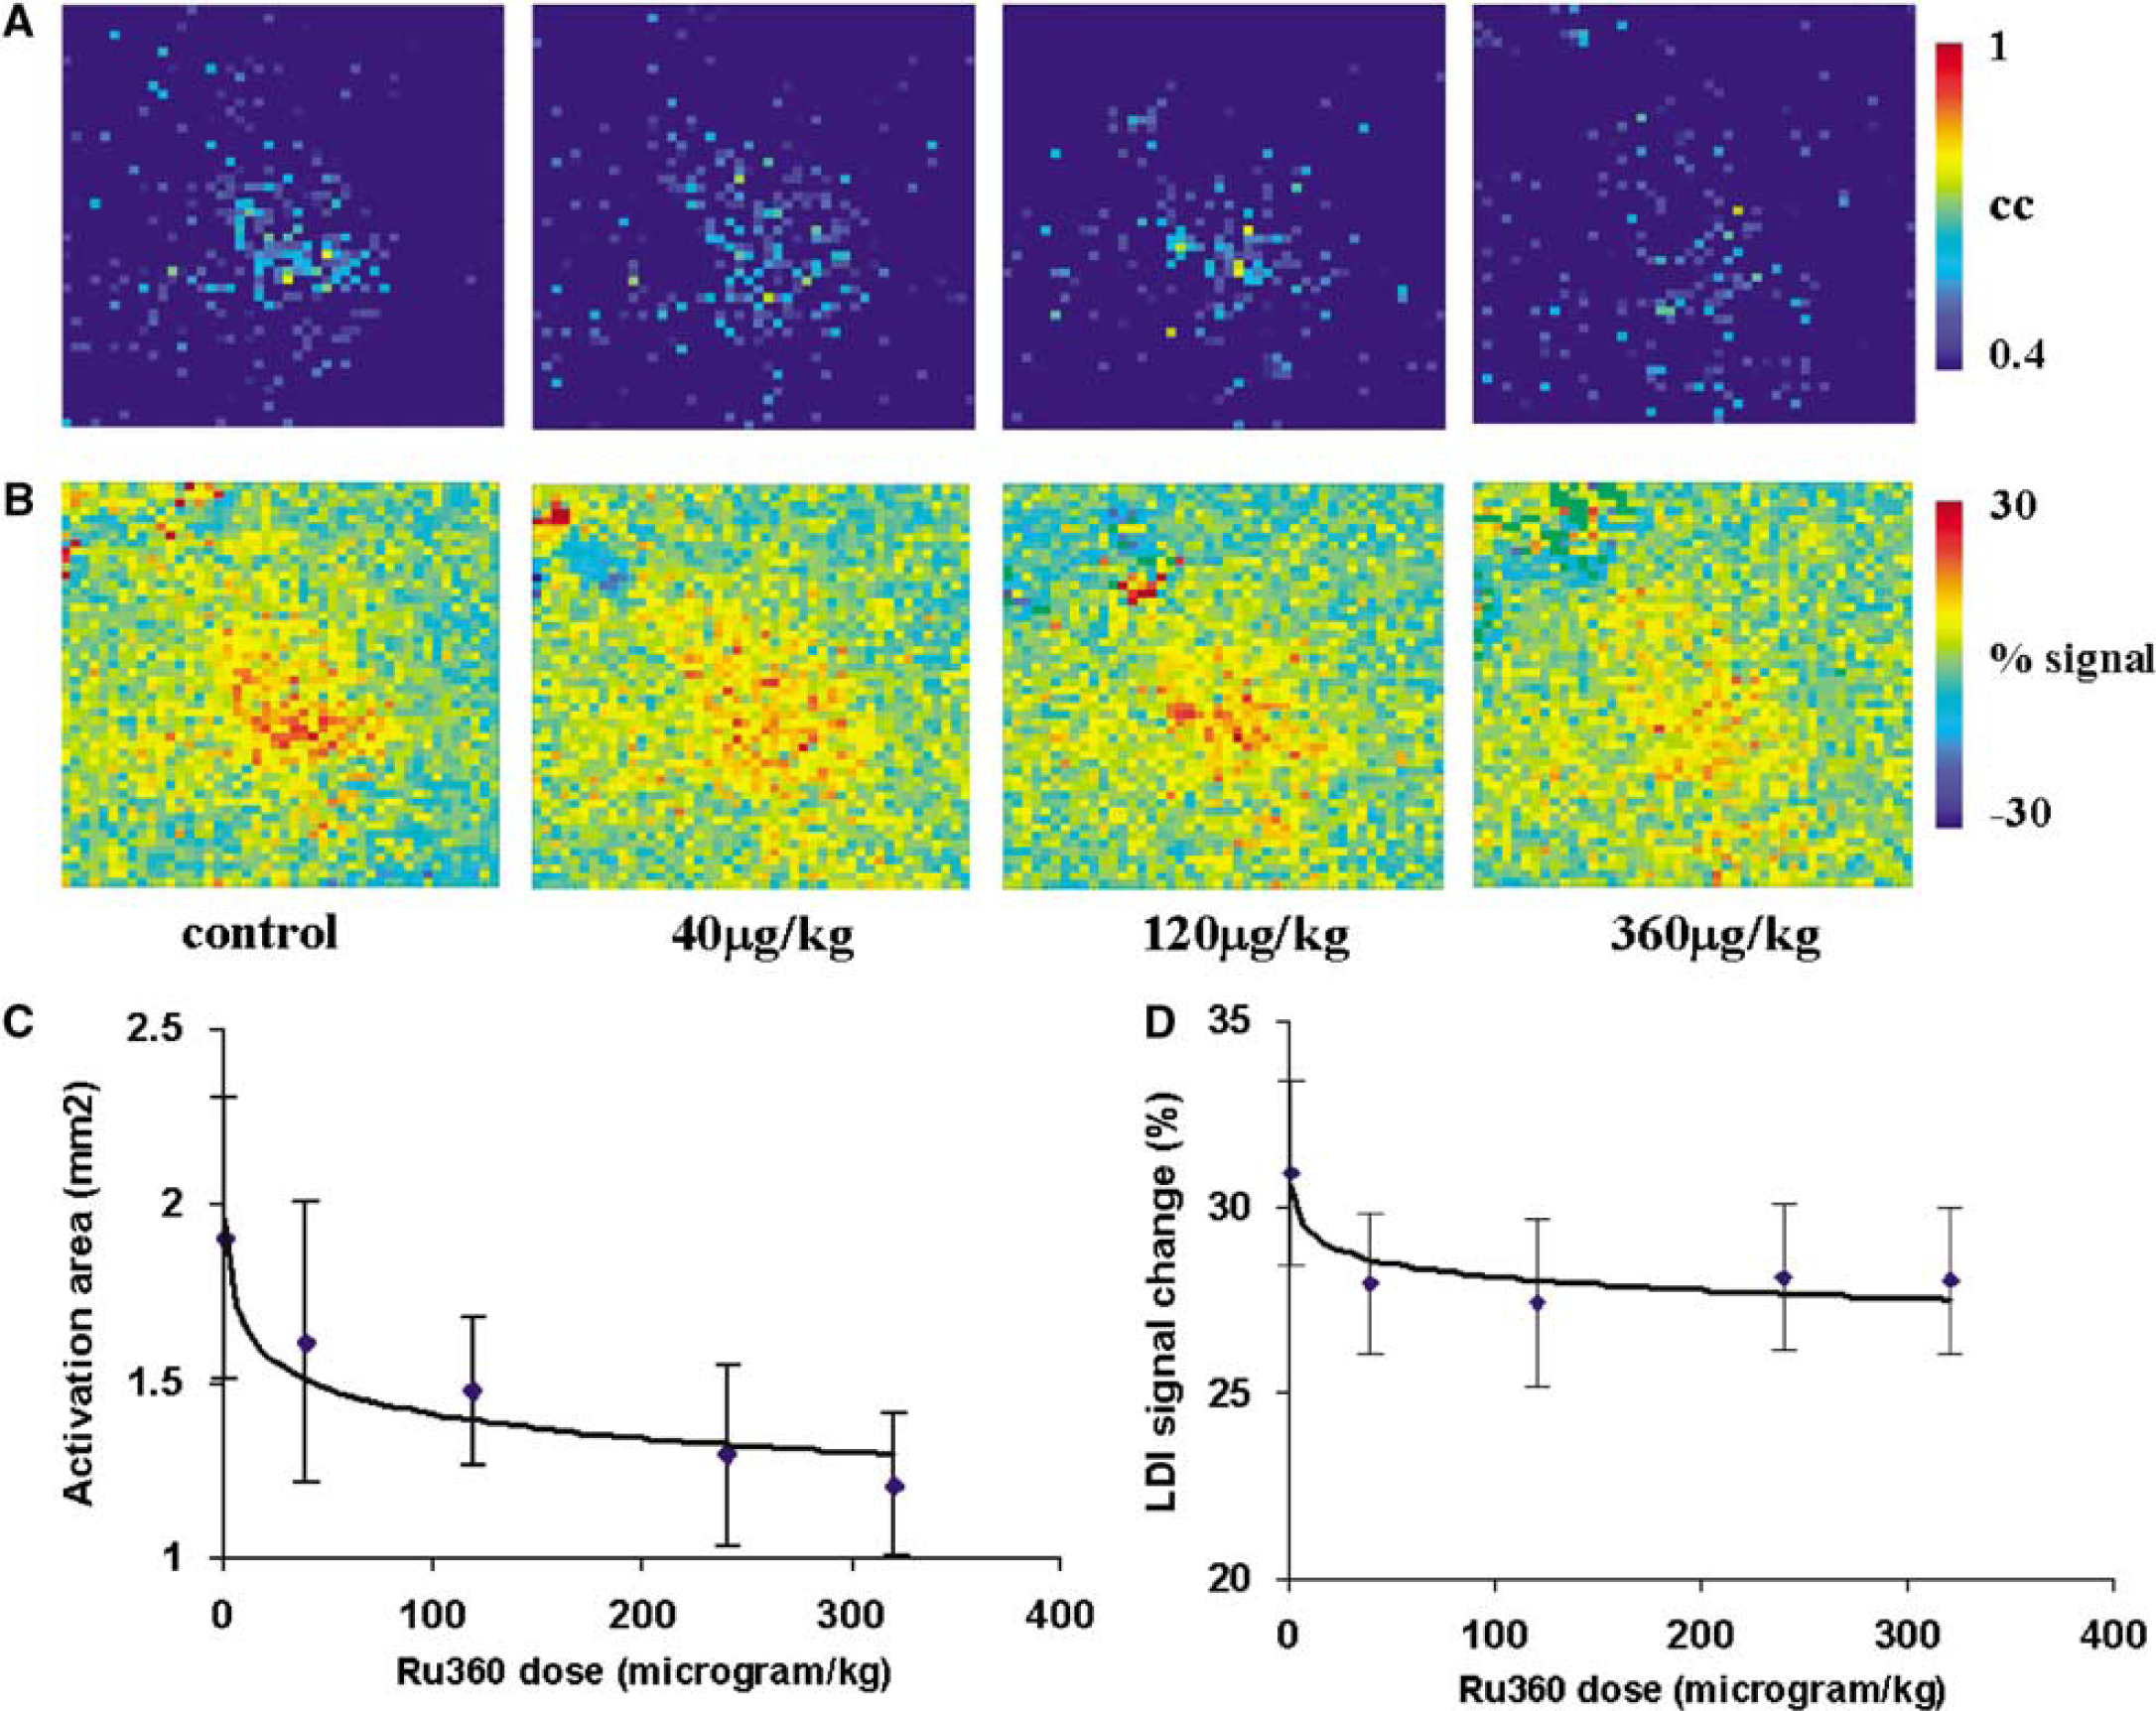
In addition to inhibiting the MCU, RuR may nonspecifically influence central nervous system presynaptic signaling by blocking Ca2+ mobilization through the N- and P-type Ca2+ channels, resulting in reduced release of neurotransmitters (Hamilton and Lundy, 1995). To specifically implicate mitochondrial Ca2+ influx in the activation-induced CBF response, whisker stimulation studies were also carried out in the presence of Ru360, an oxygen-bridged dimeric ruthenium amine complex (Ying et al., 1991). Ru360 is much smaller and a specific inhibitor of the MCU and has been shown to penetrate cells in vitro relatively better than RuR (Matlib et al 1998).
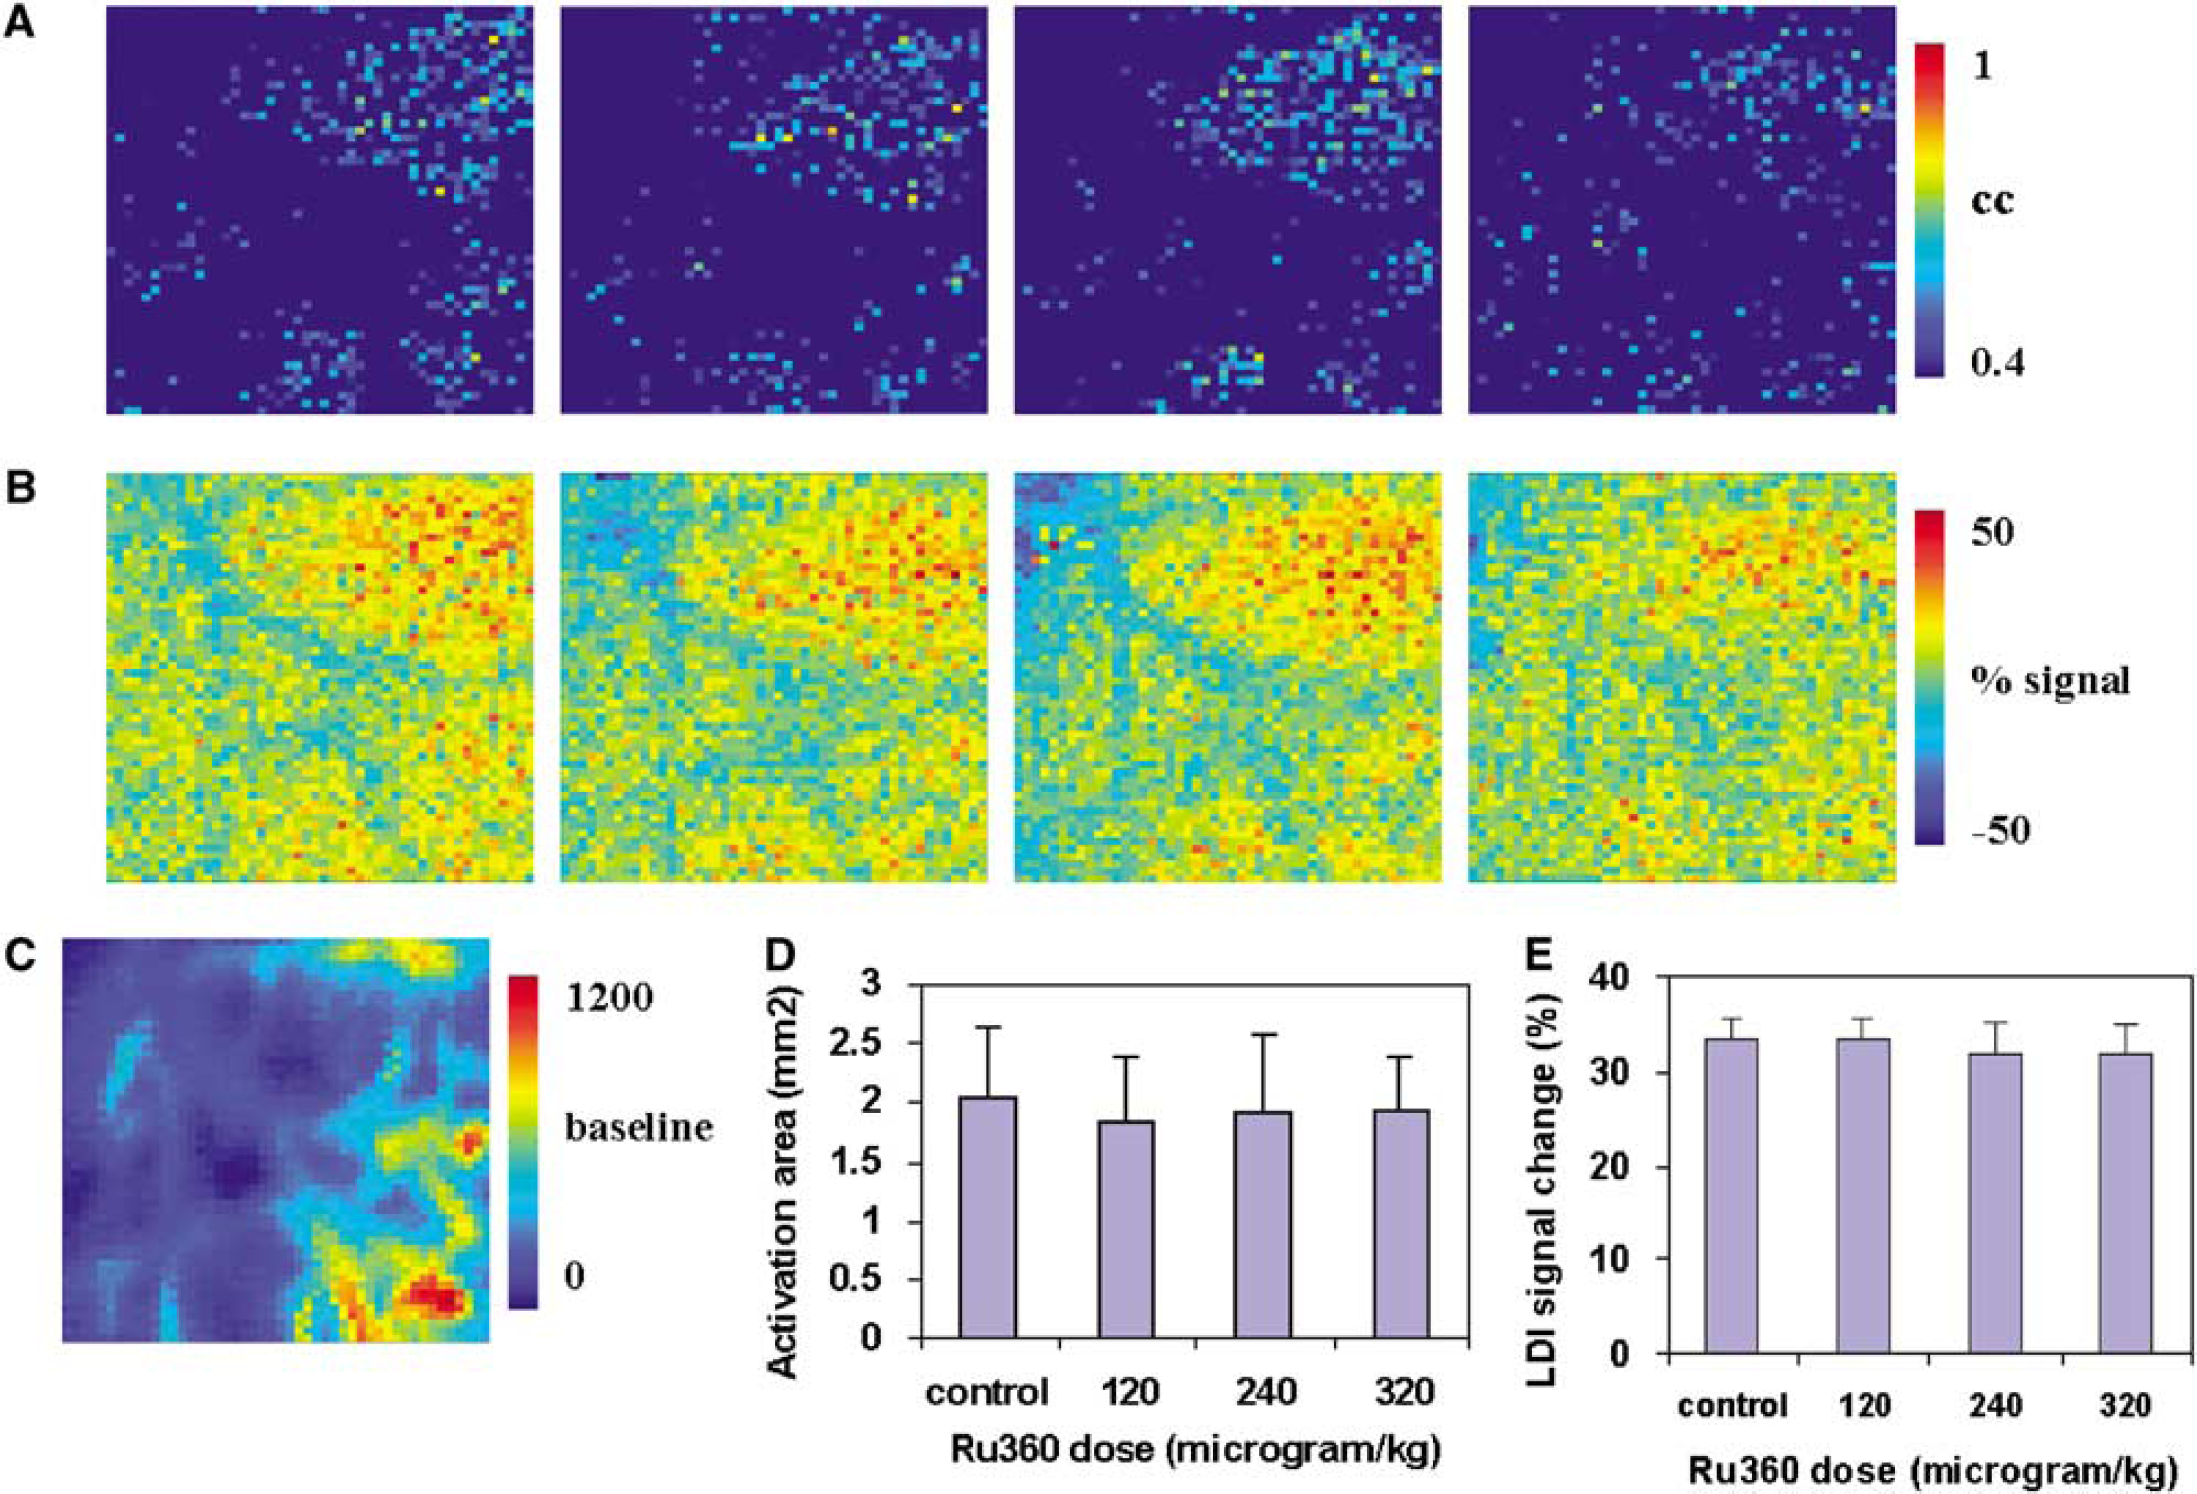
Ru360 treatment up to a dose of 320 μg/kg i.v. led to a decrease in the spatial extent and amplitude of LDI activation. Figures 3A and 3B show the effect of Ru360 on the LDI activation pattern and signal amplitude change over the somatosensory cortex in a typical rat during whisker stimulation. Figures 3C and 3D show the LDI activation area and percent change in LD signal amplitude in response to whisker stimuli with various doses of Ru360 over all rats. The spatial extent and amplitude of the hyperemic response started to diminish significantly at dose levels greater than 80 μg/kg i.v. Ru360 treatment did not show any significant effect on the HR, MAP, or pETCO2 during the complete dose range tested.
(
Intracerebroventricular Administration of Mitochondrial Ca2+ Entry Blockers
Depending on the BBB permeability, efficacy of central nervous system drugs administered systemically may vary. Ruthenium red and Ru360 were administered directly into the brain through an intracerebroventricular injection to avoid confounding effects of BBB permeability.
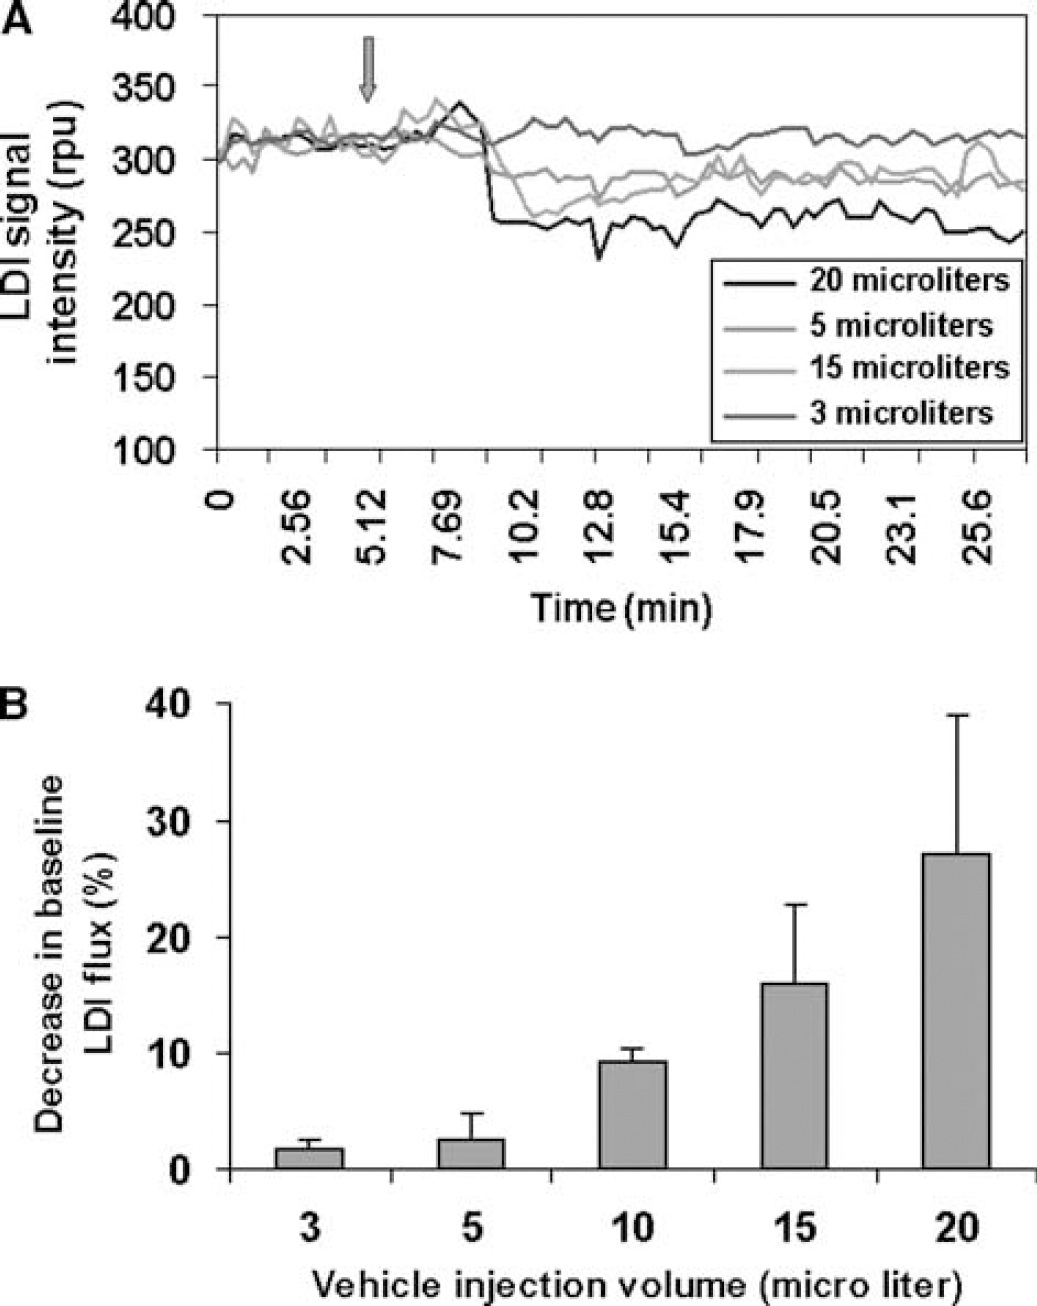
Laser Doppler imaging measurements were sensitive to changes in baseline CBF after i.c.v. injection of vehicle (ACSF) equilibrated with 95% O2+5% CO2 and pH 7.4. The effect of i.c.v. injection of different volumes of vehicle was tested in a separate group of 10 rats. Baseline CBF diminished by approximately 30% when compared to the initial baseline level within the first few minutes after an i.c.v. injection of 20 μL vehicle (Figures 4A and 4B). The decreased baseline CBF was sustained and did not return to control levels even after 2 h after injection. This perturbation in baseline CBF during an i.c.v. injection of 20 μL vehicle gradually decreased with diminished volumes of vehicle injection until no significant change in baseline CBF with an i.c.v. injection volume of 3 μL (Figures 4A and 4B). Thus, single i.c.v. injections of drugs were made in an injection volume of 2.5 μL.
(
Laser Doppler imaging measurements were started 20 mins after the i.c.v. infusion. Ruthenium red has been shown to be potent in its action on mitochondria; however, it can take up to 10 mins to take effect, as indicated by in vitro studies. Although changes in baseline CBF occurred during the i.c.v. injection of RuR, LDI measurements of whisker activation response after treatment with RuR were made with a 20 mins delay post-RuR infusion. For active time control comparisons, LDI measurements after vehicle infusion (i.c.v.) were made at temporal durations similar to the first and second doses of RuR or Ru360 in a separate group of rats (n=3). No significant change in the whisker stimulation-induced hyperemic response was observed during vehicle administration at both times when compared to control conditions. Comparison of hyperemic responses after administration of the MCU inhibitors was made with the appropriate time-controlled vehicle.
A volume of 2.5 μL of 5.8 mmol/L solution of RuR in ASCF (14.5 nmol) was injected directly into the lateral ventricle on the contralateral hemisphere of the rat brain. Ruthenium red treatment led to a decrease in the amplitude and spatial extent of LDI activation in response to whisker stimulation when compared to control or vehicle conditions. Figures 5A and 5B show the LDI activation pattern and change in LD signal amplitude over the somatosensory cortex determined by averaging three identical experimental trials in a typical rat. The LDI signals were measured in response to whisker stimuli during control conditions, after i.c.v. injections of vehicle corresponding temporally to RuR infusion and after i.c.v. injection of 14.5 or 29 nmol of RuR, respectively. Figures 5C and 5D show the LDI activation area and normalized signal amplitude change in response to whisker stimuli after injection of two different doses of RuR over all five rats. No significant change was observed either in the amplitude or in the spatial extent of the whisker activation-induced LD signal change after injection of vehicle (ACSF) when compared to the control. The spatial extent and amplitude of the hyperemic response diminished significantly at the dose level of 14.5 nmol, with a further decrease in the LDI response with 29 nmol RuR (P<0.05; t-test; compared to the respective vehicle condition). Ruthenium red infusion at both doses did not lead to any significant effect on the HR, MAP, or pETCO2. Figure 4E shows the postmortem brain of the same rat after completion of the experiment. Robust staining of RuR was observed throughout the lateral ventricles on either hemisphere including the third ventricle. The higher magnification image shows the penetration of RuR into the brain parenchyma and surrounding tissue adjoining the ventricular space. Also, the presence of RuR in the subarachnoid space indicates that it may easily reach the pial surface, including Virchow Robin's spaces (Ghersi-Egea et al, 1996).
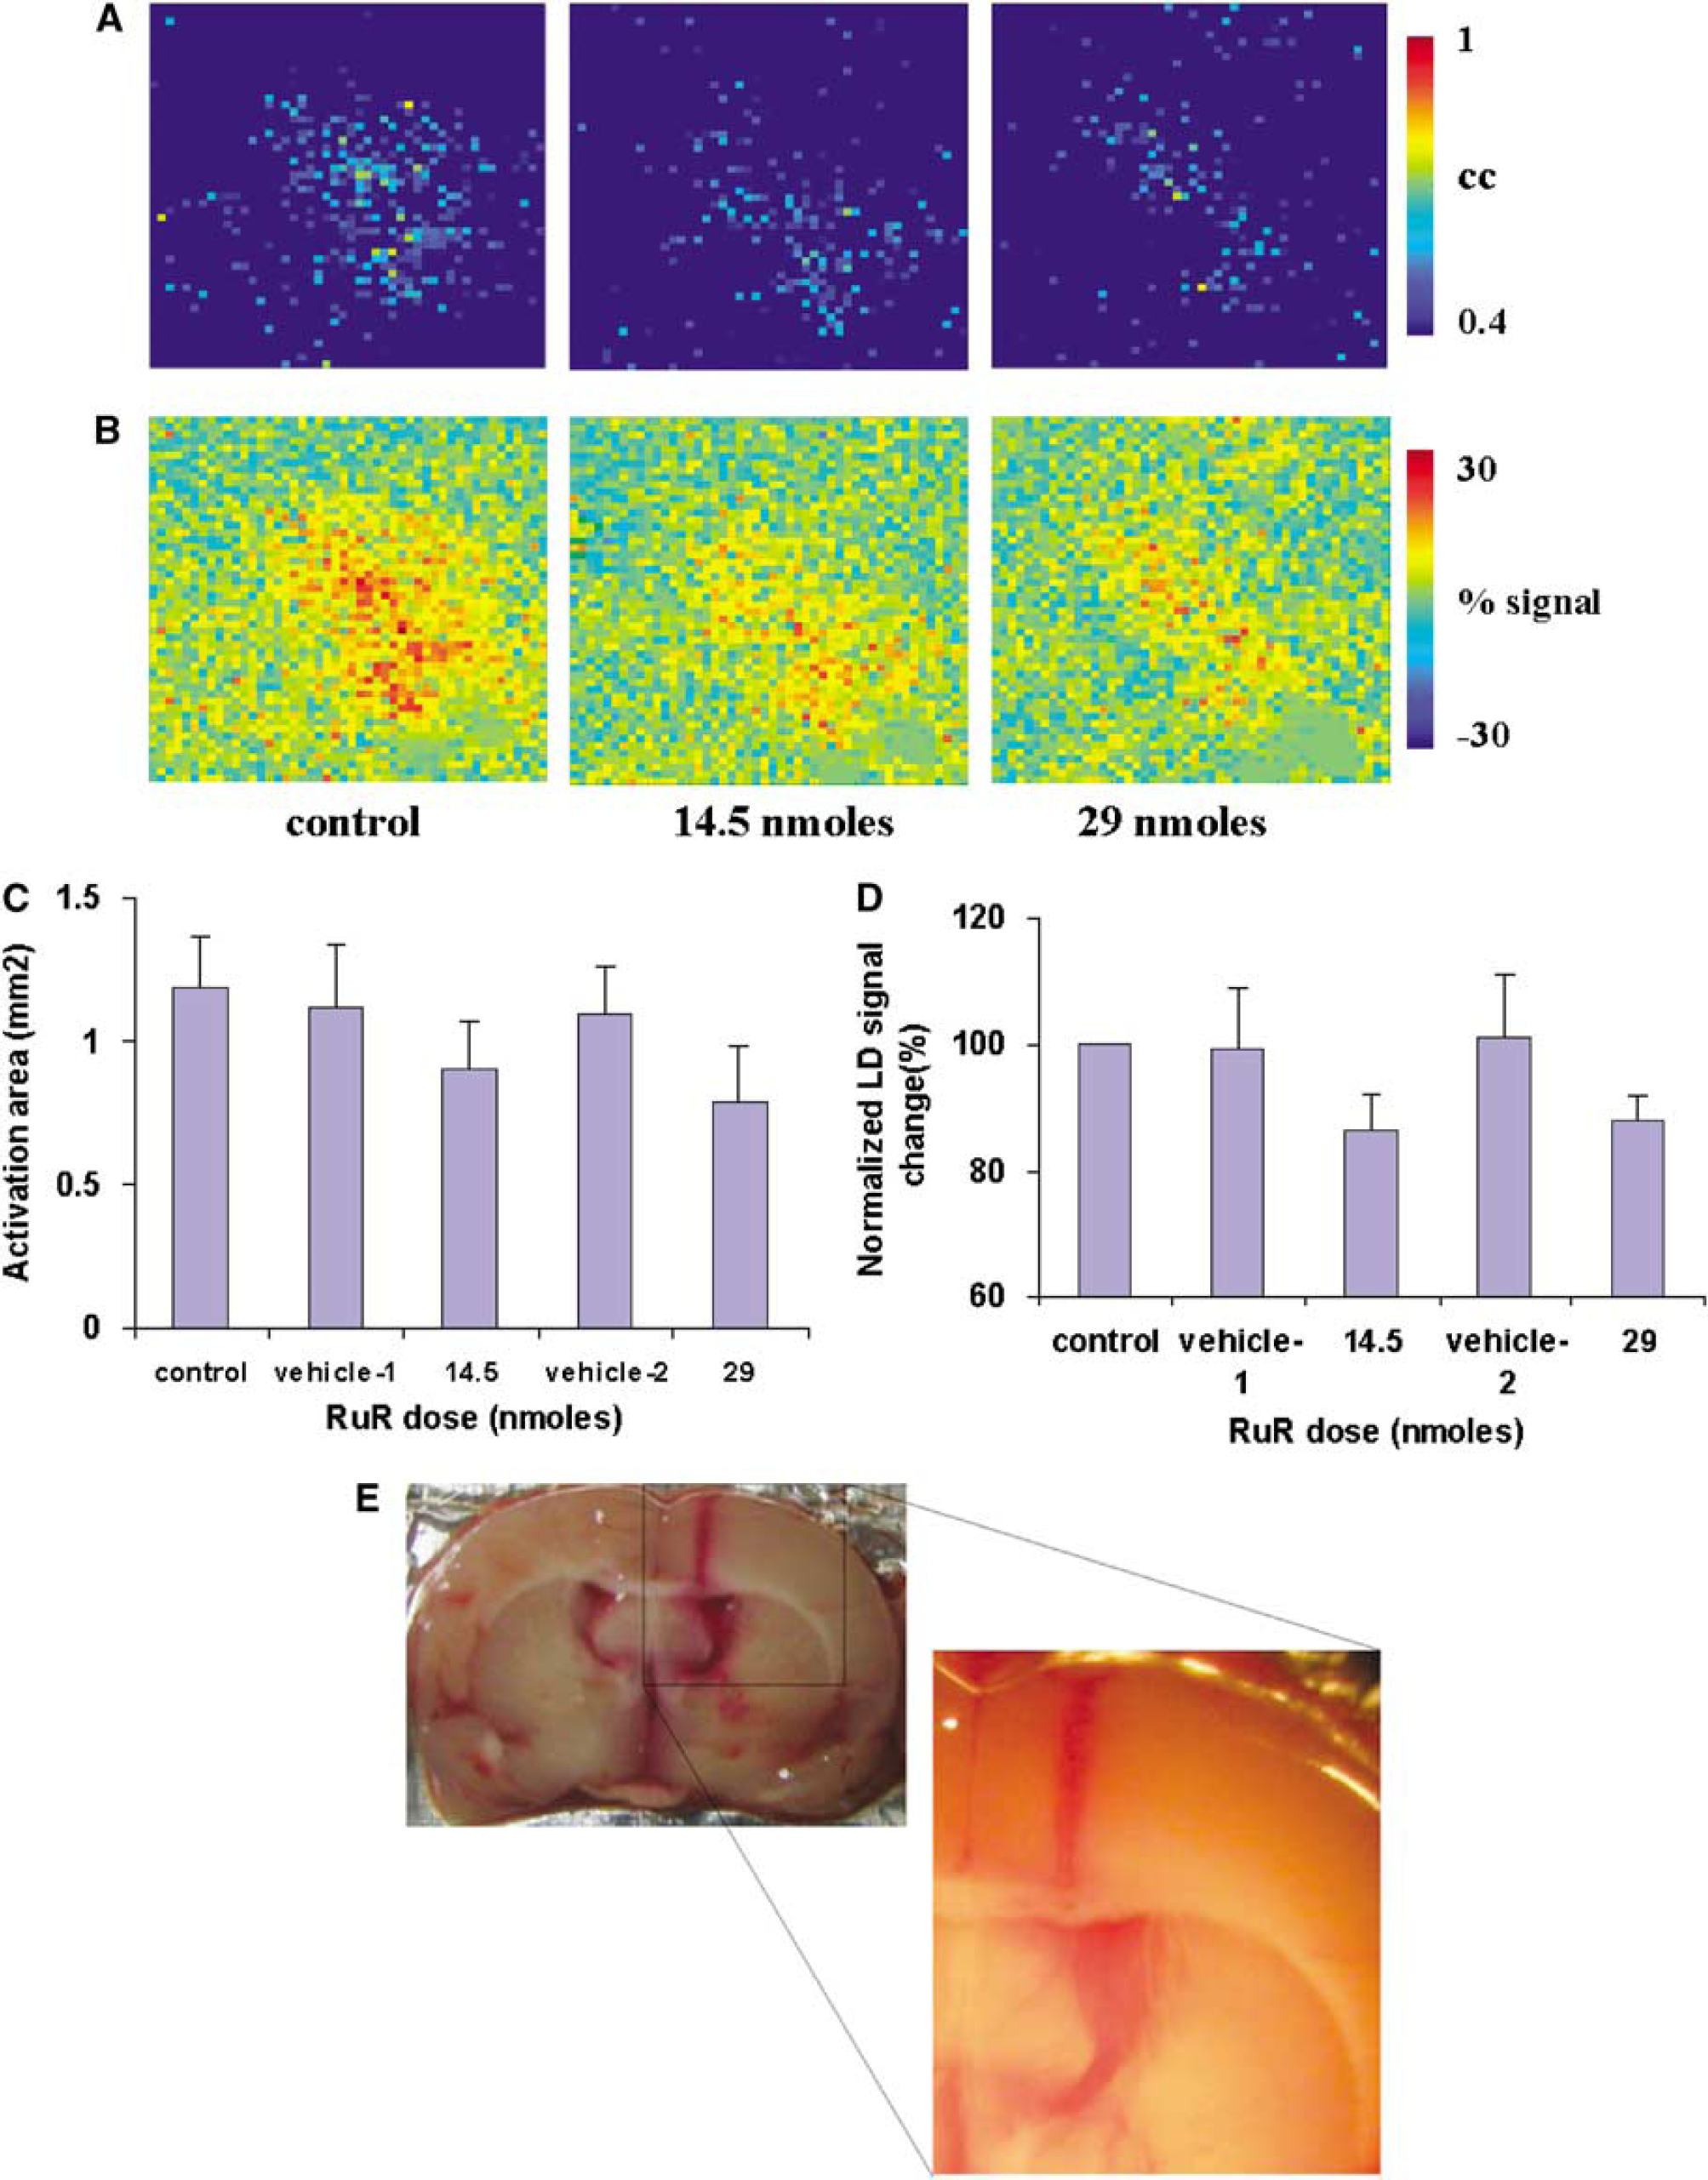
(
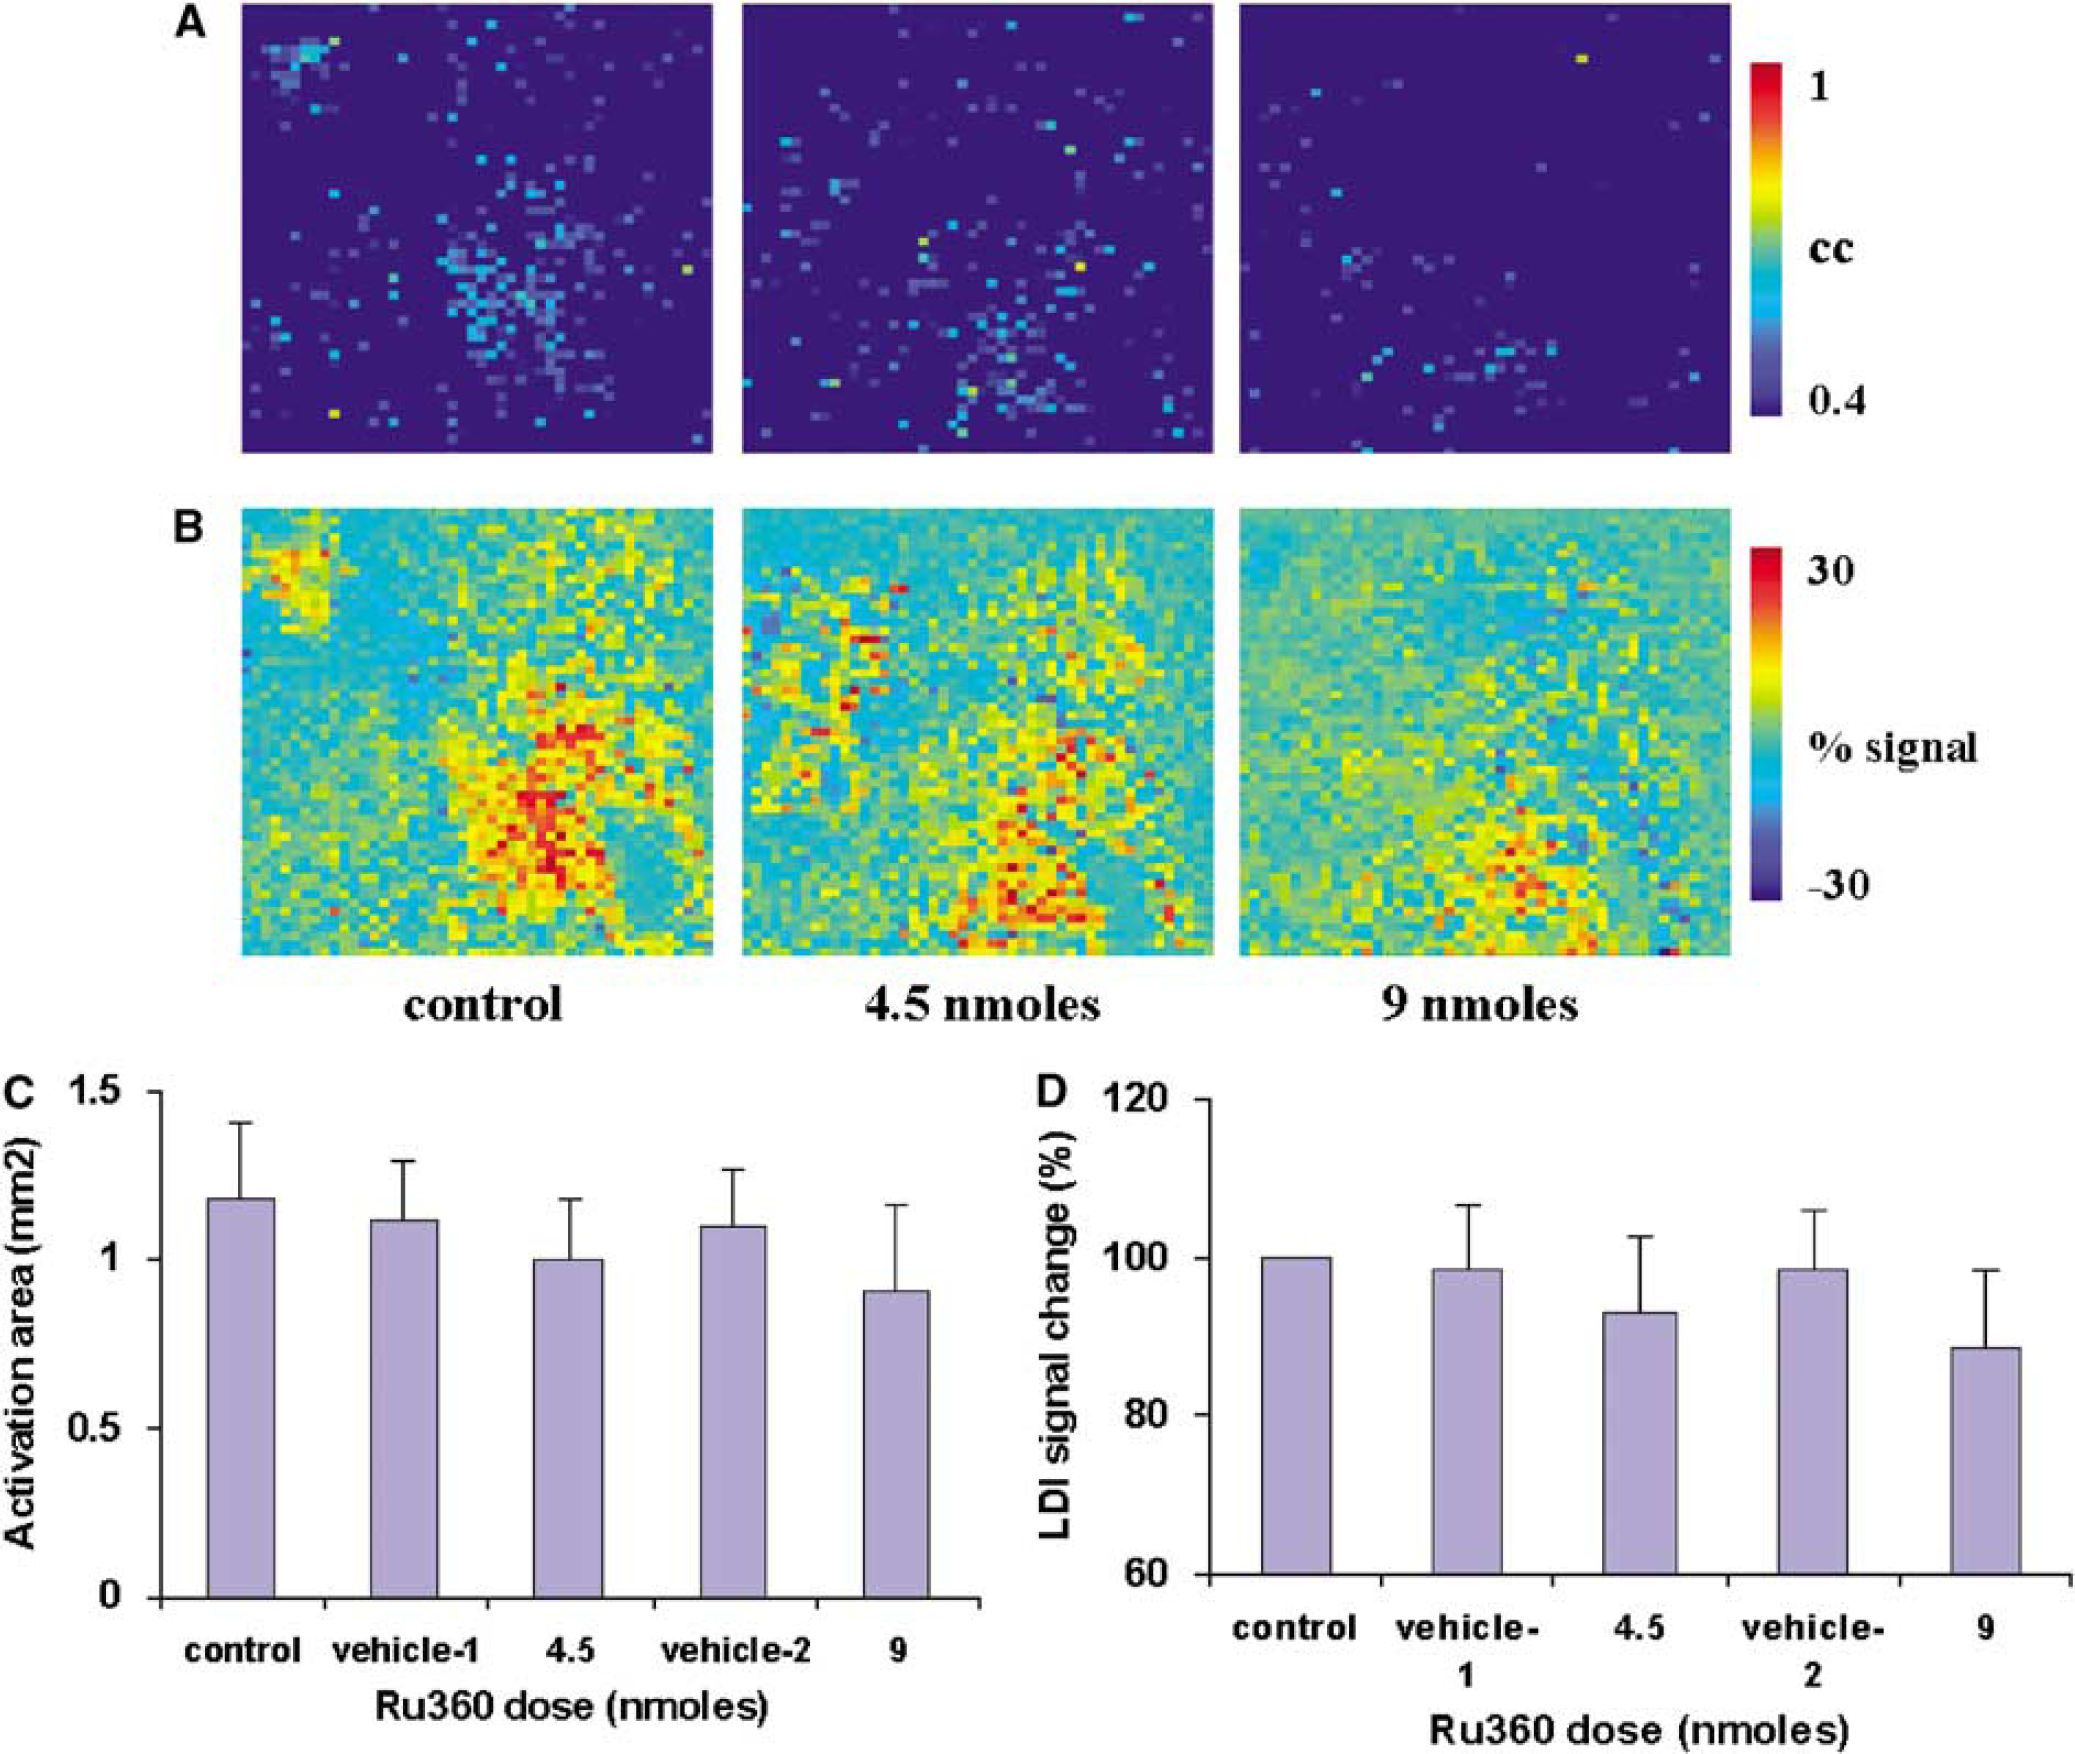
Specific MCU inhibition was achieved using the direct infusion of Ru360 into the brain. A volume of 2.5 μL of fresh 1.8 mmol/L solution of Ru360 in ACSF (4.5 nmol) was injected into the lateral ventricle on the contralateral hemisphere. Laser Doppler imaging measurements were started 30 mins after injection. Laser Doppler imaging signals were measured in response to whisker stimuli during the control condition, after i.c.v. injection of vehicle or after injection 4.5 and 9 nmol of Ru360, respectively. The Ru360 treatment led to a decrease in the amplitude and spatial extent of LDI activation in response to whisker stimulation when compared to control or vehicle conditions. Figures 6A and 6B show the LDI activation pattern and percent change in LD signal amplitude over the somatosensory cortex determined by averaging three identical experimental trials in a typical rat treated with Ru360. Figures 6C and 6D show the LDI activation area and normalized percent change in LD signal amplitude in response to whisker stimuli after injection of two different doses of Ru360 over all five rats. No significant change was observed either in the amplitude or in the spatial extent of the whisker activation-induced LD signal change after injection of vehicle (ACSF). The spatial extent and amplitude of the hyperemic response diminished significantly at the dose level of 4.5 nmol, with a further decrease in the LDI response with 9 nmol RuR (P<0.05; t-test compared to the respective vehicle condition). Ru360 infusion at both doses did not lead to any significant effect on the HR, MAP or pETCO2.
(
To test any direct effects of the MCU inhibitors RuR or Ru360 on cerebral smooth muscle and microvascular endothelial cell functions, cerebrovascular reactivity to hypercapnia was studied in the absence and presence of the MCU inhibitors. In a separate group of rats, RuR or Ru360 was infused i.v. at three different doses that earlier altered cerebral hyperemic response to whisker stimulation. Laser Doppler imaging signal time series from the experimental trials for each treatment condition were crosscorrelated with a reference function similar to the timing of the brief hypercapnia stimulus on a pixelwise basis. The crosscorrelation coefficients were used to detect activated pixels in response to hypercapnia. Laser Doppler imaging flux increased globally in response to the brief hypercapnic stimulus. However, no significant difference was observed in the hypercapnia-induced LDI flux increase in the presence or absence of RuR (Figure 7) or Ru360 (Figure 8).
(
(
Discussion
This study presents evidence through pharmacological blockade of the MCU to support the hypothesis that acceleration of oxidative energy metabolism in neural cells during sensory stimulation leads to an increase in CBF in the activated region.
Reliability of Ruthenium Red and Ru360 as Neuroactive Agents In Vivo
Ruthenium red has been successfully used to prevent mitochondrial calcium influx in mitochondrial organelle preparations from biological tissues (Nicholls, 1978; Gunter and Pfeiffer, 1990), cultured neurons (Peng et al, 1998; Wang and Thayer, 2002; Galindo et al, 2003), cultured astrocytes (Dallwig et al, 2000), and perfused brain slices (Kannurpatti et al, 2000). Although RuR has been deemed a difficult compound to penetrate cultured cells in vitro, it can penetrate brain tissue and has been shown in the synaptosomal fraction. When applied systemically, RuR incorporates into the brain tissue through regions devoid of BBB (Velasco et al, 1990). Hence, we adopted two modes of delivery, namely i.v. or i.c.v., to address concerns of RuR's penetrating ability through the BBB when delivered i.v.
As RuR enters the brain through regions devoid of the BBB (Velasco et al, 1990), it is likely that the enhancement in the amplitude and in the spatial extent of activation-induced CBF response during exposure to RuR i.v. may be because of effects other than MCU inhibition owing to its limited BBB permeability. Nonspecific effects of RuR on cerebral endothelial and arterial smooth muscle cells can be ruled out as no significant change in the hypercapnia-induced cerebrovascular reactivity was observed in the absence or presence of RuR (i.v.) (Figure 7). Also, optical absorption by RuR on the measured LDI signal is highly unlikely as the absorption maximum of RuR was 540 nm with very negligible absorption at 633 nm, the wavelength at which the LDI measurements were made. Furthermore, no significant effect of RuR on the optical measurement was apparent as the normalized baseline LDI flux intensity remained unchanged after administration of various doses of RuR (i.v.) (Figure 1A).
Ruthenium red has been shown to exhibit nonspecific effects in the central nervous system such as altered presynaptic signaling. Prevention of Ca2+ mobilization via N- and P-type Ca2+ channels by RuR can lead to a reduced release of neurotransmitters (Hamilton and Lundy, 1995). In vitro studies indicate that RuR can block Ca2+ influx into synaptosomes, mostly through P- and N-type voltage-gated Ca2+ channels, and hence Ca2+-dependent release of neurotransmitters, including γ-aminobutyric acid, glutamate, and acetylcholine (Tapia et al, 1985; Hamilton and Lundy, 1995). Whereas the enhancement in the whisker stimulation-induced hyperemic response in the presence of RuR (i.v.) needs further studies to clarify its action in vivo, the conclusions regarding mitochondrial Ca2+ signaling can be reliably based on the consistent effects of RuR (i.c.v.) and the more specific MCU inhibitor Ru360.
Ru360 has been shown to permeate cells in vitro (Zazueta et al, 1999), and has a relatively better bio-availability to mitochondria in vivo than RuR. Recent studies on perfused rat hearts have shown that Ru360 concentrations of less than 5 μmol/L were found to have no effect on the contractile force. Higher concentrations of Ru360 (15 to 25 μmol/L) depressed the contractile force development and elevated the resting tension (de Jesus Garcia-Rivas et al, 2005). No evidence yet exists regarding the BBB permeability of Ru360; however, the in vivo effects elicited by Ru360, when administered i.v. or i.c.v. with significant reduction in the activation-induced CBF response, indicate that Ru360 delivered i.v. can penetrate the BBB. In this study, the dose range of Ru360 was adjusted assuming a CSF volume of 300 to 500 μL for a rat weighing 250 to 300 g. A volume of 2.5 μL of 1.8 mmol/L solution of Ru360 delivered i.c.v. would lead to a CSF concentration range of 10 to 20 μmol/L comparable to the dose used in perfused hearts (de Jesus Garcia-Rivas et al, 2005).
Change in systemic physiology such as MAP and pETCO2 influence functional imaging signals. Although RuR in doses below 10 mg/kg i.v. enhanced the area of activation in the whisker-induced CBF response, doses above 10 mg/kg i.v. led to a gradual decrease in the area of activation with a significant decrease in pETCO2 (Figure 2C). Despite no significant change in the amplitude of the LD signal change at all doses of RuR (i.v.), the gradual reduction in the hyperemic response is more likely due to a less physiologically stable condition of the rats or setting in of a functional compromise in the time frame of 2 to 3 h arising from neurotoxic effects of RuR (Velasco et al, 1995). Furthermore, MAP or pETCO2 remained unchanged during treatment with 1.5 mg/kg RuR up to 120 mins, which indicates that RuR in the dose range of up to 1.5 mg/kg administered i.v. does not seem to result in any systemic physiologic perturbation or any functional signs of physiologic compromise up to 120 mins. Ru360 administered i.v. or i.c.v. did not significantly alter MAP or pETCO2 at all dose ranges used in this study and was well suited for in vivo functional neuroimaging studies without any peripheral physiologic confounds.
Mitochondrial Ca2+ Uniporter and Regulation of Cellular Energy Metabolism
Free calcium ions (Ca2+) are maintained at a very low level in cultured neural cells (100 to 200 nmol/L) compared with the extracellular medium (1.5 to 2.0 mmol/L). Such a large difference in Ca2+ concentration leads to a substantial electrochemical gradient. Ca2+ can quickly move into the cells through various Ca2+ channels during signaling events such as release of neurotransmitters, hormones, and expression of genes. Specific intracellular organelles, including mitochondria, shape cytoplasmic Ca2+ transients and serve as a calcium sink in the brain (Budd and Nicholls, 1996; Kannurpatti et al, 2000). Uptake of Ca2+ into mitochondrial matrix is catalyzed by an electrophoretic uniporter, which is driven by the membrane potential constituent of the respiratory proton motive gradient Δψm (approximately −180 mV) (Gunter and Pfeiffer, 1990). Mitochondrial Ca2+ uptake is very rapid and gets activated when the average concentration of free cytosolic calcium ([Ca2+]i) rises over a level of approximately 500 nmol/L. Uptake of Ca2+ into the mitochondria is a potent stimulus for the acceleration of tricarboxylic acid cycle and consequently electron transport via activation of Ca2+-sensitive mitochondrial dehydrogenases (McCormack et al, 1990; Duchen, 2000). Hence, mitochondrial Ca2+ influx can augment the ATP synthesis rate to meet heightened energy demand during neural activity in addition to glycolysis.
During cellular signaling events involving Ca2+, mitochondria accumulate significant amounts of Ca2+ from the cytosol through the MCU located in the organelle's inner membrane. Ca2+ ions are also actively cycled by mitochondria through efflux of Ca2+ via the mitochondrial Na2+–Ca2+ exchanger. The MCU lets Ca2+ down its electrochemical gradient maintained across the mitochondrial inner membrane without any ATP hydrolysis or cotransport of other ions. Ru360 inhibits Ca2+ currents through the MCU channel in a dose-dependent manner (IC50=0.18 to 2 nmol/L) and is a more potent and specific inhibitor than RuR (IC50=6.9 to 9 nmol/L) (Matlib et al, 1998; Kirichok et al, 2004). As Ru360 was several-fold potent in inhibiting the MCU when compared to RuR, the lowest dose of RuR used in this study was 3- to 4-fold higher than Ru360.
Mitochondrial Calcium Uniporter Inhibitors Do Not Directly Affect Cerebrovascular Reactivity
Altered cerebral hyperemic response to whisker stimulation in the presence of MCU inhibitors may also indicate that altered mitochondrial Ca2+ signaling in neural, microvascular endothelial cells, or smooth muscle compartments of the brain tissue. Mitochondria have been shown to regulate local and global Ca2+ signals in cerebral arterial smooth muscle cells. Cheranov and Jaggar (2004) have shown that inhibitors of mitochondrial Ca2+ uptake (Ru360) and release (CGP37157) differentially regulate transient KCa currents in arterial smooth-muscle cells, and suggest that mitochondrial potential may regulate Ca2+ sparks and transient KCa currents by modulating intramitochondrial Ca2+ concentration. We tested the direct effects of the MCU inhibitors on cerebral endothelial or smooth-muscle cells using a purely vasodilatory stimulus. Transient hypercapnia was induced by ventilating the rats with a gas mixture of air+5% CO2 with and without the presence of RuR or Ru360. Although a brief hypercapnia stimulus led to a global increase in the LDI flux, no significant differences were observed in the hypercapnia-induced CBF change in the presence or absence of the MCU inhibitors RuR or Ru360 (Figures 7 and 8, respectively). Lack of significant effect of RuR or Ru360 on the hypercapnia-induced cerebral reactivity over a dose range of the MCU inhibitors indicates that they do not sufficiently alter cerebrovascular smooth muscle or microvascular endothelial cell function that may significantly affect whisker stimulation-induced cerebral hyperemic response. These results indicate that neural mitochondrial Ca2+ signaling predominantly determined the dynamic outcome on the whisker stimulation-induced CBF change.
A Role for Mitochondrial Ca2+ Signaling in Functional Hyperemia
Ru360 is more likely to alter mitochondrial Ca2+ transport due to its specificity and bio-availability (Matlib et al, 1998). Ru360 delivered i.c.v. or i.v. consistently diminished the cerebral hyperemic response during whisker stimulation. Inhibition of the cerebral hyperemic response by Ru360 indicates that, during whisker stimulation, a greater energy demand in terms of glucose and oxygen utilization that occurs under normal circumstances in the brain was not present. Thus, a relatively lesser energy utilization would trigger a relatively smaller activation-induced CBF response. Such a lesser energy utilization, during MCU inhibition, may primarily occur due to nonacceleration of Ca2+-dependent mitochondrial dehydrogenase enzymes (the pyruvate, α-ketoglutarate, and isocitrate dehydrogenases) during evoked neural activation (McCormack et al, 1990; Duchen, 2000). This implicates mitochondrial Ca2+ signaling in increasing regional CBF in response to neural activation. Neurons contain larger mitochondrial density when compared to other cell types in the brain, and the concentration of mitochondria in neuronal dendrites is the largest compared to cell body or axons. Hence, MCU inhibition-induced decrease in the cerebral hyperemic response would be predominantly neuronal.
Two different scenarios that may influence the hyperemic response during mitochondrial Ca2+ blockade can be envisaged. First, a direct neuronal activity inhibition can result as a consequence of mitochondrial Ca2+ blockade resulting in a lower activation-induced CBF response. The trigger for a direct neuronal activity inhibition during MCU blockade can be possible through a feedback inhibition of the glutamate receptor channels by build up of intracellular Ca2+ in microdomains in neurons. The build up of intracellular Ca2+ in microdomains can occur faster when Ca2+ is no longer cleared efficiently by proximal mitochondria due to MCU inhibition. Such a feedback inhibition has been shown to lead to a lesser bulk intracellular Ca2+ by modulating the Ca2+-dependent inactivation of the N-methyl-
Oxidative Energy Metabolism Couples Neural Activation-Induced Cerebral Blood Flow Response
Although neural mitochondrial Ca2+ transport seemed to have a significant impact on the CBF change in response to whisker stimulation, the decrease in hyperemic response saturated (with a maximum of approximately 20% decrease) at higher doses of the MCU inhibitor Ru360. This suggests that acceleration of oxidative metabolism through mitochondrial Ca2+ signaling partially coupled the neural activity to increased CBF. Several other cellular signaling pathways and messengers have been shown to modulate neuro-vascular coupling. Nitric oxide (NO) produced by neuronal nitric oxide synthase is a modulator coupling neuronal activation and regional CBF in the rat somatosensory cortex mediated by cyclic guanosine monophosphate (Lindauer et al, 1999) and has been shown to increase preceding the stimulus-evoked CBF response (Buerk et al, 2003). Also, CBF during neuronal activity can be controlled by cyclooxygenase-2 activity. Cyclooxygenase-2 is a rate-limiting enzyme for prostanoid synthesis and has been shown to have a compartmental distribution in the somatosensory cortical neurons. This is consistent with the local neuronal synthesis of prostanoids, involved in neurovascular coupling, whose actions are modulated by NO (Wang et al, 2005). Mitochondrial Ca2+ influx can regulate mitochondrial NO production. Although the physiologic role of mitochondrial NO is still not very clear, further studies are required to verify such a possibility, given the important role of NO in modulating vascular response to neural stimulation. Using positron emission tomography imaging studies, the cytosolic NADH/NAD+ ratio has been shown to influence activation-induced hemodynamic response (Vlassenko et al, 2006). Using pyruvate to alter the equilibrium of the cytosolic NADH/NAD+ redox state, Vlassenko et al have linked enhanced glycolysis to signaling pathways that regulate CBF in anesthetized rodents and in awake humans. Although glycolysis has been indicated to provide energy during enhanced neural activity with oxidative phosphorylation being the primary source of brain energy production in the baseline state, the present results suggest a role for signaling events linked to oxidative phosphorylation to bring about an increase in CBF during enhanced neural activation.
Conclusion
The results support the influence of neural mitochondrial Ca2+ signaling in determining the dynamic outcome of stimulation-induced functional imaging signals. Saturation of the decrease in the hyperemic response with increasing MCU inhibitor dose suggests a partial role for mitochondrial Ca2+ signaling linked to oxidative phosphorylation in neural activation-induced CBF response.
The reduced hyperemic response during mitochondrial Ca2+ influx inhibition can be attributed to two scenarios: the first is a relatively reduced whisker stimulation-induced neural activity in presence of the MCU inhibitors. As mitochondrial calcium-sequestering ability can control glutamate-induced Ca2+ influx (Legendre et al, 1993; Lieberman and Mody, 1994; Budd and Nicholls, 1996; Hoth et al, 1997; Kannurpatti et al, 2000), this would result in a decreased synaptic activation during whisker stimulation in the presence of MCU inhibitors. In the second scenario, neural activation may remain unaffected; however, a direct inhibition of oxidative energy metabolic acceleration during stimulated neural activity may lead to a lesser glucose and oxygen consumption. Such a decrease in neural energy metabolism can lead to an attenuated cerebral hyperemic response.