
Abstract
The blood oxygenation level-dependent (BOLD) signal is the most commonly used modality of functional magnetic resonance imaging (fMRI) today. Although easy to implement, it is an ambiguous signal since it results from a combination of several hemodynamic factors. Functional cerebral blood flow changes, as measured by using arterial spin labeling (ASL), typically occur in the parenchyma and have been demonstrated to be more closely coupled to neural activation compared with BOLD. However, the intrinsically low signals from ASL techniques have hindered its widespread application to fMRI for basic research and even more so for clinical applications. Here, we report the first implementation of continuous ASL in the anaesthetized macaque at high magnetic field of 7T. The technique was optimized to permit maximum signal-to-noise ratio of functional perfusion-based images at high spatial resolution. The effect of labeling parameters, such as label time and post-label delay (PLD), on functional cerebral blood flow (fCBF) in the visual cortex was evaluated. Functional cerebral blood flow maps did not change with increasing label time after 2,000 ms, indicating that a label time of 2,000 ms is sufficient for reliable mapping of fCBF. The percent changes obtained using fCBF were better localized to gray matter, than those obtained with BOLD. A short PLD of 200 ms revealed significantly higher fCBF changes at the cortical surface, indicating large-vessel contamination, than a long PLD of 800 ms. However, the effect of the PLD on fCBF was smaller than on baseline CBF. These results are of importance for high-resolution applications, and when accurate quantification is required for studies in monkeys as well as in humans.
Introduction
Because arterial spin labeling (ASL) is capable of non-invasively quantifying regional tissue perfusion, perfusion magnetic resonance imaging with ASL has the potential to become a very important tool with wide applicability in both basic and clinical research. Perfusion-sensitive images are generated by inverting or saturating water protons in the blood vessels supplying the region of interest (ROI), typically in the neck, and measuring the resulting intensity changes in the brain (Detre et al, 1992; Dixon et al, 1986; Williams et al, 1992). After each labeled image, a control image is acquired without labeling. The difference between label and control images yields a signal proportional to the local cerebral blood flow (CBF).
The saturation or inversion procedure is commonly designated as labeling or tagging. Spin tagging can be performed with a broadband radiofrequency (RF) pulse over a thick slab (pulsed ASL—PASL) or with a long RF pulse during the application of a slice-selection gradient (continuous ASL—CASL). The advantage of CASL over PASL is that it has a higher signal-to-noise ratio (SNR) and facilitates quantification as well as multislice imaging (Wang et al, 2002; Wong et al, 1998). After the tagging of spins, typically a post-label delay (PLD) is introduced (Alsop and Detre, 1996) to allow the labeled protons to reach the slice of interest, leave the arteries, and perfuse the tissue. Depending on the parameter selection, the tissue or arterial fraction of CBF will be emphasized (Detre et al, 1994).
Perfusion-based fMRI using ASL (i.e., functional CBF (fCBF)) has certain advantages over the blood oxygenation level-dependent (BOLD) contrast mechanism. The BOLD response reflects a combination of increased CBF and CBV, and decreased oxygen extraction fraction, and its tissue specificity is often reduced by large draining veins that are not spatially confined to the area of neuronal activation (Haacke et al, 1994). Experiments in humans (Luh et al, 2000) and rats (Duong et al, 2000) showed that fCBF is more specific to tissue activation than gradient-echo BOLD. For instance, using fCBF, orientation columns with a spacing of ~1.1 mm could be reliably detected in the visual cortex of cats (Duong et al, 2001). Visualization of such structures requires spatial specificity of the functional signal in the submillimeter range. In addition, the quantitative measurements of CBF afforded by ASL facilitate intersubject comparisons, and monitoring of long-term changes within subjects. Last but not least, fCBF can be used to disambiguate the BOLD signal. Davis et al (1998), for example, derived a formalism to calculate the cerebral oxygen rate of metabolism (CMRO2) by combining BOLD and CBF measurements. Experiments assessing the individual contributions of CBF, CBV, and CMRO2 to the BOLD signal have therefore been of particular interest for the study of the physiologic basis of BOLD. This kind of BOLD calibration procedure offers yet another very attractive application of perfusion-based fMRI.
Perfusion-based fMRI is not straightforward in its implementation and application. To obtain highimage quality and spatial specificity, the labeling parameters have to be adapted precisely to the specific purpose. For example, PLD has to be adapted to the arterial transit time (tA—the time it takes for the tag to travel from labeling to imaging plane) for the specific subject and ROI. Arterial transit time is different for each species and its physiologic state, and is altered by changes in blood flow such as those caused by anesthetics or hypercapnia. In the absence of a stimulus, for increasing PLD, the CBF signal changes from being predominantly located in the arterial compartment (at short PLD) to being mostly of capillary origin (for PLD ≈ tA). With increasing PLD, the signal from the extravascular compartment starts to dominate (PLD > tA). Quantification of CBF typically requires a PLD longer than the maximal tA in the ROI (Alsop and Detre, 1996; Wong et al, 1998). However, it is not clear whether the different vascular compartments make the same relative contributions to the fCBF map as to the baseline CBF map. The influence of PLD on functional activation was investigated by Gonzalez-At et al (2000), who reported a decrease in the tA by visual and motor activation in humans at 1.5T. Such a decrease in tA as a consequence of locally increased CBF does not have to be confined to the area of neural activity. At a resolution of 3.75 × 3.75 × 8 mm3 they did not observe differences between the activation maps acquired at different PLD. To determine more directly the contribution of intravascular signals to the functional activation maps obtained with CASL, its dependence on labeling parameters has to be determined at higher spatial resolution. We hypothesize that fCBF at short PLD will also to some extent be confounded by intravascular signal.
Finally, it is important to optimize ASL given that the inherent low SNR and long measurement duration of ASL have been the main reasons for its limited application in research and medicine. The duration of each scan can be minimized with optimization of the label pulse duration, the so-called label time (LT), and PLD. An effective remedy to increase SNR is the use of high magnetic field scanners, where the longer T1 and higher SNR significantly enhance image quality (Duyn et al, 2005; Golay and Petersen, 2006). In recent years, the number of high-field magnets has increased dramatically, and attempts to optimally apply ASL in humans have increased at an analogous pace. The implementation of this technique in animals is of equal importance and much development and research has been done in rodents. Here, we report the first successful implementation of CASL in monkeys at 4.7 and 7T. The monkey model is of undeniable importance in systems neuroscience, as most sensory systems in monkeys and humans are essentially identical, at least with respect to their anatomic and functional organization (Van Essen, 2004). Combined physiology and fMRI experiments promise to bridge the gap between traditional animal electrophysiology and human neuroimaging, as well as to provide insights into the neurovascular coupling (Logothetis et al, 2001).
The specific aim of the project was to determine the optimal ASL parameters for the macaque, and to investigate the effect of the labeling parameters on the specificity of fCBF. Continuous ASL was performed with three separate coils to avoid magnetization transfer effects and to enable acquisition of multiple slices (Silva et al, 1995; Talagala et al, 2004; Zaharchuk et al, 1999). The coil setup was optimized for measuring fCBF in the visual cortex of the anesthetized monkey. Parts of this work have been reported in conference proceedings (Zappe et al, 2004, 2006).
Materials and methods
Experiments were performed on a vertical 7-T scanner with a 60-cm-diameter bore and a 4.7-T/40-cm-diameter bore scanner (Bruker Medical, Ettlingen, Germany). The 7-T system has a 40 mT/m actively shielded gradient coil with an inner diameter of 33 cm, and rise times <200 μs (AC44, Siemens Medical Solutions, Erlangen, Germany). The 4.7-T system is equipped with an actively shielded gradient coil of 26 cm inner diameter that can attain gradients up to 48 mT/m and rise times <180 μs. Dedicated primate chairs were used to position the monkeys in the magnets (Logothetis et al, 1999; Pfeuffer et al, 2004). Five healthy adult monkeys (Macaca mulatta, 5 to 8 kg) were used. Altogether 15 experiments (sessions) were acquired on 7T and 5 on 4.7T. All experiments were approved by the local authorities (Regierungspräsidium) and were in full compliance with the guidelines of the European Community for the care and use of laboratory animals (EUVD 86/609/EEC). The experiments were performed under general anesthesia according to previously published protocols (Logothetis et al, 1999). The animal was sedated with ketamine (15 mg/kg) and intubated after induction with fentanyl (31 mg/kg), thiopental (5 mg/kg), and succinylcholine chloride (3 mg/kg). Anesthesia was maintained with remifentanil (0.5 to 2 μg/kg per min) and mivacurium chloride (3 to 6 mg/kg per h) was used to ensure complete paralysis of the eye muscles. At the beginning of the experiment, each eye was treated with two drops of 1% cyclopentolate hydrochloride to achieve mydriasis and then fitted with hard contact lenses (PMMA-Linsen; Wöhlk, Kiel, Germany) to bring it to focus on the stimulus plane. Lactated Ringer's solution containing 2.5% glucose was infused at 10 mL/kg per h throughout the experiment. Body temperature was maintained at 38 to 39°C.
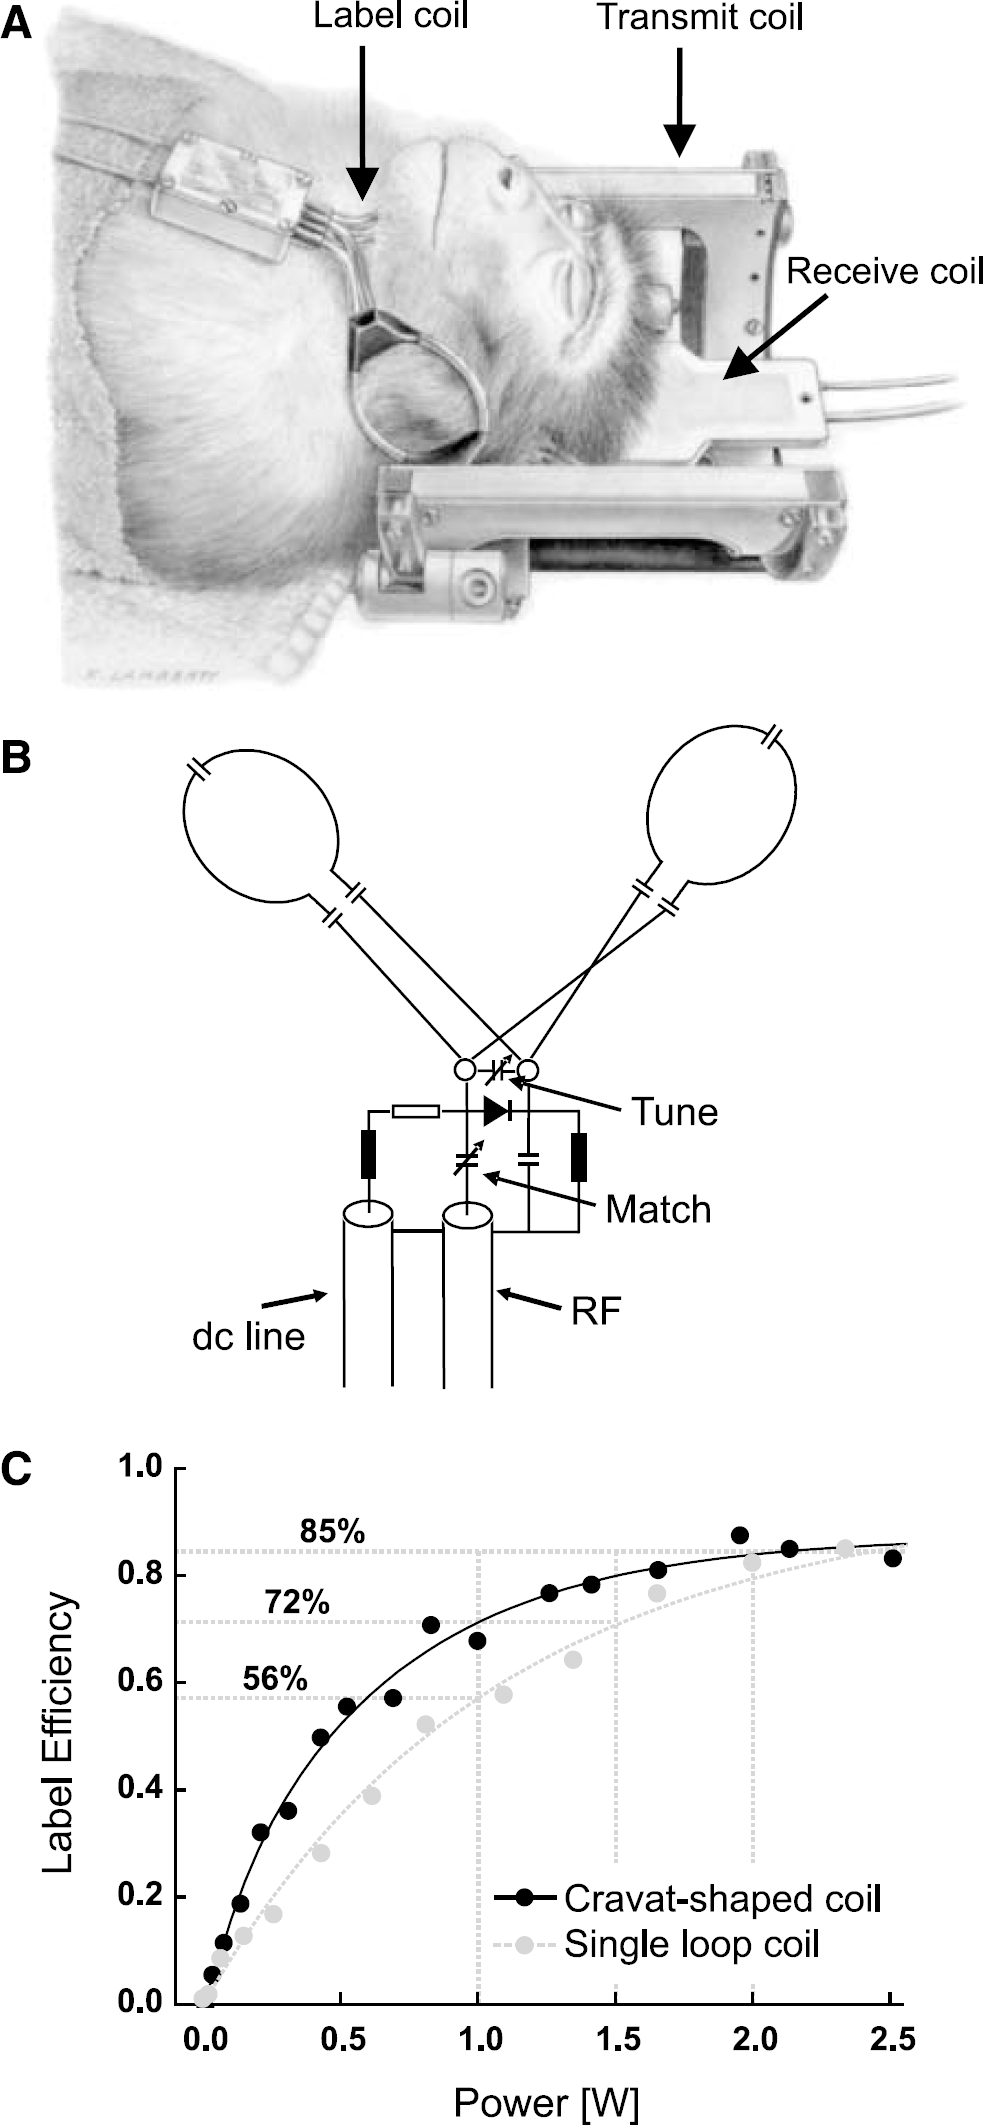
A three-coil setup for CASL provides improved SNR and reduces magnetization transfer substantially (Silva et al, 1995). A saddle coil was used for RF transmission (Pfeuffer et al, 2004) in combination with a surface receive coil (40-mm diameter, Bruker BioSpin, Ettlingen, Germany). The surface coil was positioned over one hemisphere of the occipital lobe. For arterial spin labeling, a second 1H-transmit channel was used. A cravat-shaped neck coil (30 mm at smallest loop diameter) was designed to fit the neck of the macaque monkeys (see Figure 1). The adiabatic condition for spin tagging was verified by measuring the B1-map of the label coil after identifying the location of the left and right carotid and vertebral arteries on an angiography. Decoupling of all three RF coils was actively controlled using PIN diodes built into a self-built logic unit with DC current drivers. Timing was controlled using logic gating signals from the pulse sequence.
(
The preparation module for ASL consisted of a continuous off-resonance labeling pulse that was applied for a label time (LT), in combination with a 2.5 mT/m gradient in the z direction, followed by a PLD. The power of the labeling pulse was 2.7 W, which was sufficient to achieve a labeling efficiency of 0.85 to 0.9. Label efficiency was determined as described by Talagala et al (2004) and Williams et al (1992) and has been corrected for T1 relaxation. To assess magnetization transfer effects, we compared signal intensities in the imaging plane during labeling with off-resonance frequencies of −30,000, −3,000, 0, 3,000, and 30,000 with 3,000 Hz being the proper labeling frequency. To control for superficial heating, we measured the skin temperature in the center of one loop of the labeling coil with a fiberoptic temperature probe (OpSens, Quebec, Canada). Heating effects at the labeling power were within safe limits. In 25 mins of continuous labeling, the skin temperature increased by less than 0.5°C.
At 7T, single-shot, multislice GE-EPI images were acquired with an in-plane resolution of 0.75 × 0.9 mm2 slice thickness of 2 mm. The imaging parameters were TR = 5,300 ms and TE = 14 ms (echo position 25%), matrix = 64 × 64 × 7, flip angle = 90°, and number of repetitions (NR) = 64. The EPI readout duration of 42 ms (< 1.25 · T*2) did not lead to significant T*2 blurring (Haacke et al, 1999). To compare the functional map to the anatomic reference scans, a fully equilibrated reference image (M0 scan), an inversion recovery series (24 inversion times logarithmically spaced from 50 to 5,000 ms, TR = 8,000 ms) and a high-resolution SE-EPI (TR/TE = 5,000/63 ms) image were acquired. For visual stimulation, two flickering light-emitting diode arrays (red, 8 Hz) placed in front of each eye were used. The stimulus paradigm consisted of four trials (42 s ON/42 s OFF) in total lasting 5.6 mins.
The following sets of functional data were acquired.
PLD series: PLD was varied at constant LT (PLD = 200, 500, 800, and 1,200, LT = 3.7 s) (10 sessions, 4 animals); LT-filling series: PLD and LT were varied simultaneously while the sum of PLD + LT was kept constant (PLD = 200, 500, 800 and 1,200 ms, with LT 4.7, 4.4, 4.1, and 3.7 s, respectively) (five sessions, two animals); LT series I: LT was varied while PLD was kept constant and short (PLD = 200 ms, LT = 1, 1.5, 2, 2.5, 3, 3.5, and 4s) (five sessions, two animals); LT series II: LT was varied while PLD was kept constant and long (PLD = 1,000 ms, LT = 1, 1.5, 2, 2.5, 3, and 4s) (three sessions, three animals).
Each condition was repeated at least twice during a session, but usually three times. However, due to time constraints not all series could be acquired in a single experiment.
On the 4.7-T scanner we acquired high-resolution CASL data at short and long PLD (200 and 800 ms) and constant LT of 2 s (five sessions, two animals). Each condition was repeated twice during a session. Eight-segment, multislice GE-EPI images at 0.375 × 0.333 mm2 in-plane resolution and 2 mm slice thickness were acquired with following parameters: TR/TE = 3,000/11 ms (echo position 30%), EPI readout duration = 15 ms, matrix = 128 × 96 × 5, flip angle = 90°, and NR = 64. The stimulus paradigm consisted of eight trials (96 s ON/96 s OFF) in total lasting 25.6 mins. A high-resolution SE-EPI (TR/TE = 3,000/70 ms) was acquired for anatomic reference.
Data Analysis
All data analysis was performed using custom-written Matlab (The MathWorks, Natick, MA, USA) routines. The k-space data were corrected for global off-resonance effects to reduce respiration-induced noise (Pfeuffer et al, 2002). Thereafter, the data were reconstructed and corrected for Nyquist ghosting when necessary. Cerebral blood flow was calculated by linear surround subtraction, and BOLD was derived by linear surround average as described in Aguirre et al (2002). Thus, the temporal resolution of each volume (TR) could be recovered. T1-maps for CBF quantification were derived by fitting the exponential T1 decay to the inversion recovery scan using least-square minimization. Quantification of CBF was calculated according to Equation (1) (Wang et al, 2002).
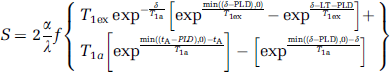
where f = CBF, tA = arterial transit time, α = 0.9 (labeling efficiency), γ = 0.9 mL blood/g of tissue (brain—blood partition coefficient (Parkes and Tofts, 2002)), δ = 1.5 secs (estimate of transit time from labeling plane to tissue (Parkes and Tofts, 2002)), T1a= 2.2 secs (T1 of arterial blood, (Ewing et al, 2001)), T1ex = 1.85 secs (T1 of extravascular tissue (Pfeuffer et al, 2004)), S = ASL signal normalized to M0 (equilibrium tissue magnetization). The normalization to M0 was done on a voxel-by-voxel basis, to account for the inhomogeneous sensitivity profile of the surface coil.
For the analysis of the functional data ROI were selected. First, the visual cortex was selected manually based on the anatomic scan (because of the sensitivity profile of the surface coil). To include the same voxels in the comparison between conditions, the t-maps of each condition were thresholded at t = 2 and the least common multiple was used as a mask for all conditions. The number of voxels was derived from the t-map of each condition. For fitting of the tA the average of t-maps from all conditions was thresholded at t = 0.3. This resulted in a more restrictive mask (fewer non-activated voxels), which was necessary for the fitting procedure. To determine tA values, ROIs for single sessions and the session-average of the PLD series were fitted to Equation (1) while neglecting the LT term (
To evaluate the sensitivity of the CBF and BOLD signal to vessels versus gray matter, profiles over the cortical depth were calculated in opercular V1. The profiles were restricted to the operculum of V1 because functional activation was predominantly observed here, and the thickness of cortex and layers is homogeneous over this area.
Profiles of CBF, signal variance in terms of standard deviation (s.d.) and functional activation in the cortex were calculated as described in Goense and Logothetis (2006). During acquisition, slices were oriented perpendicular to the cortical surface, which was confirmed on a sagittal scan. The location of the Gennari line was determined from high-resolution (200 to 250 μm) structural SE-EPI images (Goense and Logothetis, 2006). The Gennari line serves as an anatomic marker to locate layer IV, and at the same time as a control for partial volume effects, since it is not visible if large partial volume effects are present. Slices with significant partial volume effects (typically the lowest slice) were excluded. For the PLD series acquired at 7T, the in-plane spatial resolution was 0.75 mm A-P and 0.9 mm L-R, which was zero-filled to 0.75 × 0.75 mm2. The GE-EPI at the 4.7T were zero-filled to 0.333 × 0.333 mm2. The lack of gyri in the macaque operculum allows tracing of the cortical surface (using the edge-detection algorithm in Matlab), and fitting a half circle to the boundary (for each slice). Cortical profiles over the activated area were calculated every degree for the 7-T data and every 0.25° for the 4.7-T data. The coordinates specifying the begin- and end-point of each cortical profile were generated from the raw EPI image, and all profiles were calculated between these same points. For the baseline CBF profiles, intensity was normalized to the maximum value within a session to avoid differential weighting of sessions. The fCBF percent change profiles were fitted with a Gauss curve to estimate the full width at half maximum.
Some experiments had to be excluded from the profile analysis because the cortical surface was too uneven to trace because of signal dropout due to susceptibility artifacts from large veins (occurring only at 7T) or when functional activation in the operculum was too weak. From the 7-T data, profiles were calculated for seven sessions in two animals including five PLD series and two LT-filling data sets. Because no effect of LT on the profiles was observed, all seven sessions were averaged for further analysis. From the 4.7-T data, all sessions were included in the analysis. Error values given are standard error of the mean (s.e.m.) over sessions unless stated otherwise.
Results
For proper labeling of the important arteries on the left and right side a cravat-shaped coil was designed to fit the neck of the monkey (Figure 1). Label efficiencies were calculated at a labeling power of 0 to 2.5W, and show a superior performance of the cravat shaped over a single-loop label coil. While the maximum label efficiency of 0.85 to 0.9 was similar for both coils, the cravat-shaped coil reached this maximum earlier (Figure 1C). The label coil as well as the transmit and receive coils can be actively detuned to minimize magnetization transfer effects. Changes in signal intensities due to magnetization transfer were below 0.2% of image signal and thus negligible.
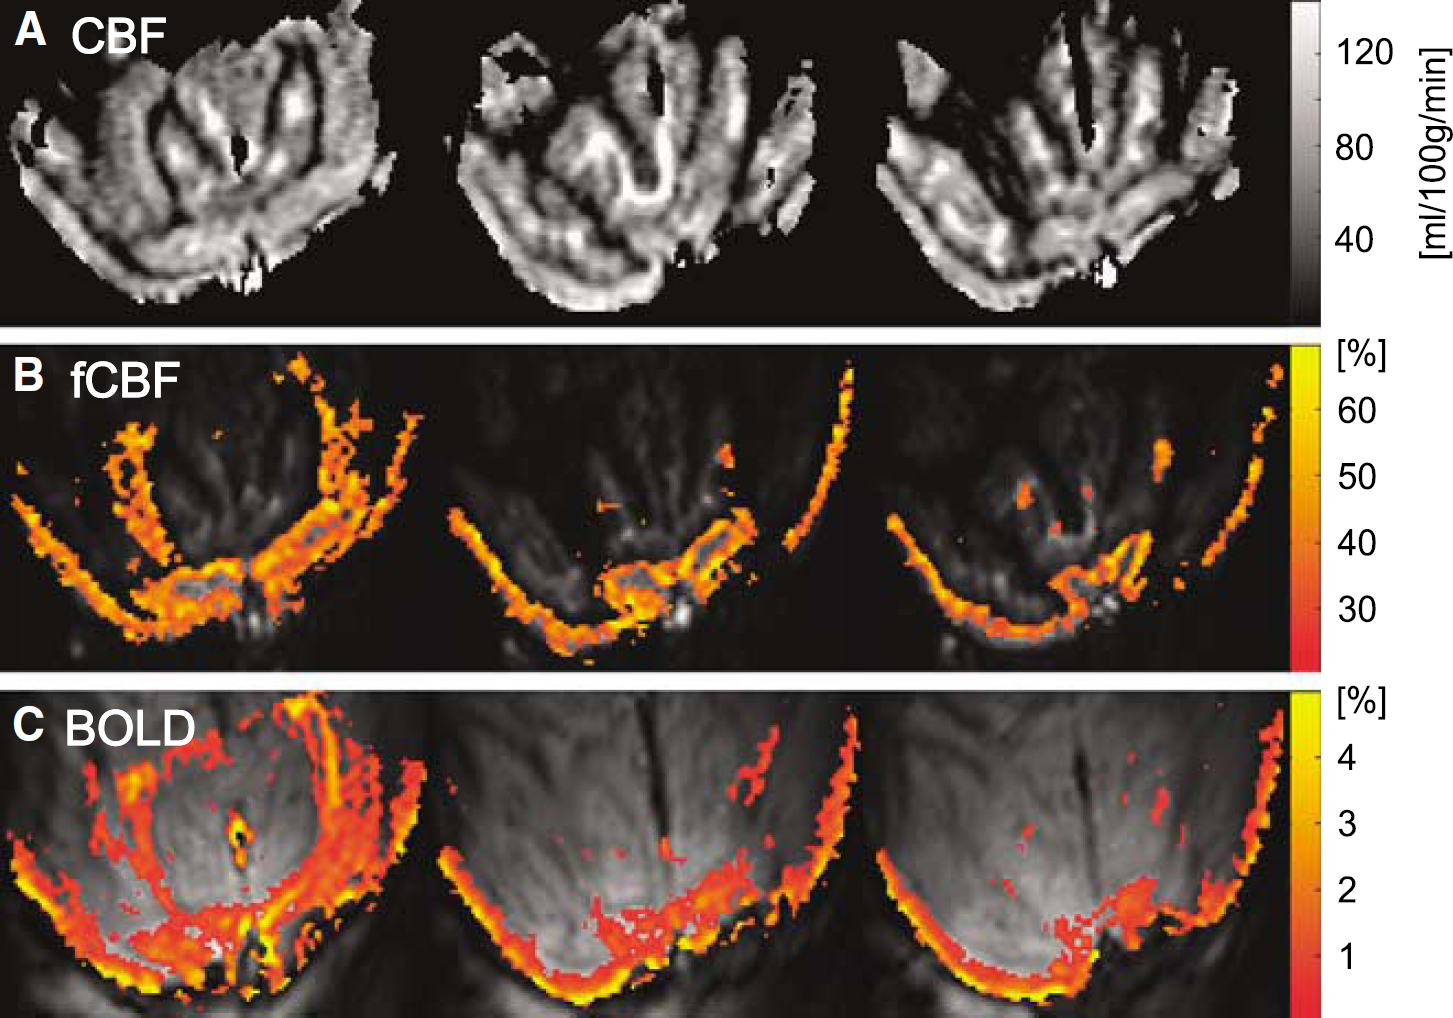
Figure 2 shows examples of baseline CBF, fCBF, and BOLD maps acquired with this setup. The CBF maps (Figure 2A) showed clear differences in blood flow in gray and white matter. The short PLD of 500 ms resulted in some arterial hotspots. The ASL signal typically constituted 1 to 3% of fully relaxed signal intensity (M0) in the gray matter of the occipital lobe. The SNR of CBF maps acquired with LT of 3.7 secs and PLD of 1,200 ms was 28±3 (n = 11). Typical CBF values in gray matter were 98±38 mL/100 g per min (mean±s.d.) and 43±20 mL/100 g per min in white matter (Zappe et al, 2007).
(
Functional CBF maps were calculated with surround subtraction and typically showed stimulation-induced changes of 30 to 50% (Figure 2B). Blood oxygenation level-dependent maps (Figure 2C) were calculated from the same images by surround averaging and show robust activation despite the short TE (11 to 14 ms) with typical stimulation-induced changes of 2 to 4%. Comparison of the BOLD and fCBF maps shows that the highest BOLD percent changes occur along the surface of the cortex while highest fCBF changes were located in the center of gray matter.
Effect of Label Time and Post-Label Delay on Functional Cerebral Blood Flow
Theoretically, the ASL signal is expected to increase with increasing LT until it saturates after approximately three times T1 (Detre et al, 1992). Figure 3 shows the time course of the ASL signal and its functional modulation on visual stimulation for different LT, at a short (Figure 3A, PLD = 200 ms) and long PLD (Figure 3B, PLD = 1,000 ms). The ASL signal increases significantly with LT (Table 1), but seems to saturate at 4 s while the stimulus-induced ASL-signal modulation remains constant from LT = 2 s to 4 s. Because the baseline ASL signal continues to increase for LT ≥ 2 s while functional ASL signal modulation remains constant, the percent change shows a tendency to decrease with increasing LT for the LT series I (PLD = 200 ms), whereas there is no such trend for the LT series II (PLD = 1,000 ms). The number of activated voxels with t > 2 also increases for LT up to 2 s, and then remains constant for both PLD. Mean t-values become larger with increasing LT. However, except for the change in baseline ASL signal and t-values, most changes are not significant, as can be seen in Table 1. In summary, SNR and t-values are low up to LT = 2 s and show no changes for LT > 2 s, suggesting that labeling times need not be longer than LT = 2 s.
Effect of LT on fCBF acquired at two different PLD (200 and 1,000 ms)
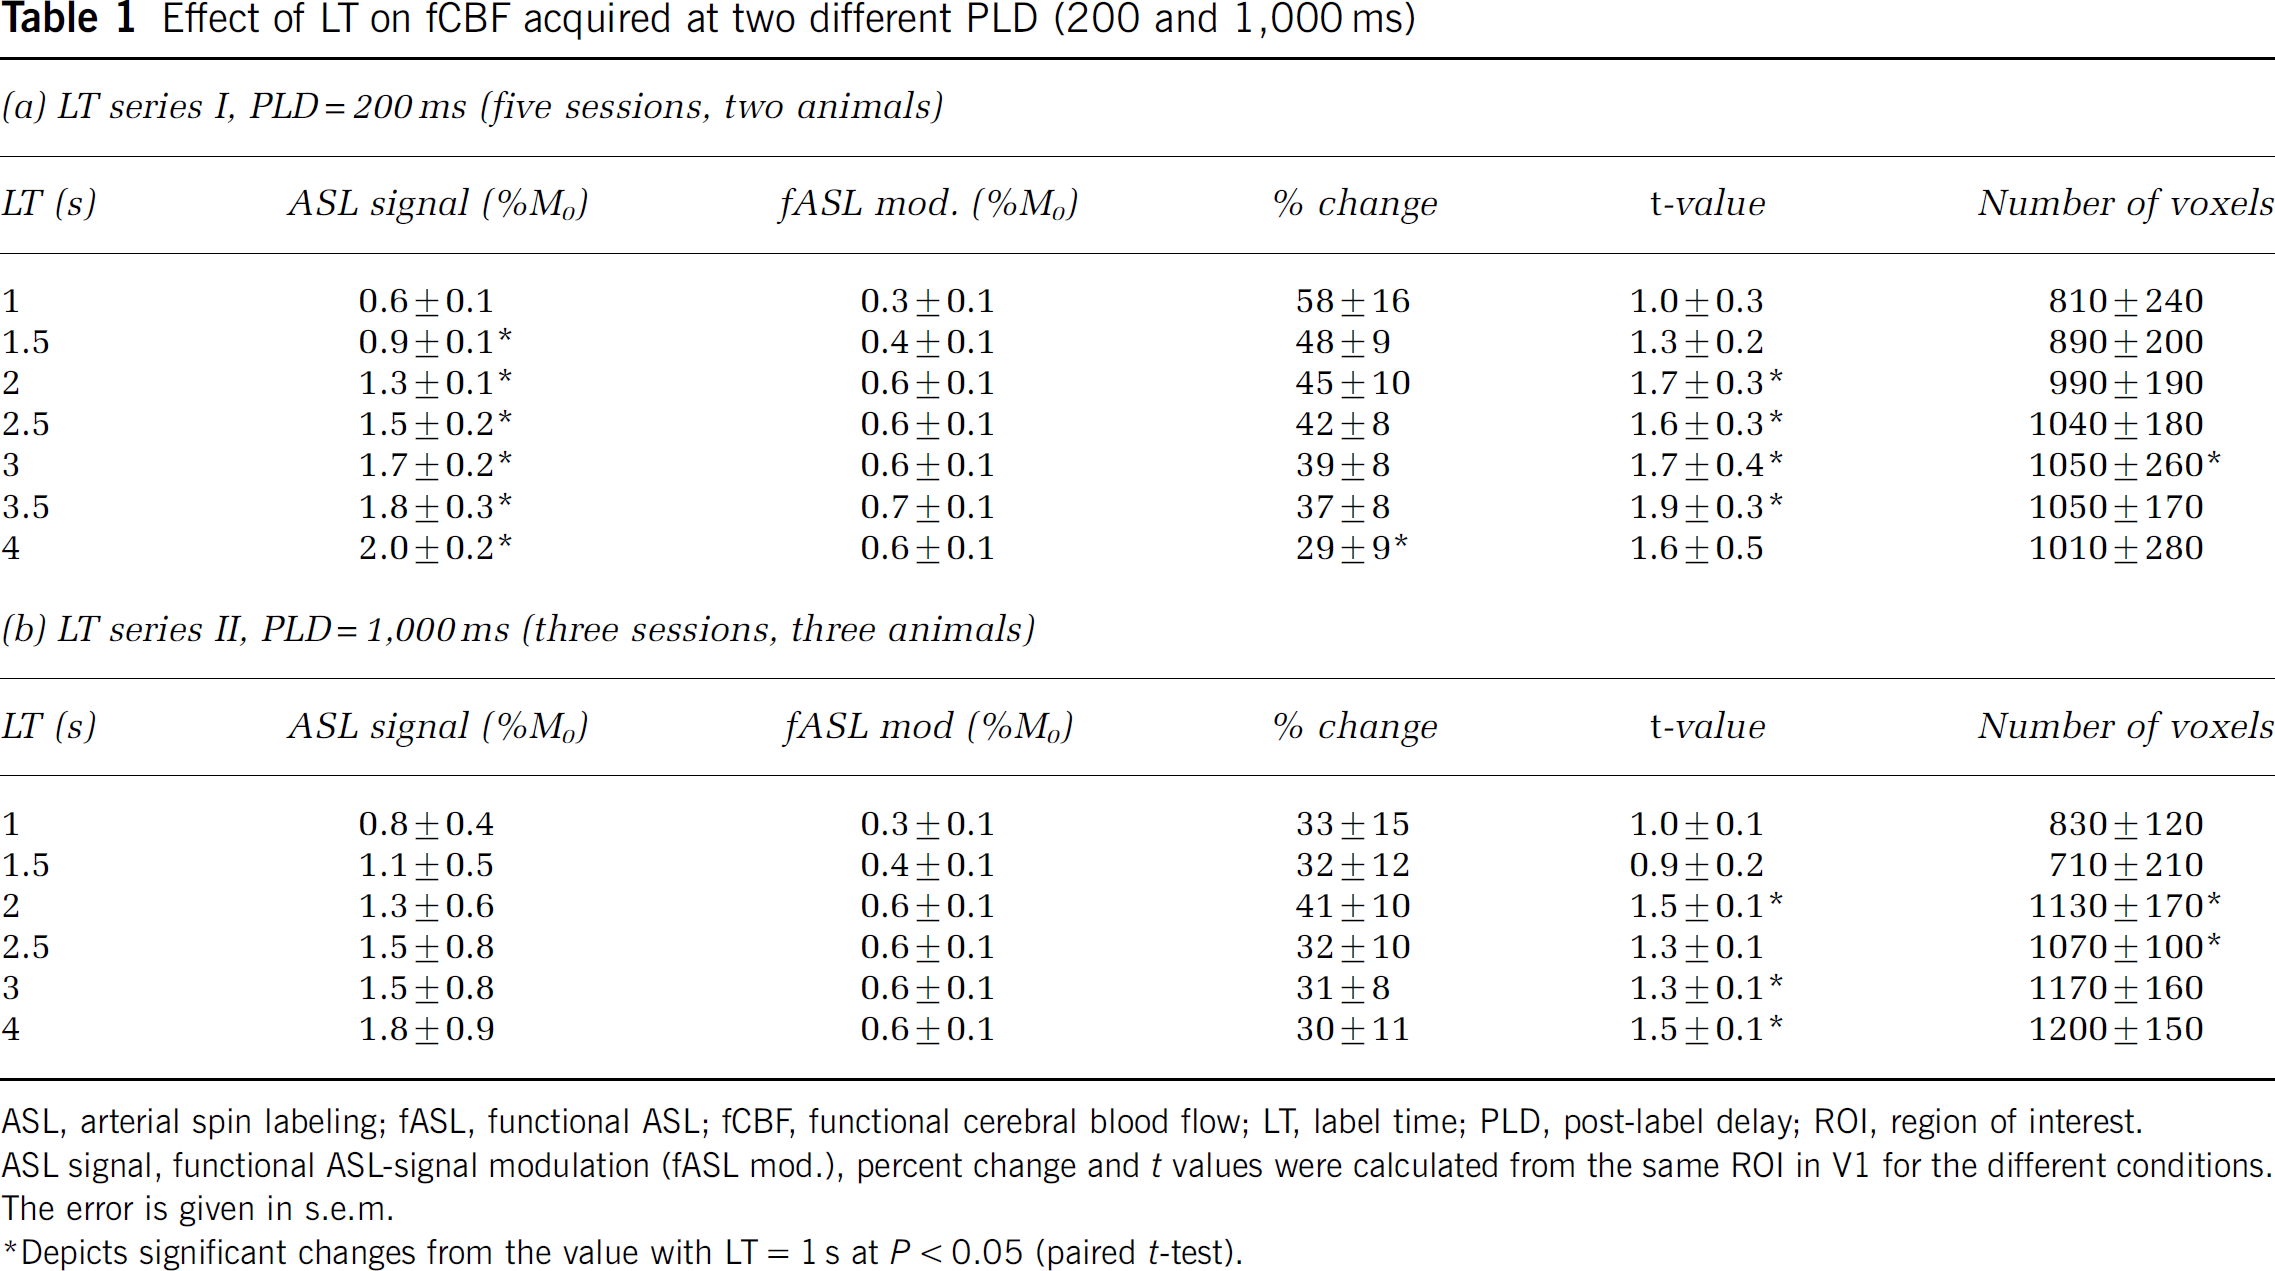
ASL, arterial spin labeling; fASL, functional ASL; fCBF, functional cerebral blood flow; LT, label time; PLD, post-label delay; ROI, region of interest.
ASL signal, functional ASL-signal modulation (fASL mod.), percent change and t values were calculated from the same ROI in V1 for the different conditions.
The error is given in s.e.m.
Depicts significant changes from the value with LT = 1 s at P < 0.05 (paired t-test).
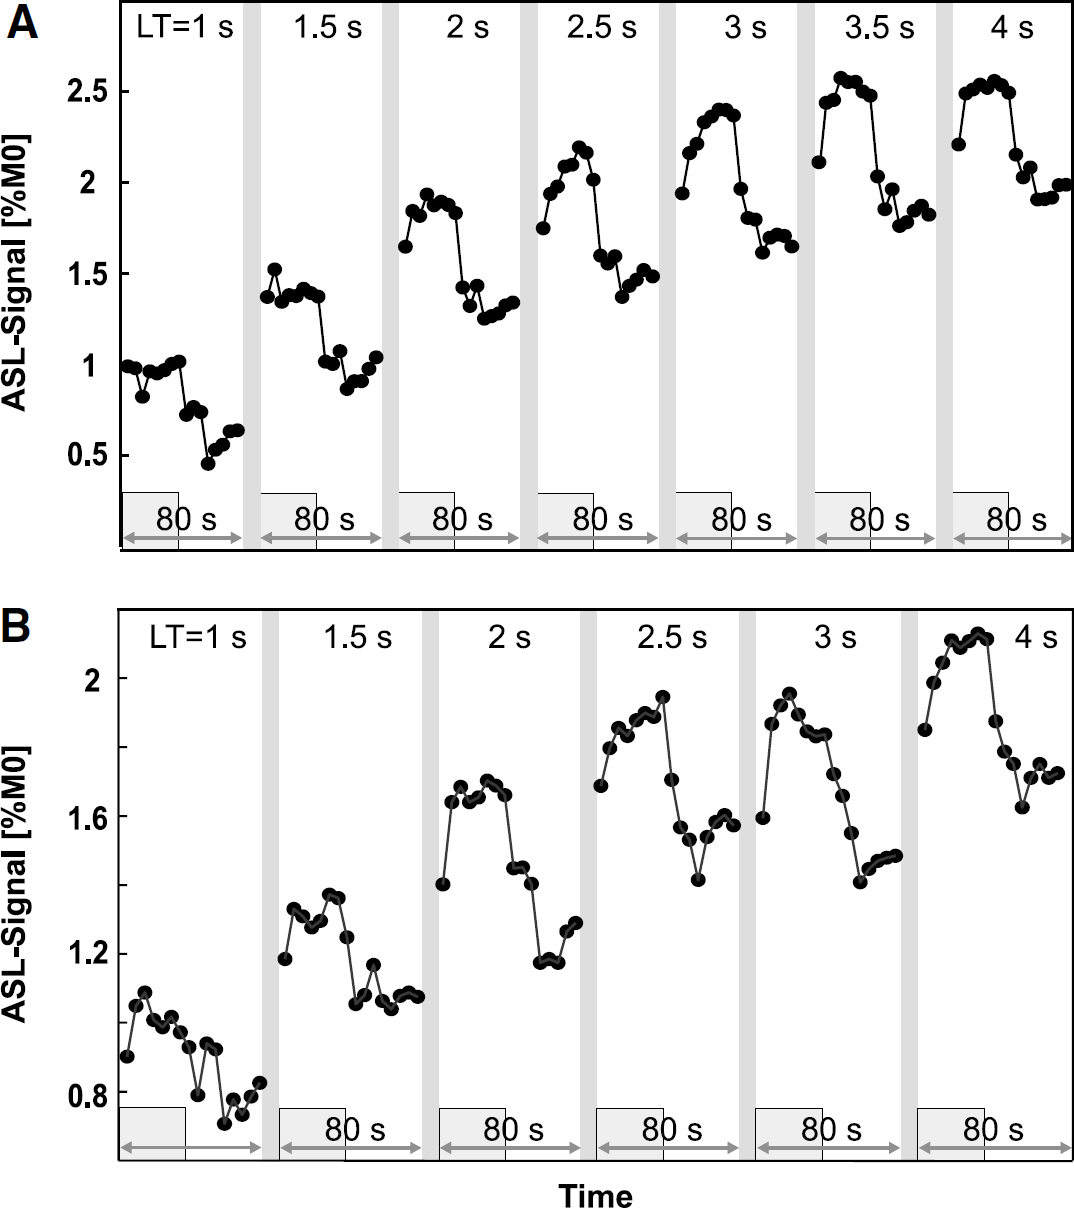
Time course of the average fCBF signal as a function of label time during visual stimulation in V1 for (
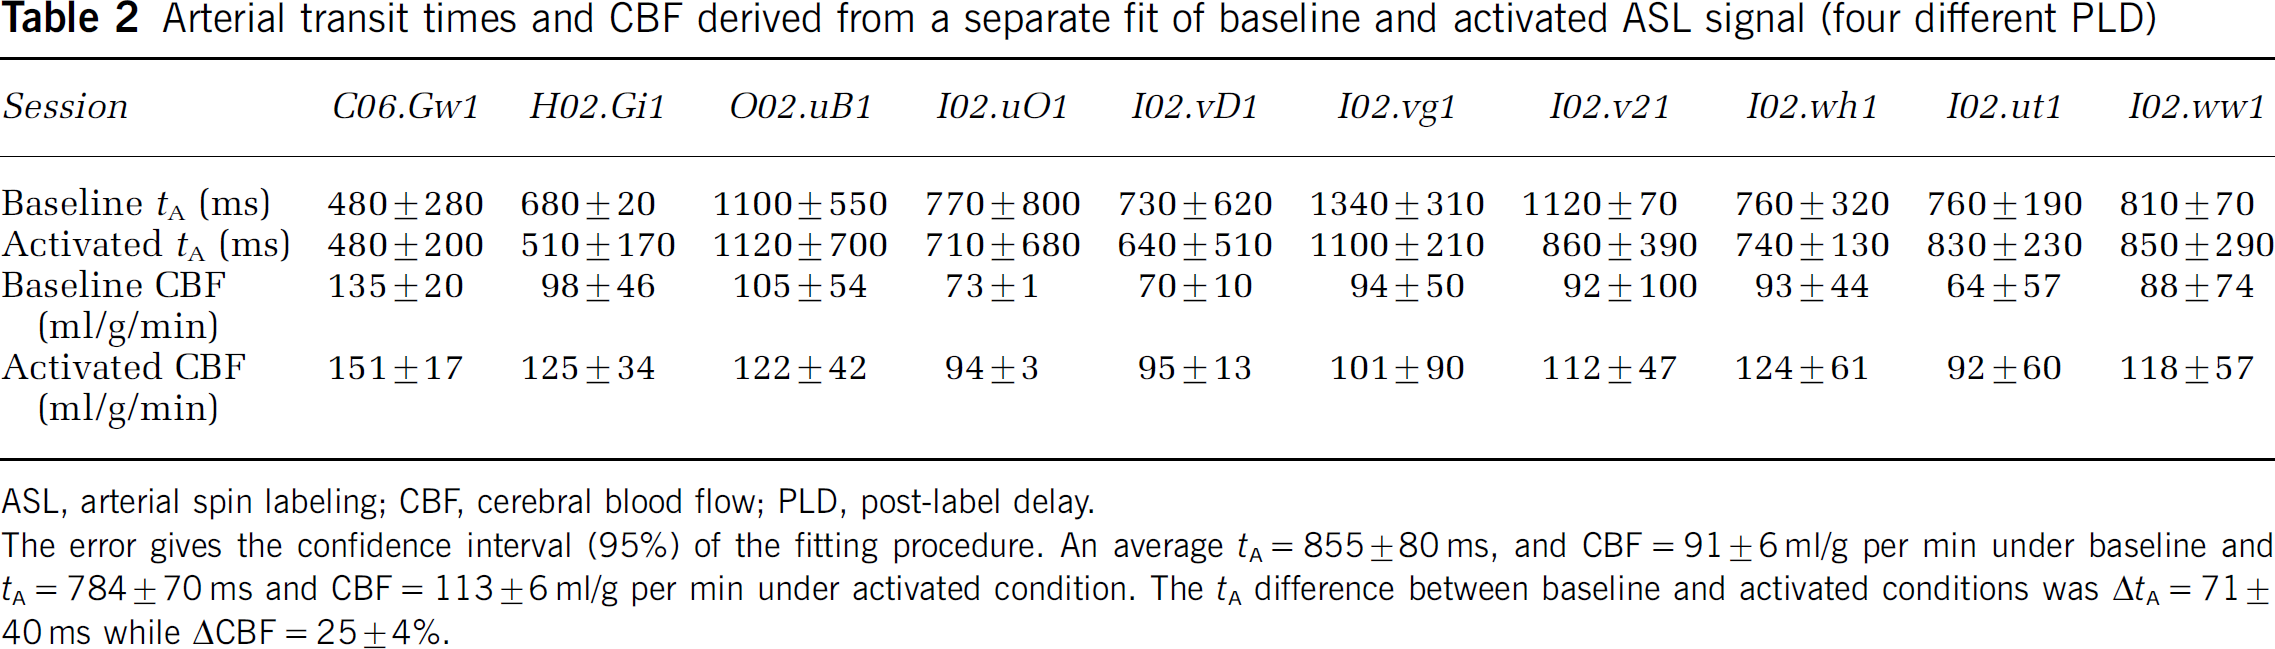
In a second set of data, the influence of PLD on fCBF was investigated. At first, we estimated tA and CBF during activated and baseline condition by fitting baseline and activated data separately to a two-compartment model (Gonzalez-At et al, 2000). Figure 4 shows the fit to the averaged data (10 sessions, 4 animals), which resulted in tA= 780±120 ms (mean±confidence interval of 95%) and CBF = 115±56 mL/g per min for the activated condition, and tA = 820±80 ms with CBF = 91±29 mL/g per min for the baseline condition. Table 2 shows the results of fitting each session separately, which resulted in tA = 784±70 ms and CBF = 113±6 mL/g per min under activated and tA = 855±80 ms and CBF = 91±6 mL/g per min under baseline condition. ΔtA differs with 71±40 ms between baseline and activated condition while CBF increases with 25%±4% in the activated state. Taking the slice-specific PLD into account in the fitting resulted in longer tA values (within 1 s.d.) and larger confidence intervals while CBF was not affected. Although CBF increases in all 10 sessions (between 8% and 43%), the stimulus-induced difference of tA and CBF did not reach significance.
Arterial transit times and CBF derived from a separate fit of baseline and activated ASL signal (four different PLD)
ASL, arterial spin labeling; CBF, cerebral blood flow; PLD, post-label delay.
The error gives the confidence interval (95%) of the fitting procedure. An average tA = 855±80 ms, and CBF = 91±6 ml/g per min under baseline and tA = 784±70 ms and CBF = 113±6 ml/g per min under activated condition. The tA difference between baseline and activated conditions was ΔtA = 71±40 ms while ΔCBF = 25±4%.
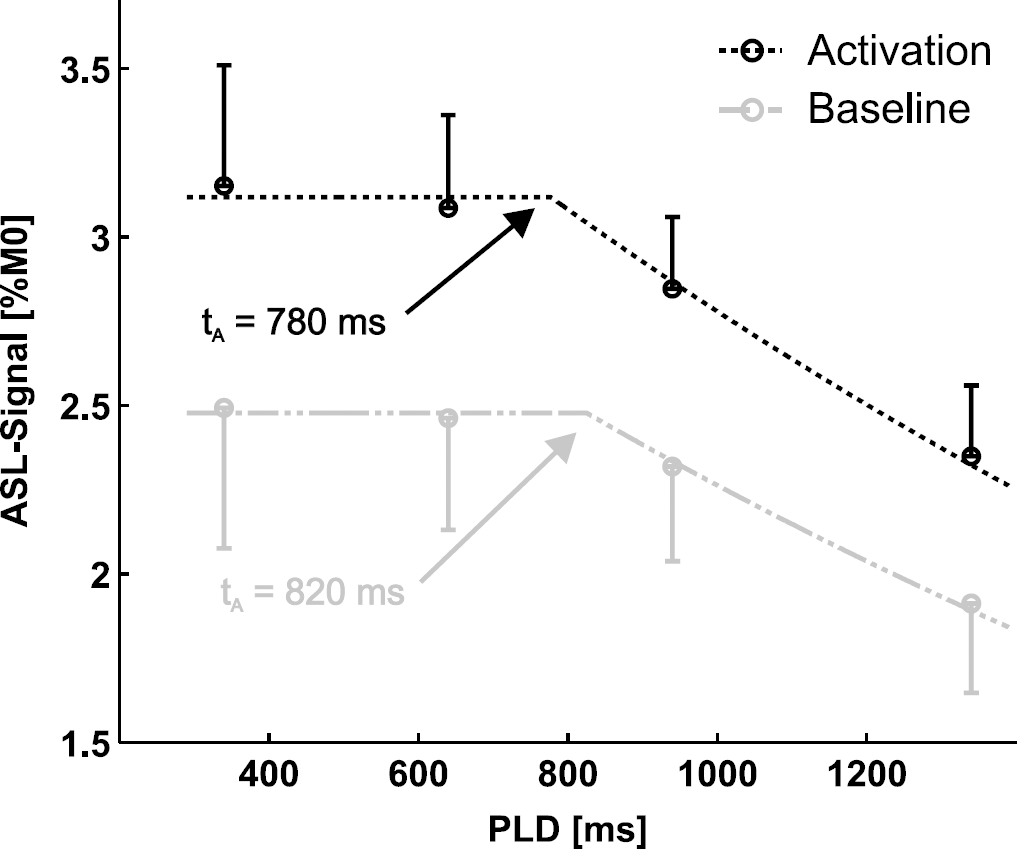
ASL signal as a function of PLD fitted with a two-compartment model for activated (black) and baseline condition (gray) (LT = 3.7 s). The knee of the curve determines tA. The results for tA are in agreement with the average of the single session fits in Table 2 (tA = 784±70 ms under and 855±80 ms under baseline condition). The error bar shows the s.e.m. (ten sessions, four animals).
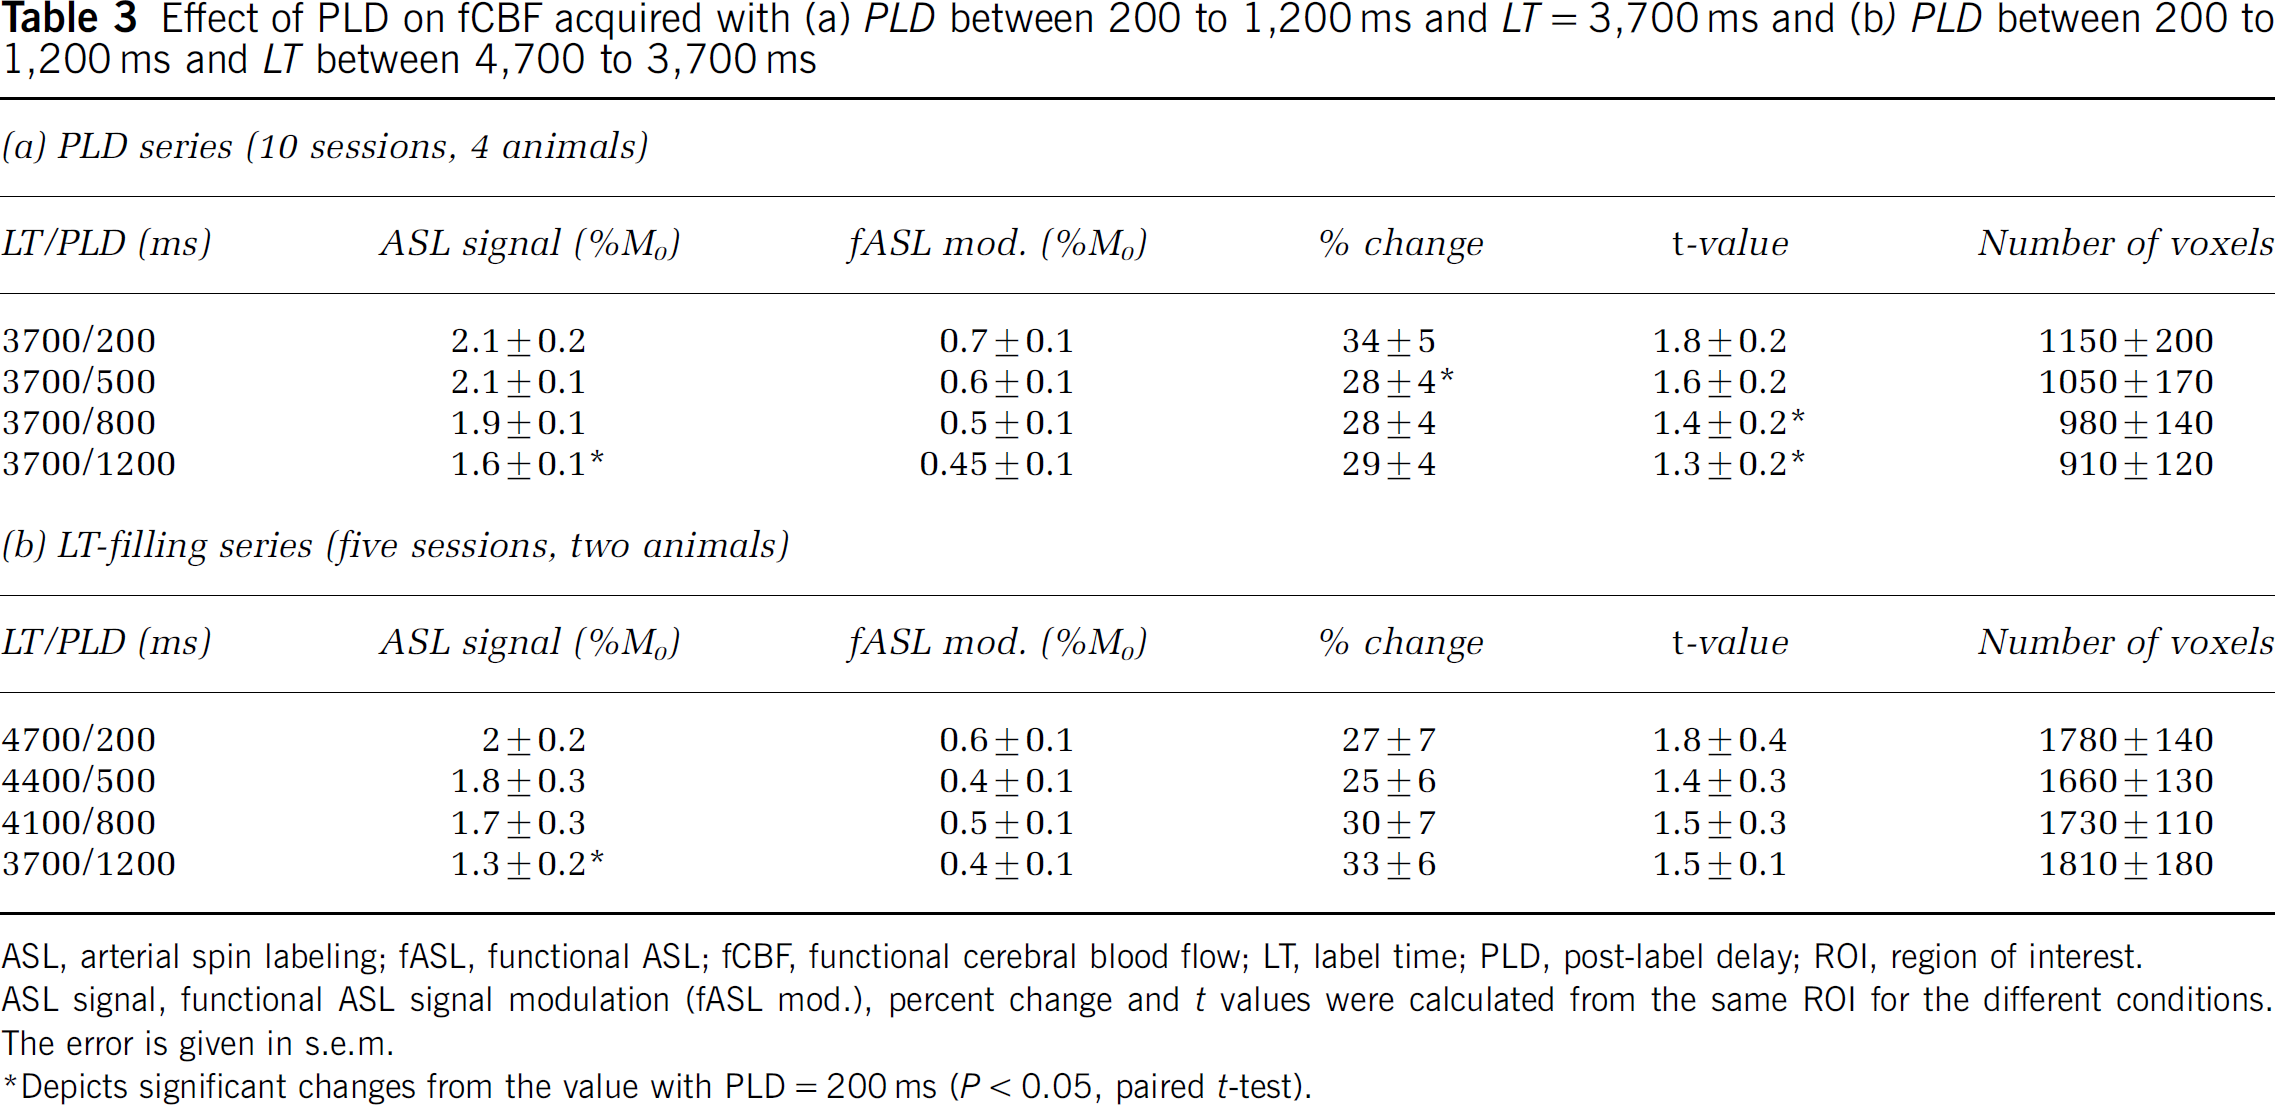
The time courses for fCBF at varying PLD (200 to 1,200 ms) are shown in Figure 5 (LT = 3.7 s). Quantification of the data is shown in Table 3a. Additionally an LT-filling series (Table 3b) was acquired, with LT and PLD covarying while keeping TR constant (LT = 3.7 to 4.7 s, PLD = 200 to 1,200 ms). We searched for the most efficient ASL protocol, but the results show that the LT-filling series closely resembles the PLD series, indicating that for an LT of 3.7 s the effect of labeling an additional 1 s is small. For both series, the baseline ASL signal shows a downward trend with increasing PLD, which reaches significance between the shortest and longest PLD, as is expected based on signal loss due to T1 at long PLD (Gonzalez-At et al, 2000). The fCBF percent change were not modulated much by PLD. The t-values showed a tendency to decrease, which was significant in the PLD series but not in the LT-filling series (compare Table 3). The mean t-values for the LT-filling series are similar to the PLD series, but it is possible that because there are fewer sessions, the difference does not reach significance here. The number of activated voxels did not change significantly between PLD conditions. The percent change is constant for most conditions in the PLD series and LT-filling series, with a significant difference in the PLD series between 200 and 500 ms. In summary, this indicates there is no major effect of PLD on fCBF in V1 at this resolution when metrics based on a large ROI are used.
Effect of PLD on fCBF acquired with (a) PLD between 200 to 1,200 ms and LT = 3,700 ms and (b) PLD between 200 to 1,200 ms and LT between 4,700 to 3,700 ms
ASL, arterial spin labeling; fASL, functional ASL; fCBF, functional cerebral blood flow; LT, label time; PLD, post-label delay; ROI, region of interest.
ASL signal, functional ASL signal modulation (fASL mod.), percent change and t values were calculated from the same ROI for the different conditions.
The error is given in s.e.m.
Depicts significant changes from the value with PLD = 200 ms (P < 0.05, paired t-test).
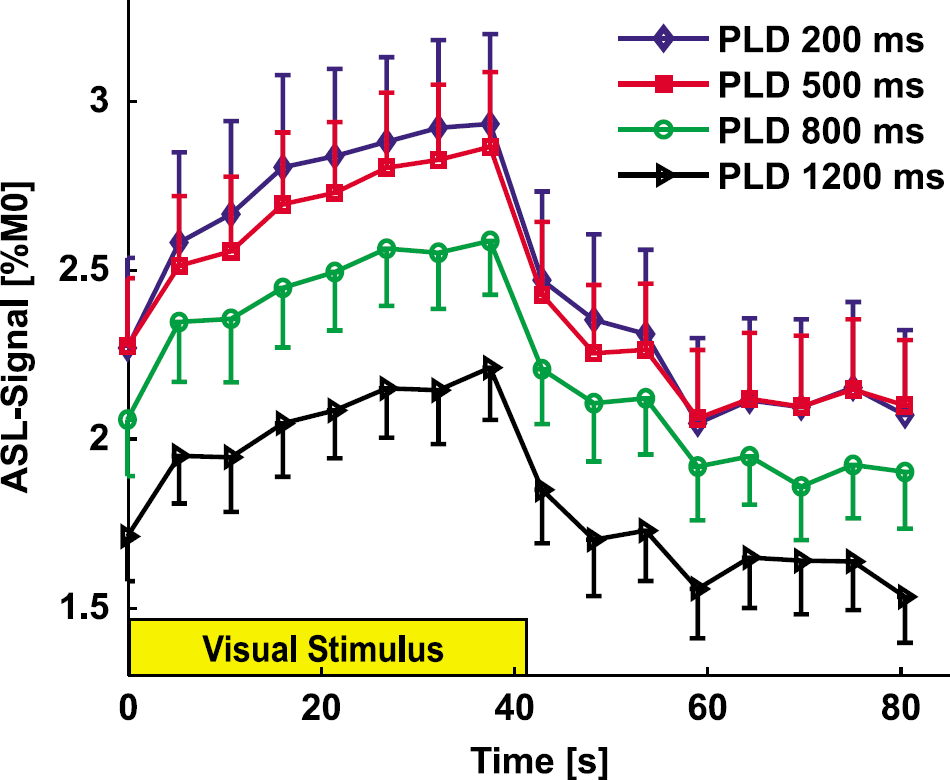
Functional CBF time courses for different PLD in primary visual area (LT = 3.7 s). Baseline ASL signal decreased with PLD, but the stimulus-induced modulation of CBF is similar. No post-stimulus undershoot was observed at this temporal resolution (TR = 5,300 ms). See Table 3 for quantification. The error bar shows the s.e.m. (ten sessions, four animals).
Effect of Post-Label Delay on Functional Cerebral Blood Flow Specificity
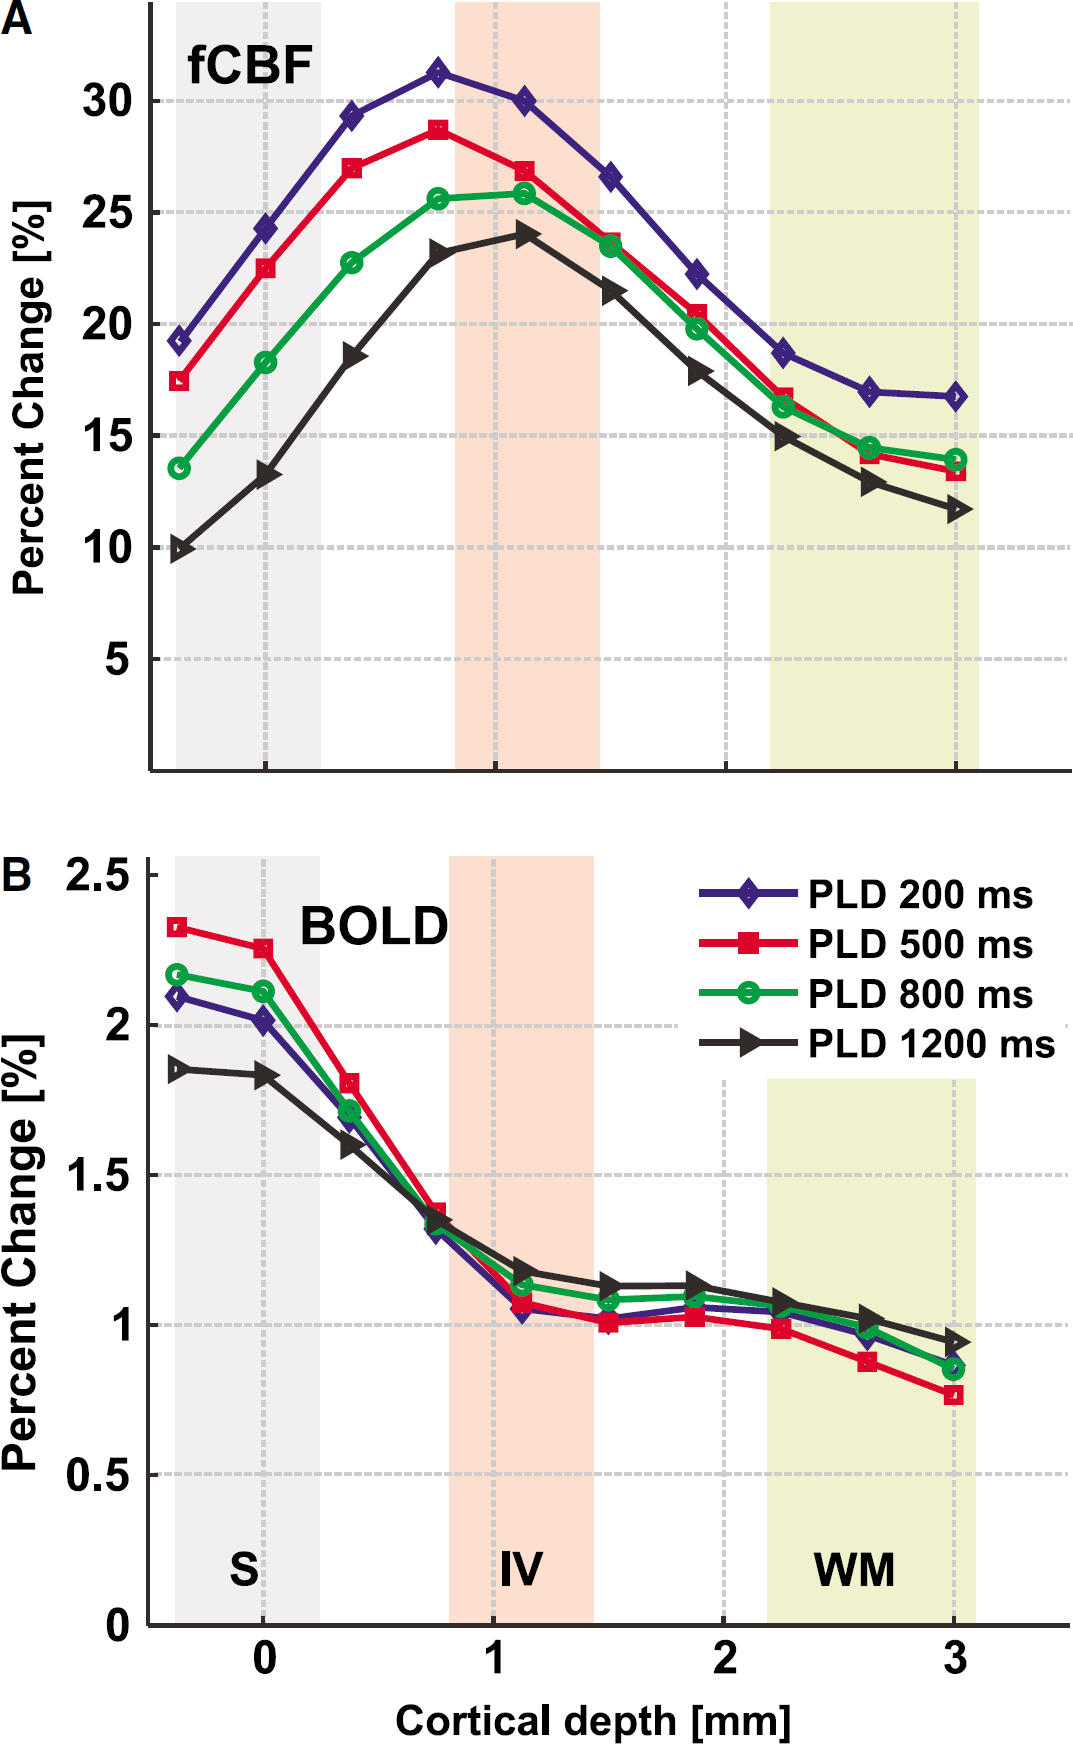
Because baseline CBF is located primarily in vessels at short PLD, it is plausible that fCBF is also located in vessels at short PLD. Because ROI analysis is not sensitive to such differences, we determined profiles of the functional activity over the depth of the cortex in V1 operculum. These cortical profiles show that fCBF is more specific than the BOLD signal to gray matter. This is already visible in the functional maps in Figure 2 and becomes evident in Figure 6. The maximum fCBF percent change occurs in the middle of gray matter, with the peak corresponding to roughly layer IV, which is located at 0.8 to 1.4 mm depth. The maximum fCBF percent change 31±3% occurred at 0.75 mm depth for PLD = 200 ms and for PLD = 1,200 ms a maximum of 24±5% was located at 1.1 mm depth (Figure 6A). In contrast, the BOLD profiles derived from the same scans peaked at the surface (Figure 6B). The BOLD percent signal change was between 1.9±0.3% and 2.3±0.3% at the surface, decreasing to approximately 0.8±0.3 beyond 2.2 mm depth.
(
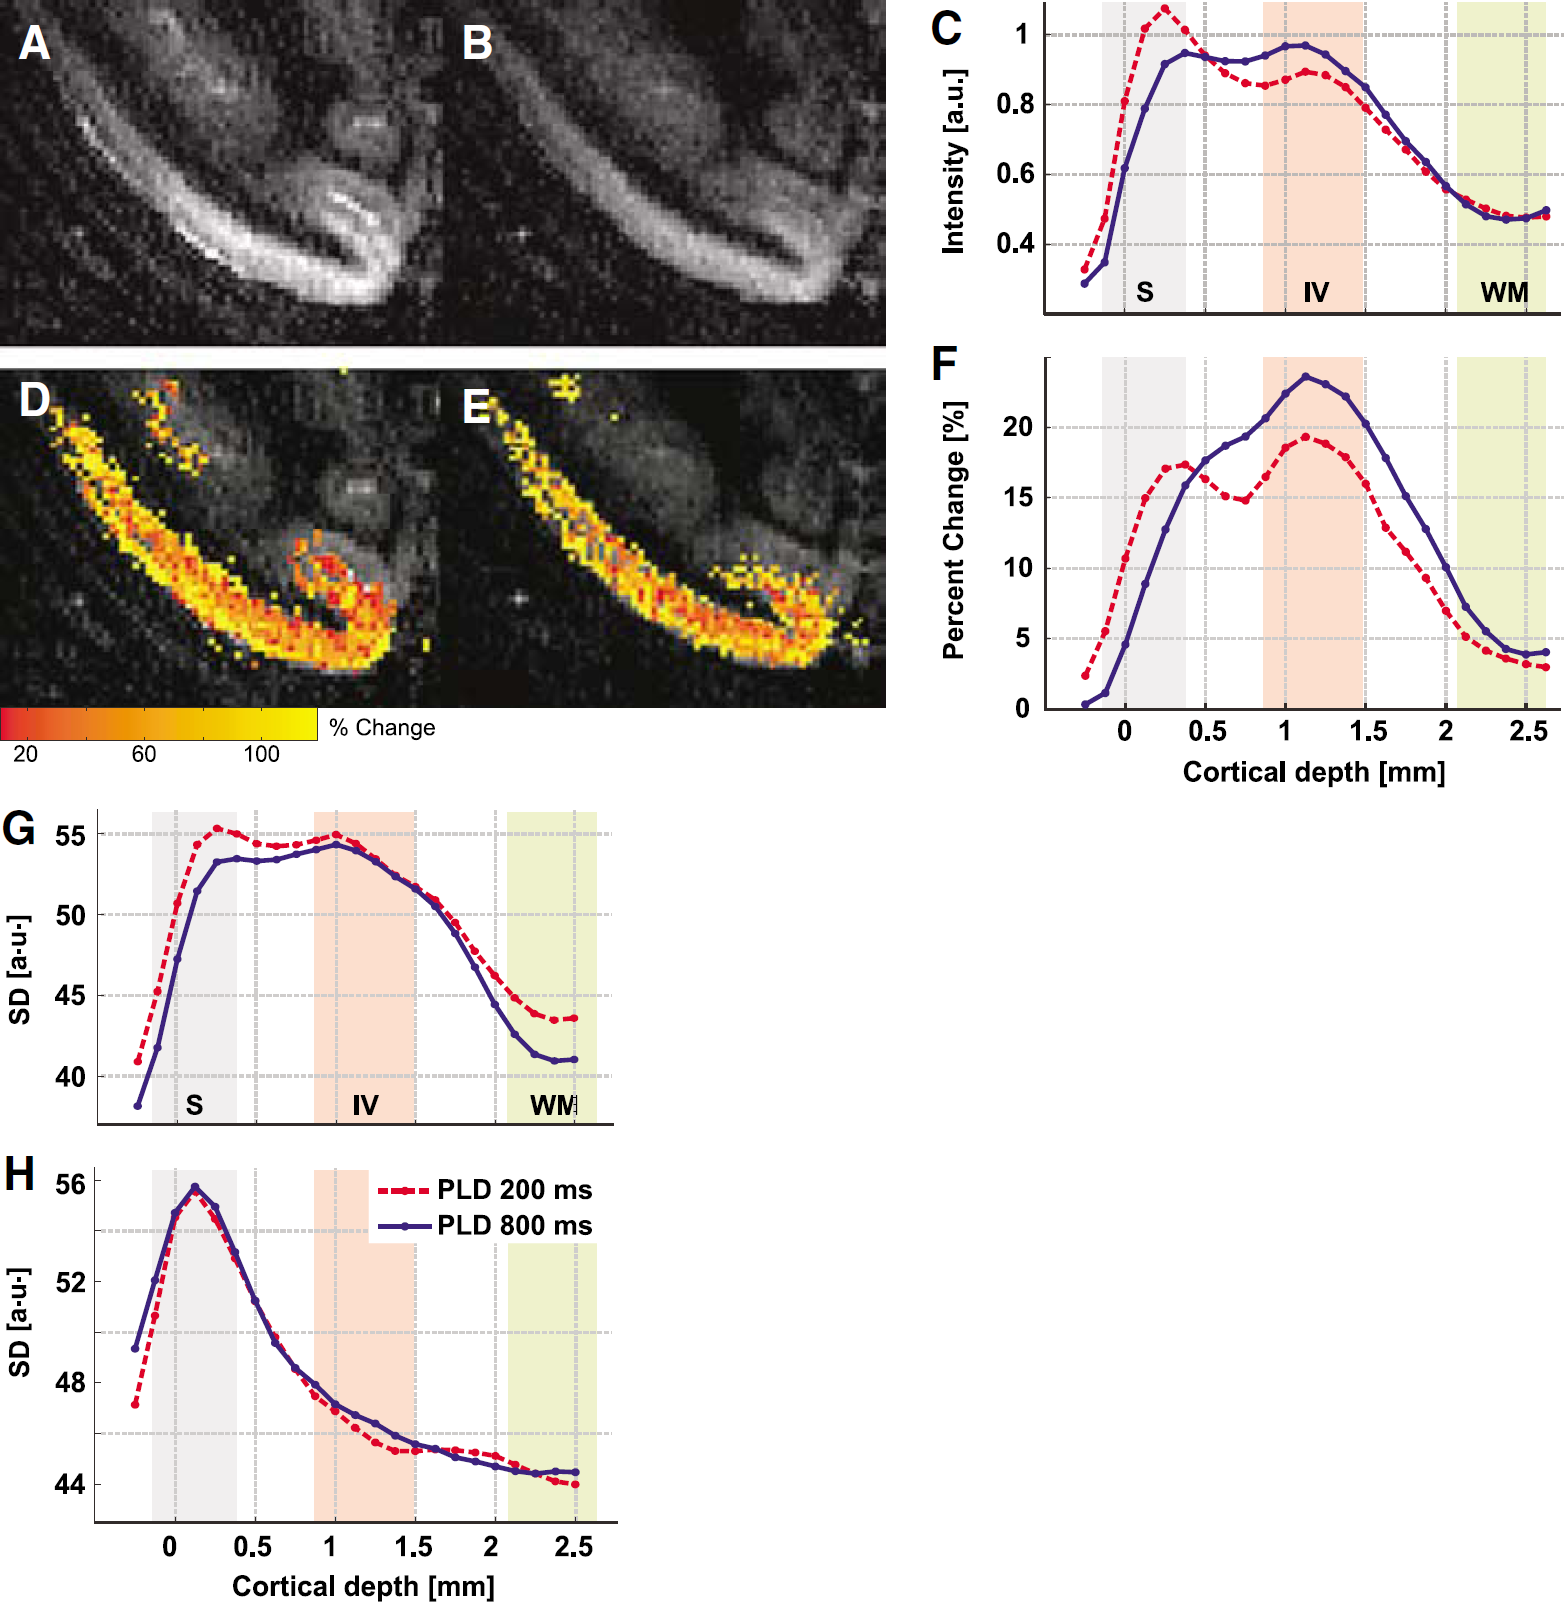
The full width at half maximum of the fCBF profiles derived with different PLD decreased from 1.5 to 1.3 mm with increasing PLD, which was observed in all sessions (P = 0.06). The peak of the percent change profiles moved slightly inward for increasing PLD from 0.7 to 1.1 mm (P = 0.04). Although the data suggest that spatial localization of functional activation depends on the PLD, these results are only at the border of significance. It appears that the effect of PLD is subtle and cannot be easily resolved at the spatial resolution of 0.75 × 0.9 mm. Therefore, we investigated the effect of PLD (for PLD = 200 and 800 ms) at a higher resolution (0.375 × 0.333 × 2 mm3) using data acquired at 4.7T. Figure 7 shows baseline CBF maps (Figures 7A and 7B) and fCBF percent change maps (Figures 7D and 7E) for an example session. In the baseline CBF map at short PLD (Figure 7A), foci with high intensity on the edge of cortex are clearly visible, which indicate arterial CBF signal. In the fCBF map at PLD = 200 ms, highest percent changes are also localized at the surface (Figure 7D). At a PLD of 800 ms both baseline CBF and functional CBF are distributed more homogeneously throughout the cortex (Figure 7E). The higher contribution of the surface vessels at PLD = 200 ms, is better visible in the cortical profiles of both baseline (Figure 7C) and fCBF (Figure 7F) (averaged over five sessions from two animals). The ratio of surface fCBF signal to layer IV signal is significantly higher at short PLD than at long PLD (P < 0.005, paired t-test). Similarly, in the baseline ASL signal, layer IV signal is significantly higher at short PLD than at long PLD (P < 0.02, paired t-test).
Representative (
The distribution of noise as a function of cortical depth is evaluated in terms of s.d. of the ASL signal and GE-EPI after surround average, and is strongly depth-dependent (Figures 7G and 7H), as has been observed for GE-EPI (Pelled and Goelman, 2004). The highest s.d. was observed at the surface both for ASL signal and GE-EPI, which is likely to be caused by the larger signal variability in the superficial vessels. While the s.d. of the ASL signal remains rather constant in gray matter and only decreases at the white matter border, the s.d. for GE-EPI decreases within gray matter steeply to 20% of the surface level. The s.d. of the GE-EPI does not show a peak around layer IV, as shown by Pelled and Goelman (2004), which could be due to the very short TE of 11 ms. For the ASL signal, the s.d. is significantly higher at the surface for the short PLD (P < 0.05, paired t-test), a result of the larger surface contribution at PLD of 200 ms. In summary, ASL maps with a short PLD have higher baseline signal, percent change, and noise in the superficial layers than ASL maps with a long PLD.
Discussion
The present report, including earlier publication (Zappe et al, 2004, 2006), is the first comprehensive implementation of CASL in the nonhuman primate, showing fCBF induced by sensory stimulation. Continuous ASL has been implemented in small animals, humans (Calamante et al, 1999), and recently in monkeys at 3T (Zhang et al, 2007), who showed hypercapnia-induced CBF changes. The high SNR of the 7-T and 4.7-T systems and the extensive optimization of the coil setup allowed us to obtain functional perfusion maps at submillimeter resolution. To establish perfusion-based functional imaging in the nonhuman primate, the influence of the labeling parameters on fCBF was evaluated. In addition to the labeling parameters, the sequence parameters of the EPI module, such as TE, spatial resolution, and readout duration affect image quality and interpretation of the functional signal, for example by introducing BOLD contamination to the ASL signal. However, because the aim of this study was to determine the effect of labeling parameters on the measured fCBF, we kept the EPI parameters constant. In all analysis we interpolated with surround subtraction as it has been recommended (Aguirre et al, 2002) to minimize BOLD contamination, which is an issue at high field where T2* of gray matter is as short as 35 ms at 7T and 42 ms at 4.7T. Further reduction of BOLD contamination, for example, by using SPIRAL or SE-EPI as readout method is an issue of future studies, since T2* can introduce errors in the quantification of CBF (St Lawrence and Wang, 2005) and in functional activation studies (Aguirre et al, 2002).
Because a long labeling pulse leads to a long measurement duration and risks tissue heating due to high-power deposition, it is of interest to select the shortest LT necessary. Therefore, we investigated the influence of LT on fCBF for label pulse durations between 1 and 4 s. For LT > 2 s, no significant effect of LT on signal modulation, mean t-values and number of activated voxels in fCBF maps was found. As the ASL-signal modulation is proportional to stimulus-induced blood flow changes, which should not depend on the ASL parameters, this suggests that an LT of 2 s is sufficient for mapping fCBF.
The second important label parameter which affects the duration of CASL scans is the PLD after the label pulse. The PLD has been introduced in a theoretical framework to account for the effect of arterial transit time on ASL signals (Alsop and Detre, 1996; Zhang et al, 1992). When a PLD is shorter than the maximum tA, the tag has not been delivered homogenously to the parenchyma of all imaged regions. Instead, some labeled signal will still be located in the arteries and the ASL signal from different brain regions will not be proportional to real tissue perfusion. It is not clear how strong the contribution of the PLD is to functional CBF maps despite its apparent effect on baseline CBF. Functional CBF maps are not only affected by heterogeneity in delivery of the tag, as present in the baseline CBF, but also by the heterogeneity in stimulation-induced flow changes in the microcirculation (Villringer et al, 1994). The effect of the PLD on fCBF has been addressed in humans (Gonzalez-At et al, 2000; Mildner et al, 2005) to derive arterial transit times, which in fact were shortened by sensory stimuli, however, spatial differences on the fCBF maps were not observed.
In this study, the difference in tA between the baseline and visually activated conditions was estimated by fitting tA to four different PLD (Figure 3). Compared with the results of Gonzalez-At et al (2000), in humans, we found a smaller difference between stimulus and baseline conditions (ΔtA = 70±40 ms versus ΔtA = 150±50 ms in humans) although our absolute values for tA were longer than in humans, which aside from having a physiologic origin, could be due to differences in coil design and positioning. The difference in coil positioning between experiments might also account for some of the intersubject and intersession variability in tA. A more extensive modeling of absolute measures of tA in the macaque was performed in a different study and determined tA in gray matter to be 742±184 ms (mean±s.d.) at baseline and 682±187 ms during visually activated condition (Zappe et al, 2007). Gonzalez-At et al (2000) showed that their data were better fitted when assuming a Gaussian distribution of blood velocities instead of plug flow, which resulted in smaller ΔtA. Because in our study only four different PLD were acquired, our ability to test different models was limited. Because ΔtA was further decreased with the Gaussian distribution model, these results suggest that the contribution of ΔtA to fCBF signal is smaller in monkeys than in humans.
Table 3 summarizes the effect of the PLD on the ASL signal and functional ASL-signal modulation in V1. Both baseline and functional ASL tend to decrease with increasing PLD. Although not significant, this indicates a different weighting of the vascular and tissue compartments at different PLD. For the baseline CBF, this is well known and has been shown many times (Alsop and Detre, 1996). In addition, this indicates that at short PLD, fCBF changes originate in both the arterial and tissue compartment, with higher fCBF changes in the arterial compartment. Percent change, t-values, and number of activated voxels are values that are calculated from the ASL signal and ASL-signal modulation, and hence they depend on the baseline ASL signal as well as on the noise in the images. Although a useful measure for image quality and comparison with other studies, these parameters are interdependent, and therefore the interpretation is not straightforward. The monotonic decrease of the mean t-values with PLD shows that, although better localized in the parenchyma, contrast to noise of fCBF at long PLD is lower, with the result that activation is more difficult to detect. Because a short PLD would be preferable to use for the above-mentioned reasons of decreasing measurement duration and its higher t-values, its impact on fCBF needs to be known.
We assess the sensitivity of fCBF to vessels versus gray matter more directly, by calculating the intensity of activation as a function of cortical depth. This is possible in V1 because of the highly structured anatomy of the vascular bed where large pial vessels feed or drain small intracortical arteries and veins that are oriented perpendicularly to the cortical surface (Duvernoy et al, 1981; Weber et al, 2006). Capillary density varies with neuronal density and is highest around layer IV (Weber et al, 2006). Hence, a large functional signal at the surface signifies a larger contribution from large vessels, while in the case that functional activation is predominantly located in gray matter, the large-vessel contribution is decreased, and functional activation can be assumed to be predominantly derived from capillaries and small vessels. In our study, we found that GE-EPI BOLD and fCBF derived from the same scans resulted in very distinct patterns. The largest BOLD changes occurred at the surface, whereas the highest fCBF changes were localized in gray matter and peaked around layer IV. Although the short TE used in this study increases the contribution from large veins, our finding that the BOLD signal is located mostly at the surface agrees with previous results (Lee et al, 1999; Duong et al, 2000; Zhao et al, 2004; Goense and Logothetis, 2006).
Similar to the difference between BOLD and fCBF, any large-vessel contributions at short PLD should be evident in the profiles measured at different PLD. At a resolution of 0.75 × 0.9 × 2 mm3 at 7T we were able to resolve small but consistent changes in the profiles of fCBF activation for different PLD. Because this resolution is somewhat low to clearly visualize differences between vessels and parenchyma, additional data was acquired at a resolution of 0.375 × 0.333 × 2 mm3 at 4.7T. Although the CASL setup was similar for both data sets, the lower field and shorter TE will lead to a reduced BOLD contamination in the 4.7-T data compared with the 7-T data. T1 of arterial blood is shorter at lower field (1.7 versus 2.2 secs), which decreases venous signal in the CBF maps. The shorter LT (2 versus 3.7 s) reduces the fraction of signal in the gray matter relative to the vessel signal for a short PLD. All these effects will lead to an enhancement of the tissue versus vessel difference between PLD. In accordance to this, the profiles acquired at 4.7T clearly show that fCBF at the surface is larger for short PLD while at long PLD, the fCBF in layer IV is highest. It is not only the case that functional activation is larger at the surface for the short PLD, but also the baseline ASL signal and s.d. of the ASL signal are larger. Depending on the relative contributions of baseline ASL signal and s.d., the large surface signal might be enhanced or not show up in t-value maps. The s.d. of the BOLD signal is shown in Figure 7H. Here, the noise profile does not depend on the PLD, instead there is a huge difference of 20% between surface and gray matter which is not present in the ASL signal.
To summarize, in this study we show high-resolution CASL data from the macaque monkey at 4.7 and 7T, and investigated the effect of the labeling parameters on baseline and functional CBF maps. The results show that fCBF is less sensitive to large-vessel signal than baseline CBF. However, at short PLD there is still a significant large-vessel contribution to the fCBF signal. But at spatial resolutions coarser than 1 × 1 × 2 mm, these differences in specificity are not expected to substantially affect the activation maps. Thus, at lower resolution, and if absolute quantification of fCBF is not required, a shorter PLD can be used, leading to substantially decreased acquisition times and increased t-values, which facilitates the detection of activation. At high resolution, a long PLD is needed to decrease fCBF arising from vessels. In conclusion, whereas LT did not have much influence on the strength of the perfusion-based fMRI signal, we showed that the choice of PLD does affect the specificity of both baseline- and fCBF signal, particularly at high resolution. This will be of importance in high-resolution applications and when accurate quantification is required for studies in monkeys as well as in humans.
Footnotes
Acknowledgements
We thank our colleagues Kamil Uludag, Bruno Weber, and Alexander Kaiser for many valuable discussions and Mark Augath, Thomas Steudel, and Michael Beyerlein for technical assistance. We are also thankful to Harald Moeller and his colleagues at the MPI of Cognitive Neuroscience in Leipzig, and to Alfonso Silva of NINDS for helpful discussions at the start of this project. This work was supported by the Max-Planck Society and in part (HM) by the Intramural Research Program of the NIH (National Institute Neurological Disorders and Stroke), Bethesda, Maryland.