
Abstract
Computer simulations of stable xenon (sXe) uptake curves were used to evaluate the effect of xenon-induced flow activation on CBF calculations by xenon-enhanced computed tomography, Estimates of flow activation were based on repeated transcranial Doppler measurements of blood velocity during 4,5 minutes of sXe inhalation, The synthetic curves were generated from a generalized Kety equation that included time-varying blood flow activation, In contrast to the peak 35% increase in blood flow velocity during sXe inhalation, a standard analysis of the flow-varying synthetic curves revealed only minor 3% to 5% increases in calculated CBF. It is concluded that brief xenon inhalations can provide blood flow estimates that contain minimal bias from activation.
Xenon, an inert diffusable gas, has been widely used for the measurement of CBF, both in its radioactive (133Xe) and stable (sXe) forms (Obrist and Wilkinson 1990; Astrup et al., 1996). Because it is radiodense, inhalation of 26% to 35% sXe permits imaging of sXe uptake or clearance by computed tomography (CT) scan, from which CBF measurements can be derived. Like other inert gases, however, xenon is vasoactive at such concentrations. Using the intravenous 133Xe technique, Obrist et al. (1985) and Hartmann et al. (1991) reported mean CBF increases of 16% to 30% during 5- to 6-minute inhalations of 35% sXe in normal volunteers. Fast-compartment (gray matter) flows underwent even greater change (22% to 41%). These findings have raised concern about the validity of blood flow measurements by the Xe/CT method (Gur et al., 1989).
Using repeated transcranial Doppler measurements during 30% sXe inhalation, Giller et al. (1990) obtained comparable (~38%) increases in blood flow velocity from the middle cerebral artery of normal volunteers. The changes, however, were not uniform during the 5-minute inhalation, there being little increase during the first 1.5 minutes, followed by a gradual rise in velocity that peaked at 4 to 5 minutes. A similar time course has been reported in patients during Xe/CT CBF measurements (Witt et al., 1991), in whom an 18% increase in velocity was obtained.
Assuming that changes in blood flow mimic those of blood velocity, Good and Gur (1991) performed computer simulations of sXe uptake curves, based on a linear 15% to 45% increase in CBF between 1.5 and 2.0 minutes. Similar curves were generated by Witt et al. (1991), who assumed linear CBF increases throughout the 5-minute inhalation period. In both studies, analysis of the synthetic curves by the standard Xe/CT algorithm (Gur et al., 1989) revealed less than 5% augmentation of CBF values relative to the assumed, nonactivated blood flow level. It should be noted that the increase in computed blood flow was considerably less than the simulated CBF change, a finding that might be attributed to the delayed rise in CBF.
The present study was designed to confirm and extend these findings by generating more realistic uptake curves derived from blood velocity observations. Rather than assuming discrete CBF changes at particular time points, the Kety equation describing sXe uptake and clearance (Kety, 1951) was generalized to include time-varying changes in blood flow (Jaggi and Noordergraaf, 1995), i.e., CBF = f(t). Analysis of the resulting uptake curves by the traditional Kety equation, in which CBF is constant, permitted assessment of the influence of sXe activation on routinely calculated CBF values.
METHODS
Based on evidence that changes in CBF and middle cerebral artery blood flow velocity are highly correlated (Bishop et al., 1986), measurements of transcranial Doppler velocity during sXe inhalation were used to simulate CBF activation in a standard Xe/CT protocol. Figure 1 presents the mean change in velocity during 4.5 minutes of 33% sXe inhalation in 10 normal control subjects, taken from a previous study (Obrist et al., 1992). Values obtained every 30 seconds progressively increased to 35% above baseline by the end of inhalation. Because CBF was assumed to follow the same time course, i.e., undergo proportional changes, synthesis of the uptake curves was based on these velocity measurements. Only noise-free curves were generated, as assessment of systematic bias did not require the addition of random noise.
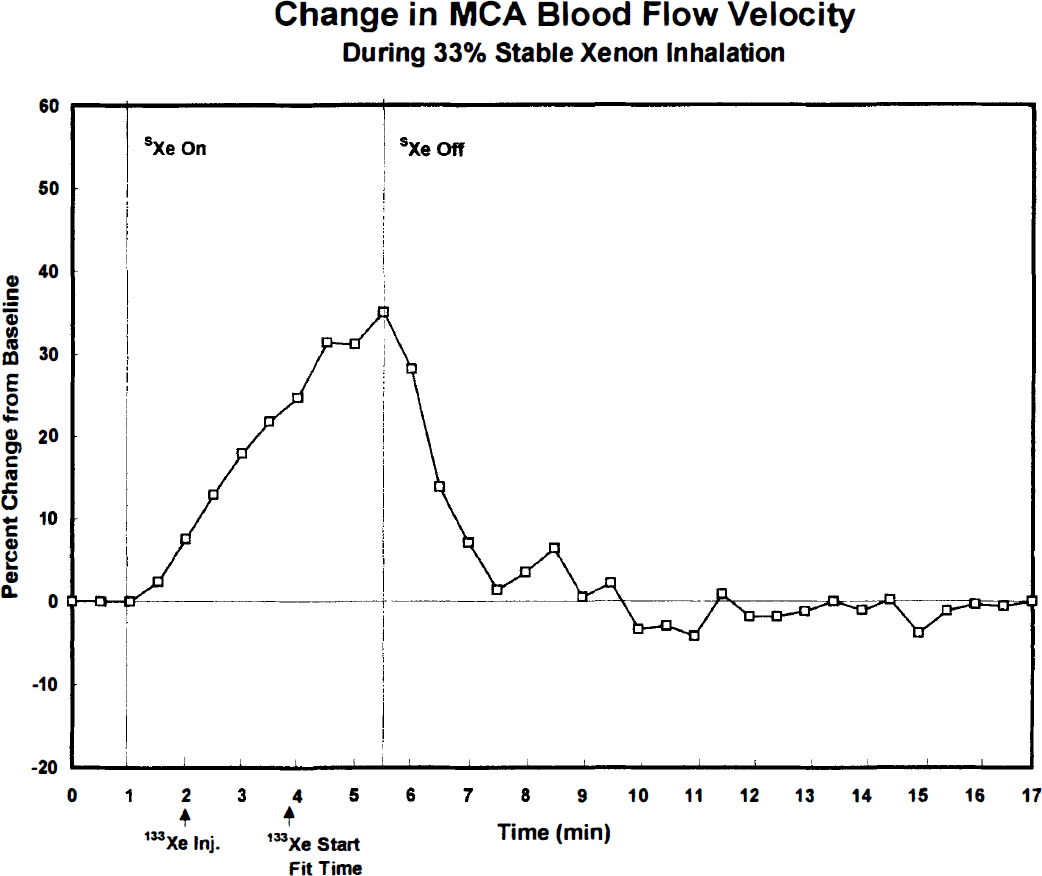
Mean percent change in middle cerebral artery (MCA) blood flow velocity during 33% sXe/67% O2 inhalation, as determined by transcranial Doppler measurements at 30-second intervals in 10 young adult males (Obrist et al., 1992). Blood velocity gradually increased during the 4.5-minute sXe inhalation, reaching a peak value of 35% ± 13% (mean ± SD) above preinhalation baseline values. Concurrent CBF measurements by the intravenous 133Xe method yielded a 28% ± 17% increase from baseline values. Arrows indicate the time of 133Xe injection and start of clearance curve fitting (see Discussion). Note the rapid decline in blood velocity after terminating sXe inhalation.
In the steady-state condition, tissue xenon concentration, C(t), can be described by:
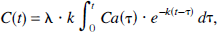
where Ca(t) is the arterial input, λ the partition coefficient, k an exponential rate constant, and λ · k = f, the blood flow (Kety, 1951). This equation is valid only when blood flow is constant; it is not applicable to the activated condition.
To describe blood flow activation, the above equation can be generalized to a non—steady state (Jaggi and Noordergraaf, 1995; Kreyszig, 1972):

where k(t) is a function of time, indicating that blood flow undergoes change during the course of measurement.
Equation (2) was used to generate concentration-time curves for three types of cerebral tissue: gray matter, mixed gray and white matter, and white matter. Normal baseline (nonactivated) CBF values were assigned to each tissue: 80, 50, and 20 mL·100 g−1·min−1, respectively. The corresponding k and λ (lambda) values are given in Table 1. Figures 2 through 4 show the three activated tissue curves, labeled k = k(t), in which the k values increased during sXe inhalation. Two steady-state tissue curves, baseline and activated, are also shown for comparison (see Discussion).
One-compartment analysis* of simulated Xe/CT data
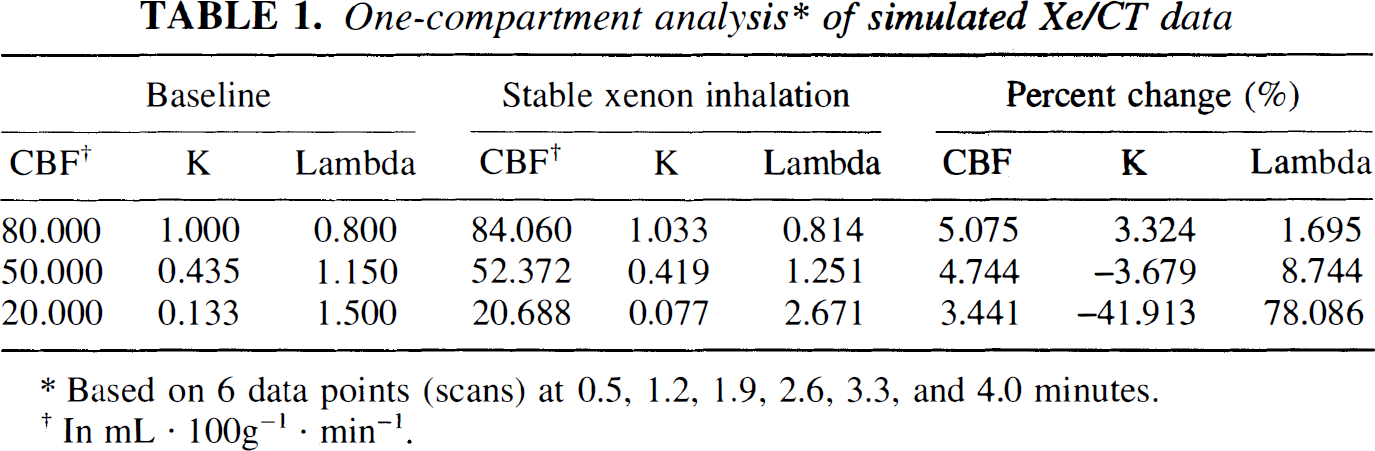
Based on 6 data points (scans) at 0.5, 1.2, 1.9, 2.6, 3.3, and 4.0 minutes.
In mL · 100g−1 · min−1.
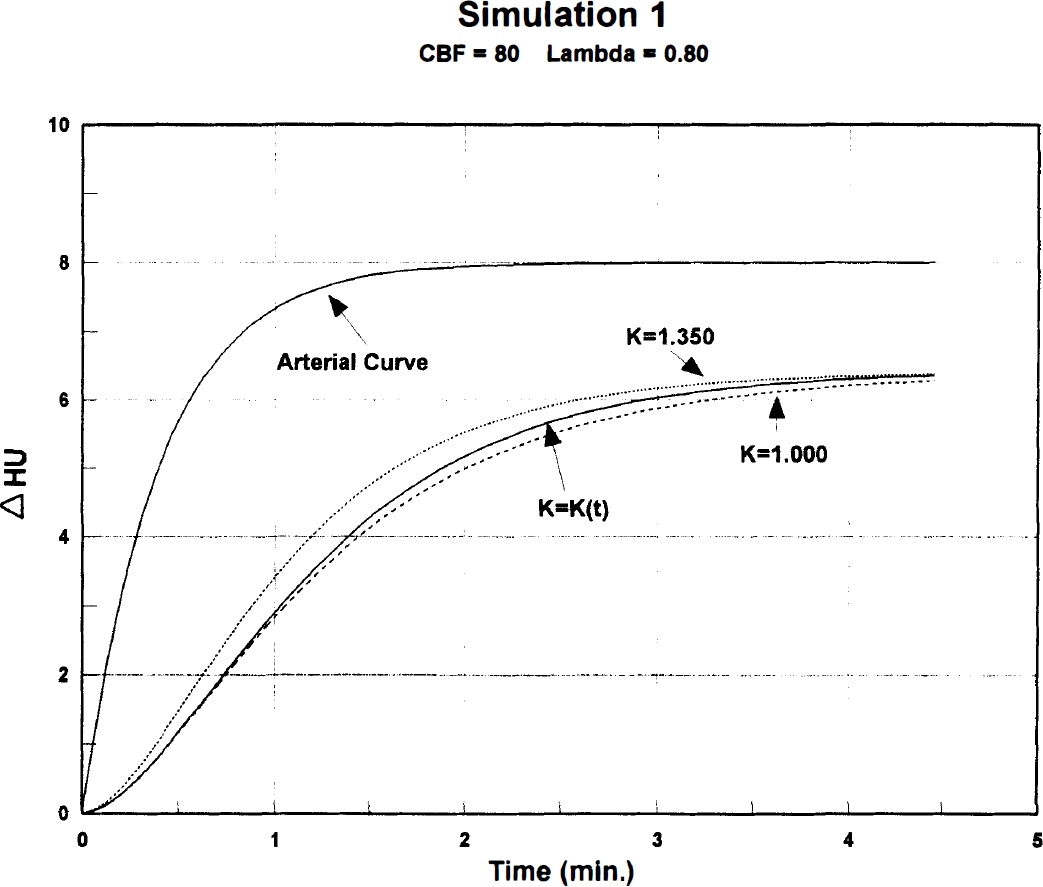
Noise-free, synthetic sXe concentration-time curves for cerebral gray matter generated from a typical arterial input by means of Equation (2). Δ HU = CT scan density changes (Hounsfield units) during 4.5-minute sXe inhalation. Dashed line (lower): k = 1.00, nonactivated baseline CBF = 80 mL·100 g−1·min−1, partition coefficient (lambda) = 0.80. Solid line (middle): k = k(t), time-varying activated blood flow derived from blood velocity measurements (Fig. 1). Dotted line (upper): k = 1.35, steady-state activated increase of 35% corresponding to the peak velocity change.
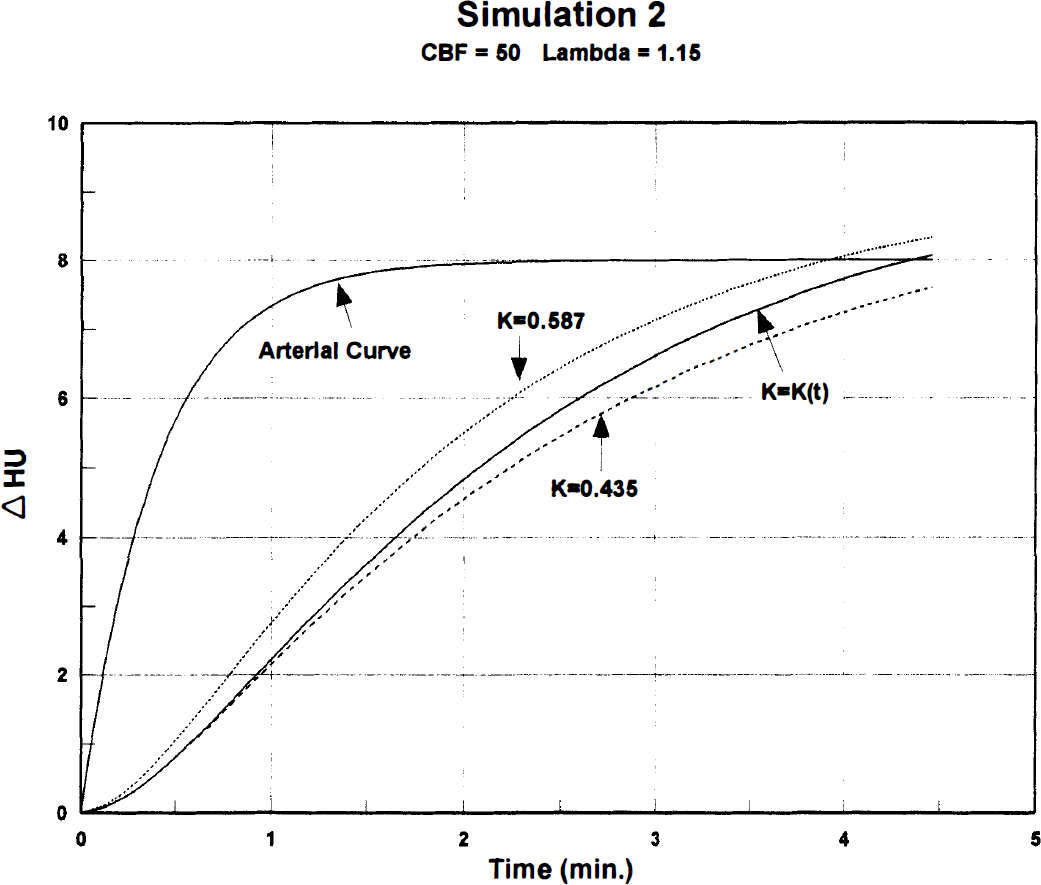
Synthetic sXe concentration-time curves representing mixed cerebral gray and white matter. Nonactivated baseline CBF = 50 mL·100 g−1·min−1, lambda =1.15. Curve definitions are the same as in Fig. 2, except for different k values.
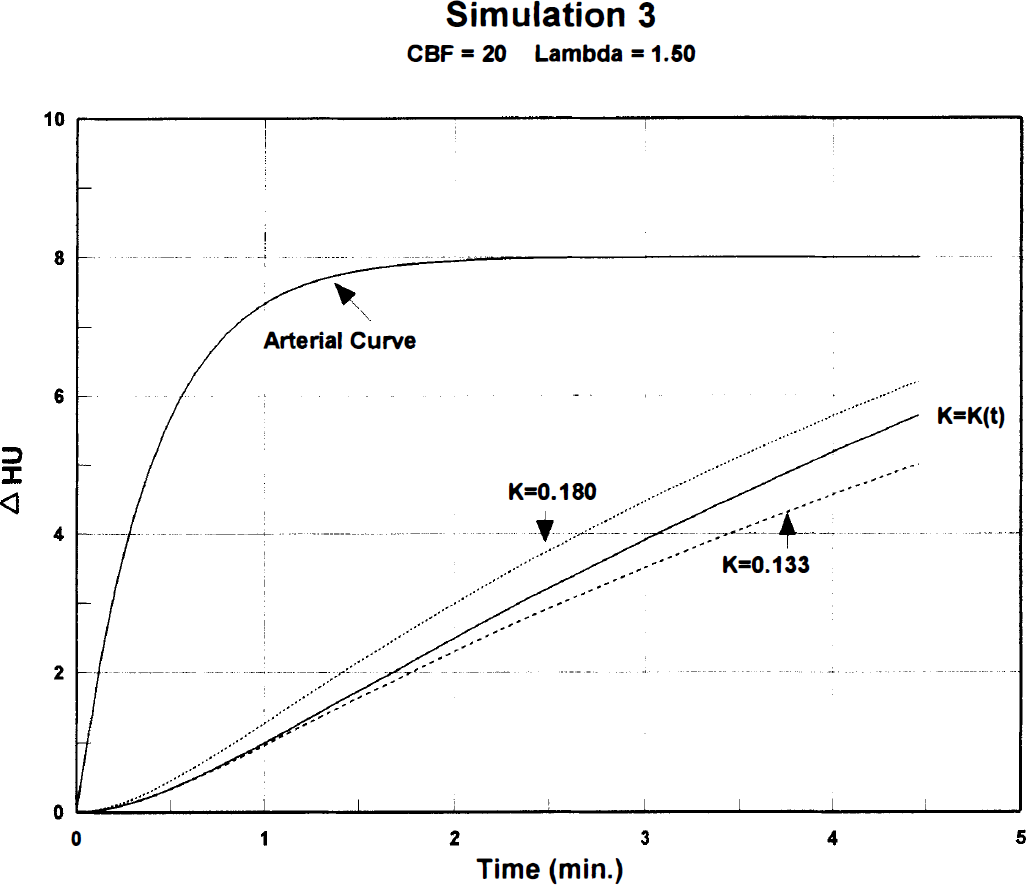
Synthetic sXe concentration-time curves representing cerebral white matter. Nonactivated baseline CBF = 20 mL·100 g−1·min−1, lambda = 1.50. Curve definitions are the same as in Fig. 2, except for different k values.
A typical sXe expired air curve served as the arterial input for the simulations (Figs. 2–4). Interpolation of the end-tidal peaks provided 12 data points per minute, which were numerically integrated in equation (2), using the trapezoid rule.
Analysis of the synthetic curves was performed with equation (1), thus replicating the standard Xe/CT calculation where k is assumed constant. As in the synthesis, numerical integration of the arterial input was performed. Six data points were selected on the tissue curve for analysis, corresponding to six CT scans at 0.7-minute intervals, a typical scanning protocol (see footnote, Table 1). Solutions for the nonlinear parameter k were obtained by a least squares fit of the six data points, using a rapidly converging minimization routine (Rosenbrock, 1960). Given the value of the exponent k, the coefficient f = λ · k was determined by linear regression at each iteration (Obrist et al., 1975), the final value being the desired CBF.
RESULTS
Table 1 presents analyses of the three simulated curves based on equation (1), where k is assumed to be constant. For each level of baseline flow, sXe inhalation produced an increase in the calculated CBF, ranging from 3.4% (white matter) to 5.1% (gray matter).
Values for k are also presented in Table 1 along with lambda, the partition coefficient (λ = f/k). Unlike CBF, which deviated only slightly from baseline values, k underwent a large decrease at the lowest blood flow level. This resulted in a correspondingly large but reciprocal increase in λ, as previously described (Witt et al., 1991).
DISCUSSION
The present findings confirm previous reports (Good and Gur, 1991; Witt et al., 1991) that calculated CBF values, based on the traditional Kety equation, are minimally increased by blood flow activation during 4.5 minutes of sXe inhalation. The small 3% to 5% change contrasts with a peak blood velocity increase of 35% at the end of inhalation (Fig. 1), and with a CBF increase of 28% obtained concurrently by the intravenous 133Xe technique (Obrist et al., 1992). The latter can be attributed to delayed 133Xe injection, so that clearance curve fitting started after 3 minutes of sXe inhalation when flow activation was well underway (Fig. 1). Similar delays in 133Xe start fit time may explain the relatively high CBF values obtained in previous studies (Obrist et al., 1985; Hartmann et al., 1991). Because flow activation varies with time, neither peak blood flow velocity nor delayed 133Xe CBF measurements reflect the actual change that occurs during sXe inhalation.
Figures 2 through 4 compare the time-varying activated curve [k = k(t)] with two steady-state uptake curves at the three simulated blood flow levels. In each graph, the lower curve represents the “true” baseline flow, and the upper one a constant 35% CBF activation corresponding to the peak velocity change. Of interest is the close proximity of the baseline (lower) and flow-varying (middle) curves during the first 2 minutes of sXe inhalation. The initial three scans (data points) were obtained during this period before activation produced appreciable curve distortion, which may account for the small 3% to 5% error in calculated CBF values.
Construction of synthetic uptake curves in the present study was based on the assumption that changes in transcranial Doppler blood velocity follow the same time course as CBF changes during sXe inhalation. Unfortunately the temporal resolution of the 133Xe CBF measurements in the prior study (Obrist et al., 1992) did not permit adequate description of their time course. A pair of CBF values was obtained, however, one at baseline and the other after 3 minutes of sXe inhalation. A product-moment correlation of 0.93 (P < 0.001) was found between the percent CBF increase and percent change in transcranial Doppler velocity shown in Fig. 1. This strongly suggests, but does not prove, the validity of the underlying assumption.
The present simulations covered a range of blood flows from 20 to 80 mL·100 g−1·min−1. Although the former was designed to represent normal white matter flow (k = 0.133, λ = 1.5), the obtained 3.4% CBF activation (Table 1) might also apply to reduced gray matter flows of 20 mL·100 g−1·min−1 or less. Given a normal gray matter lambda of 0.8, the assumed baseline k of 0.133 corresponds to an “ischemic” flow of 11 mL·100 g−1·min−1.
As shown in Table 1, high values of lambda were found at the lower blood flow levels. Because of reciprocal changes in k, stable CBF estimates were nevertheless obtained (f = λ · k). The elevated λ at low CBF levels led Witt and coworkers (1991) to caution against interpretation of partition coefficients derived from short inhalations. Longer inhalation times (up to 15 minutes) may be required to obtain valid partition coefficients for white matter and pathologically low flows (Segawa, 1995).
It should be emphasized that the present results are based on a relatively brief 4.5-minute sXe inhalation. Simulation studies in which random CT noise was added to the curves have shown decreased error in CBF estimation (smaller SD) for longer inhalation times and for curve fitting of both sXe uptake and clearance (Polacin et al., 1991). The benefit of such protocols, however, should be weighed against the possibility of increased bias from activation. Because distortion of the uptake curves becomes greater with time (Figs. 2–4), prolonging the inhalation may increase the bias. Good and Gur (1991) found that a 3-minute washin/5-minute washout protocol more than doubled the bias caused by activation. Further investigation is clearly needed to establish the optimal scanning protocol, i.e., the trade-off between reduced computational error caused by CT noise versus a reduction in activation bias. An important consideration in this regard is head-motion artifact, which is considerably less with brief inhalations (Kalender et al., 1992).
In conclusion, sXe-induced flow activation has only a minor effect on the analysis of brief 4.5-minute uptake curves. Clinical studies based on such protocols (Johnson et al., 1991) should be relatively free of activation bias, both at low and high CBF levels.
Footnotes
Acknowledgment
The authors thank Dr. Jurg L. Jaggi at the University of Pennsylvania for his consultation on the mathematical aspects of this article.