
Abstract
Increases in the T1 of brain tissue, which give rise to dark or hypointense areas on T1-weighted images using magnetic resonance imaging (MRI), are common to a number of neuropathologies including multiple sclerosis (MS) and ischaemia. However, the biologic significance of T1 increases remains unclear. Using a multiparametric MRI approach and well-defined experimental models, we have experimentally induced increases in tissue T1 to determine the underlying cellular basis of such changes. We have shown that a rapid acute increase in T1 relaxation in the brain occurs in experimental models of both low-flow ischaemia induced by intrastriatal injection of endothelin-1 (ET-1), and excitotoxicity induced by intrastriatal injection of N-methyl-
Introduction
Despite the ever increasing use of magnetic resonance imaging (MRI) in clinical neurology, there are still a number of changes in the MRI signal that are not completely understood with respect to the underlying cellular alterations. Increases in the T1 of brain tissue, manifest as dark or hypointense areas on T1-weighted images, have been reported to occur in a number of diverse neuropathologies. However, although the factors governing the T1 relaxation rate of protons in pure water are largely understood, this is not the case in complex biologic systems such as the brain. This has led us to investigate the pathologic cellular processes that may underlie this phenomenon, including the potential role of astrocytes in generating changes in the T1 of brain tissue in pathology.
In animal models, it has been shown that an increase in the T1 relaxation of tissue water can develop several hours after the onset of cerebral ischaemia, and that this reflects vasogenic oedema and net water accumulation (Kato et al, 1985). Such changes are linked with increases in T2 relaxation and are thought to indicate cell injury or death. More recently, however, it has become apparent that increases in T1 can occur within minutes of the onset of cerebral ischaemia, in the absence of T2 changes, and may provide a much earlier indication of tissue injury (Calamante et al, 1999; Ewing et al, 1999; Kettunen et al, 2000; Lythgoe et al, 2000).
As these acute changes in T1 are not associated with overt blood—brain barrier (BBB) breakdown and the formation of vasogenic oedema, a number of alternative explanations have been proposed, including changes in the water environment, cellular structure, protein content, and oxygenation of the tissue. However, these changes in T1 develop before the majority of immunohistochemically detectable changes and the underlying cause remains unclear.
In MRI studies of the human brain, one of the most common occurrences of increased T1 (so-called T1 ‘black holes’) is in multiple sclerosis (MS), in which the hypointensity load on T1-weighted images is believed to be a good indicator of disease intensity. Such T1 hypointensities in MS are generally considered to represent chronic MS lesions in which there is myelin breakdown and axonal loss (van Walderveen et al, 1998). However, it has also been shown that lesions may appear acutely hypointense, before contrast enhancement and at a time when axon and myelin loss is likely to be minimal (van Waesberghe et al, 1997, 1998). Acute and reversible increases in T1 have also been reported in an animal model of MS (Pirko et al, 2004). The cause of these early changes in T1 relaxation is unknown, but they challenge the concept that hypointensity on T1-weighted images (i.e., increased T1 relaxation) in MS always reflects irreversible axonal loss.
Previously, acute increases in T1 have been shown in models of cerebral ischaemia; however, it is unclear which component of the ischaemic lesion is responsible for these changes. Therefore, in the current study, we have sought to separate the effects of reduced perfusion and cytotoxic events per se on the T1 of brain tissue by comparing a model of low-flow ischaemia in rat brain induced by intrastriatal injection of the vasoconstrictor endothelin-1 (ET-1) (Fuxe et al, 1992; Hughes et al, 2003; Ueki et al, 1993) with a model of N-methyl-
Both our ET-1- and NMDA-induced lesions are associated with hyper-acute activation of astrocytes, the primary hallmarks of which are hypertrophy of cellular processes, and upregulation of glial fibrillary acidic protein and other proteins (Pekny and Nilsson, 2005). In neurologic patients, acute astrocyte activation is common feature of many diseases, including MS and stroke. Therefore, we investigated whether activation of astrocytes could be the common factor underlying the early changes in tissue T1 observed during ischaemia and other neuropathologies. Recently, it has been shown that arundic acid can inhibit astrocyte activation in vivo, and we have used this approach to examine the effect of astrocyte activation on T1 relaxation changes after intracerebral ET-1 injection.
It has also been shown that both ET-1 and NMDA can induce spreading depression (SD) and that cortical SD, induced by KCl, gives rise to transient increases in T1 (Stanisz et al, 2002). Furthermore, SD has been found to be accelerated in mice with reduced intercellular astrocytic communication (Theis et al, 2003), as might be anticipated after astrocyte activation in disease (Brand-Schieber et al, 2005). Therefore, we also examined the possibility that SD might underlie the observed changes in T1. In this study, we show that astrocyte activation, but not SD, is likely to underlie the T1 changes in these experimental models.
Materials and methods
Adult male Wistar rats (Harlan UK Ltd, Bicester, Oxon, UK), weighing 200 to 250 g, were anaesthetised with 2.0% isoflurane in 70% N2O/30% O2. Using a <50 μm-tipped glass pipette, animals were stereotaxically injected in the left striatum (coordinates: 1 mm anterior to Bregma, 2.6 mm lateral, and 4.5 mm deep from cortical surface), via a burr hole in the skull, over a 2-min period. All procedures were approved by the UK Home Office.
Experimental Protocol
Four MRI studies were performed as follows:
Multiparametric EPI study: Animals were intrastriatally microinjected with 1 μL of saline containing (a) 25 pmol ET-1 (n = 4), (b) 25 pmol of the highly selective ETB agonist IRL-1620 (n = 4), or (c) 56 nmol of NMDA (n = 5). Echo-planar imaging data sets (see below) were acquired pre-injection and every 20 mins post-injection up to 2 h. CBV/BBB study: Animals were intrastriatally microinjected with 1 μL of saline containing (a) 25 pmol ET-1 (n = 3), (b) 25 pmol of a highly selective ETB agonist, IRL-1620 (Takai et al, 1992) (Tocris Cookson Ltd, Bristol, UK) (n = 3), or (c) 56 nmol of NMDA (n = 3). T1-weighted, cerebral blood volume (CBV) and postgadolinium-DTPA-BMA (gd) T1-weighted data (see below) were acquired pre-injection and every 20 mins post-injection up to 2 h in group (a) and up to 1 h in groups (b) and (c). Not all animals were imaged pre-injection and consequently n =7 for the pre-injection time point. Astrocyte activation study: Animals were injected intravenously via a tail vein with 30 mg/kg arundic acid in 0.2 mL saline (n = 8) 30 mins before intrastriatal injection with 25 pmol ET-1 in 1 μL of saline and compared with animals injected with ET-1 (25 pmol) alone (n = 5). T1-weighted data were acquired every 20 mins post-injection up to 1 h. In a subset of this group (n = 3), CBV data were also acquired every 20 mins post-ET-1 injection up to 1 h. SD study: Animals were intrastriatally microinjected with 1 μL of 250 mmol/L KCl (n = 2), and T1-weighted data were acquired every 20 mins post-injection up to 1 h.
Magnetic Resonance Imaging
Animals were positioned in a quadrature birdcage coil (inner diameter 5 cm; length 6 cm) and anaesthetised with 1.7% isoflurane in 70% N2O/30% O2. ECG and respiration rate were monitored throughout, and body temperature was maintained at ~37°C. Magnetic resonance images were acquired using a 7T horizontal bore magnet with a Varian Inova spectrometer (Varian, Palo Alto, CA, USA). In all cases, 1-mm-thick coronal images were acquired through the injection site.
In the multiparametric EPI study, a series of EPI data were acquired using a spin-echo EPI sequence for calculation of T1 maps (TR = 5 secs, Ti = 0.025, 0.25, 0.5, 0.75, 2.0, 5.0 secs; TE = 20 ms), T2 maps (TR = 5 secs; TE = 26, 36, 46, 56, 66, 76, 86 ms), ADC trace maps (TR = 5 secs; TE = 45 ms; δ/Δ = 12/17 ms; b = 125, 500, 1,000, 1,500 smm−2), and MTR maps (TR = 5 secs; TE = 26 ms; ±saturation pulses −1,500 Hz from 1H frequency). The MT saturation pulses were 32-ms duration Gaussian pulses truncated at 10% amplitude. Each pulse had an effective flip angle of 90° with a peak B1 strength of 158 Hz (equivalent time-averaged B1 field of 65 Hz). The MT pulse train consisted of 12 pulses back to back yielding a total irradiation time of 384 ms and total flip angle of 1080°. For calculation of the ADC trace maps (Basser et al, 1994), diffusion-weighted images were acquired with the diffusion gradients applied separately along three orthogonal axes. Magnetisation transfer ratio maps were calculated as M0–MSAT/M0, where MSAT and M0 are the signal amplitudes obtained with and without saturation, respectively. The matrix size and field of view for all EPI acquisitions were 50 × 64 and 3 × 4 cm, respectively.
In the CBV/BBB study, CBV maps were obtained from a time series of gradient echo images (TR = 20 ms, TE = 10 ms, flip angle = 20°) during bolus injection of the intravascular contrast agent gd (Sibson et al, 2002). T1-weighted images were acquired using a spin-echo sequence (TR = 500 ms, TE = 20 ms) both before and 10 mins after contrast agent injection to ensure BBB integrity. The same sequence and parameters were used to obtain non-contrast enhanced T1-weighted images in the arundic acid study. The matrix size and field of view were 128 × 128 and 5 × 5 cm, respectively, for all images, except for the regional CBV data which were acquired with a 128 × 64 matrix and a 5 × 4 cm field of view.
Magnetic Resonance Imaging Data Analysis
For analysis of EPI data sets, regions of interest encompassing the striatum were defined for each hemisphere on the T2 map obtained pre-injection and applied to all calculated data maps for quantitation. For analysis of the CBV maps, regions of interest encompassing the striatum were defined for each hemisphere on an anatomical T2-weighted image obtained pre-injection and applied to the calculated CBV maps for quantitation. These data are expressed as a ratio of injected/non-injected striatal values. Post-gd T1-weighted images were assessed qualitatively for evidence of BBB breakdown and contrast enhancement. In the arundic acid study, areas of signal decrease on T1-weighted images (i.e., increased T1) were thresholded, outlined manually, and the areas calculated.
Electrophysiology
In addition, an electrophysiologic study was performed in three further groups of animals, which were intrastriatally microinjected with (a) 25 pmol ET-1 in 1 μL of saline, (b) 1 μL saline, or (c) 1 μL of 250 mmol/L KCl. Electrophysiologic recordings (see below) were made continuously from 30 mins pre-injection to 30 to 60 mins post-injection.
Animals (n = 13) were anaesthetised with 1.7% isoflurane in 70% N2O/30% O2 and placed in a stereotaxic frame. Core temperature was maintained at 37°C throughout. A glass capillary electrode (20 μm outer diameter tip) filled with physiologic saline was glued to the injection pipette to monitor electrophysiologic changes precisely at the striatal site of ET-1 or KCl injection (coordinates: 1 mm anterior to Bregma, 2.6 mm lateral, and 4.5 mm deep from cortical surface). In addition, a second glass microelectrode was implanted in either the dorsolateral striatum (n = 5 for ET-1 injection; coordinates: 1 mm anterior to Bregma, 3.8 mm lateral, and 3.5 mm deep from cortical surface) or frontoparietal cortex (n = 1 for ET-1 injection and n = 7 for KCl injection; coordinates: 1 mm anterior to Bregma, 3.8 mm lateral, and 1 mm deep from cortical surface). The lack of effect of the vehicle (1 μL saline) was confirmed in one supplementary experiment in which both recording sites were in the striatum. In the seven experiments performed to examine the electrophysiologic changes associated with KCl-induced SD in the striatum, the injection micropipette was filled with 250 mmol/L KCl.
Both EEG and DC potential were derived from the potential between each recording electrode and an Ag/AgCl reference electrode placed under the scalp. This signal was first amplified with a high-impedance input, AC/DC pre-amplifier (NL102G; Neurolog System, Digitimer Ltd, Welwyn Garden City, UK). The alternating current component in the 1 to 30 Hz window (× 5000 overall amplification) provided the EEG, and the DC component (× 250 overall amplification) yielded the extracellular DC potential. All the recorded variables were continuously digitised, displayed, and stored using a personal computer equipped with an analogue/digital converter. Spreading depression was identified as a transient, negative shift in the extracellular DC potential.
Immunohistochemistry
To identify leucocyte populations and look for evidence of astrocyte activation, frozen, 10-μm-thick serial coronal sections were cut from tissue blocks, through the injection site in the brain. Using immunohistochemistry under standard conditions, neutrophils were identified using anti-neutrophil serum (Anthony et al, 1998), and activated macrophages and recruited monocytes were identified using the anti-ED-1 serum or OX42, which recognises CR3/Mac-1 (Serotec, Oxford, UK). Rabbit anti-glial fibrillary acidic protein (2 mg/mL; Abcam, Oxford, UK) was used to identify astrocyte activation. For all immunohistochemistry, primary antibodies were detected with the relevant biotinylated IgG, amplified using standard ABC, and immunopositivity was revealed with 3,3′-diaminobenzidine (DAB) (Vector Laboratories, Peterborough, UK). Tissue sections were counterstained with cresyl violet.
Statistics
For the CBV data, repeated measures ANOVA was used to determine effects of time on the left/right ratio in each group individually, followed by student Newman—Keuls tests to evaluate pair-wise differences. In addition, each time point was compared with the control group using pair-wise t-tests. For the EPI data sets, because measurements of absolute T1, T2, ADC, and MTR were made for each hemisphere, two-way repeated measures ANOVA was used to determine differences both within each hemisphere and between hemispheres over time. Subsequently, pair-wise Newman—Keuls tests were used to isolate specific differences between hemispheres. For analysis of the areas of T1 hypointensity in study (iv), repeated measures ANOVA followed by post hoc pair-wise Newman—Keuls tests were used.
Results
Effect of Endothelin-1, IRL-1620, and N-Methyl-d-Aspartate on the T1, T2, Apparent Diffusion Coefficient, and Magnetisation Transfer Ratio of Tissue Water
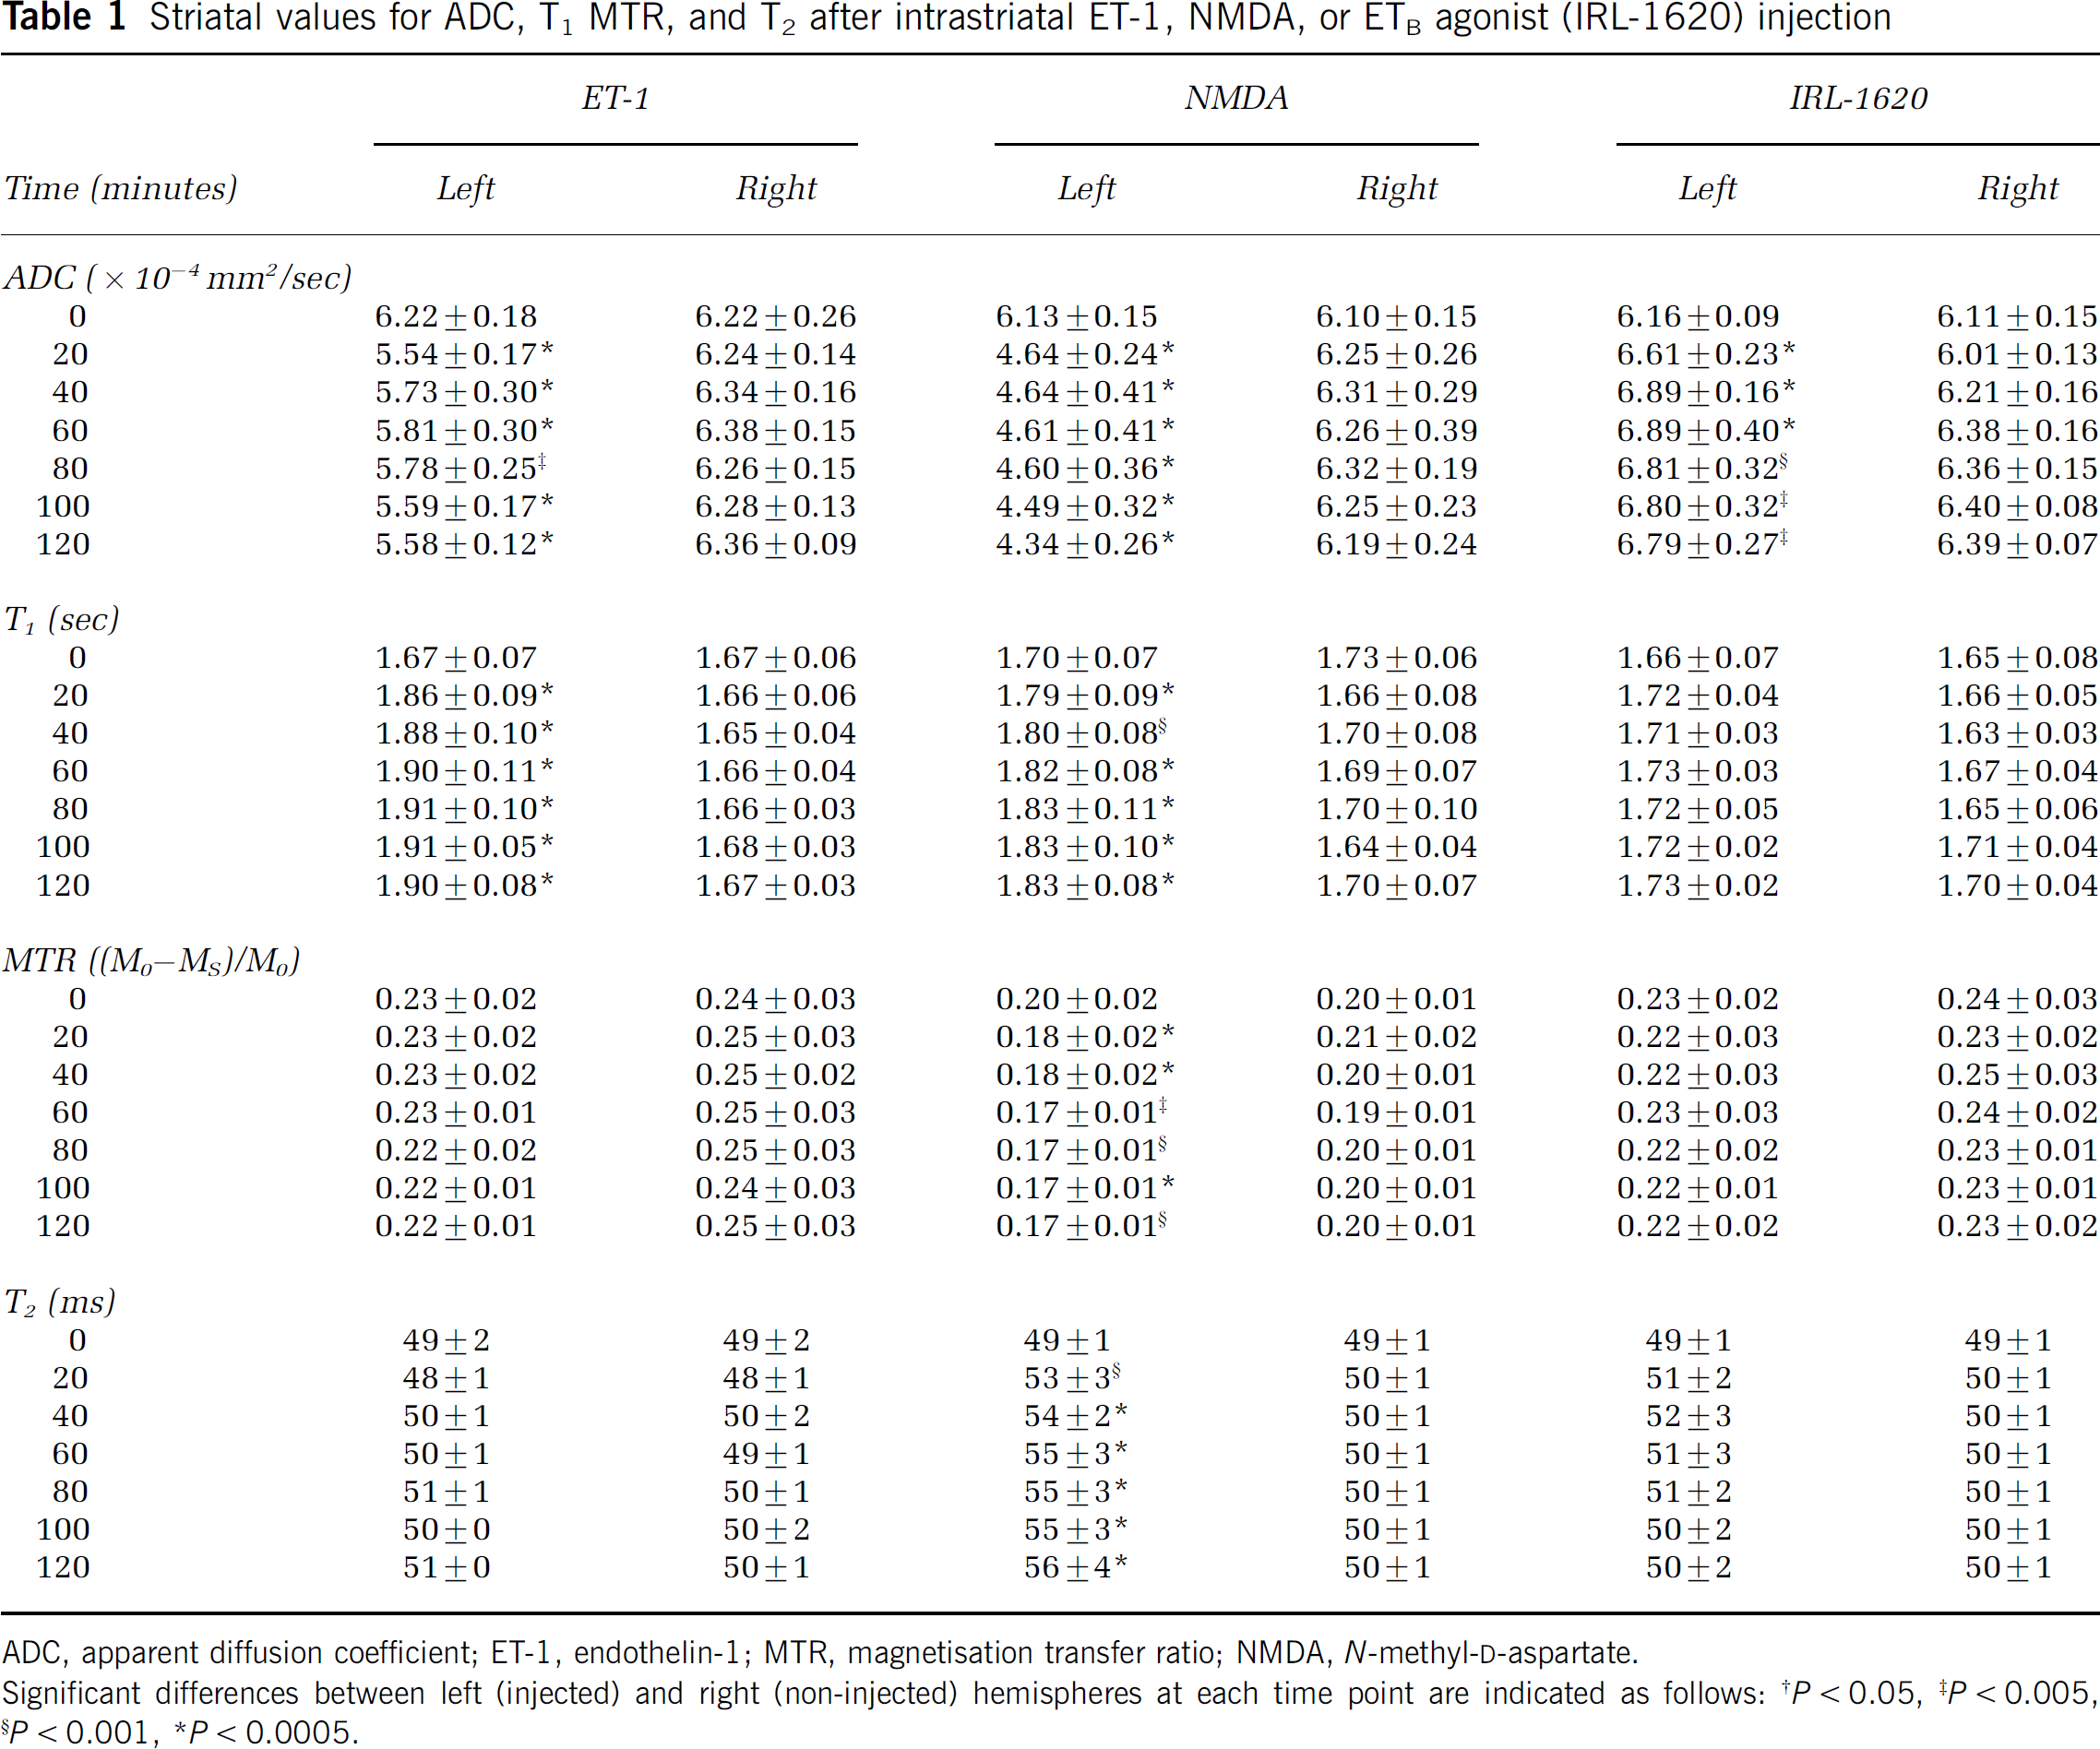
The T1 of the injected striatum was significantly increased throughout the 2 h period after both ET-1 and NMDA injection compared with both pre-injection values (Figure 1A) and the contralateral hemisphere (Table 1). Spatially, the areas of increased T1 in both ET-1- and NMDA-injected animals did not exactly match those of changes in any of the other MRI parameters, although in most cases there was overlap. In the case of ET-1-injected animals in which higher resolution images were obtained, it was clear that the area of increased T1 quite closely matched that of reduced CBV (Figures 4A and 4C), and was more extensive than the area of reduced ADC (Figure 4B). In the animals injected with the ETB agonist, although there appeared to be a mild increase in T1 of the injected striatum (Figure 1A; Table 1) this was not significant.
Striatal values for ADC, T1 MTR, and T2 after intrastriatal ET-1, NMDA, or ETB agonist (IRL-1620) injection
ADC, apparent diffusion coefficient; ET-1, endothelin-1; MTR, magnetisation transfer ratio; NMDA, N-methyl-
Significant differences between left (injected) and right (non-injected) hemispheres at each time point are indicated as follows
P < 0.05
P < 0.005
P < 0.001
P < 0.0005.
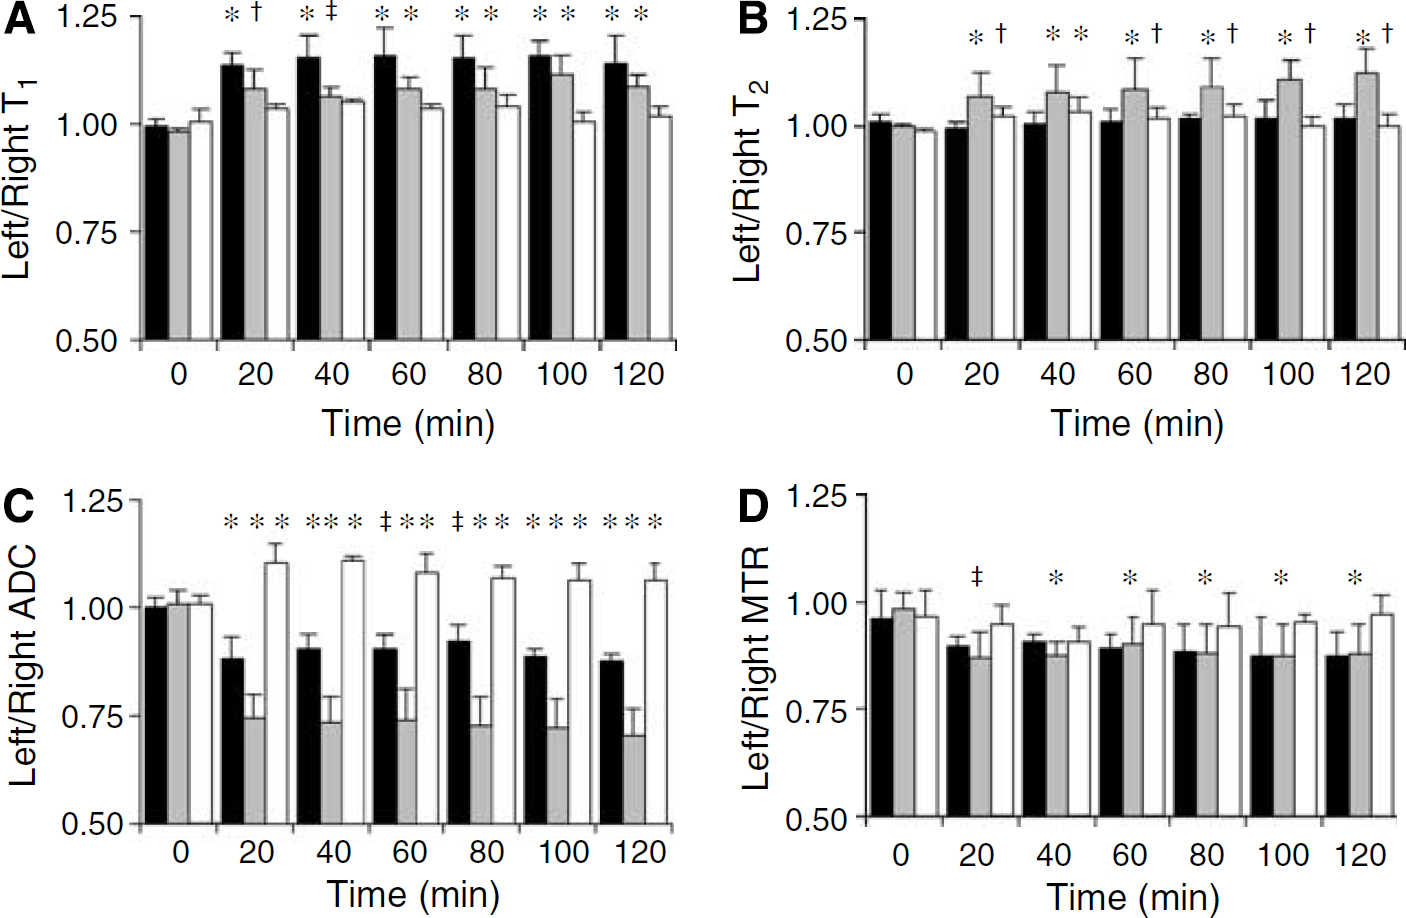
Quantitative multiparametric EPI data. Graphs showing the temporal effects of a focal striatal injection of ET-1 (25 pmol; black bars), NMDA (56 nmol; grey bars), and the ETB agonist IRL-1620 (25 pmol; white bars) on (
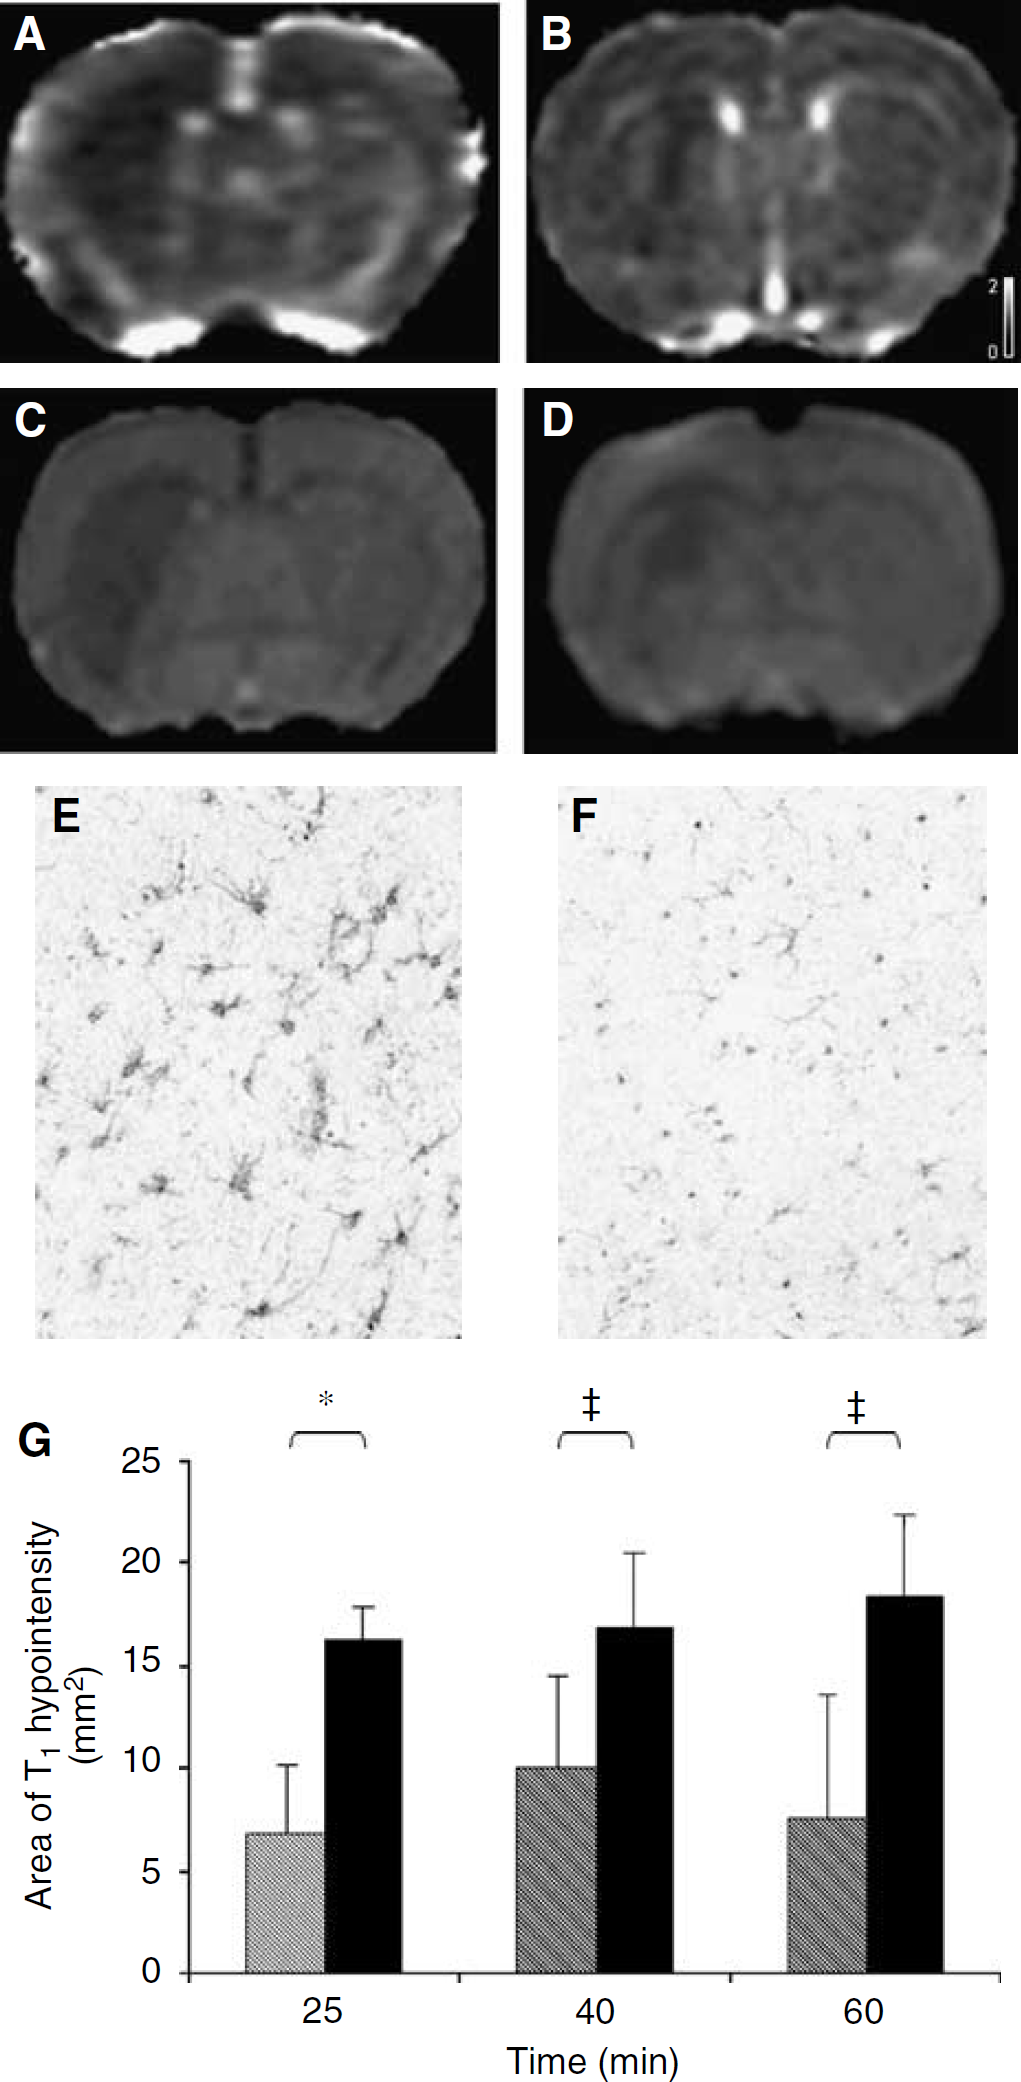
Effects of arundic acid on T1 changes. (
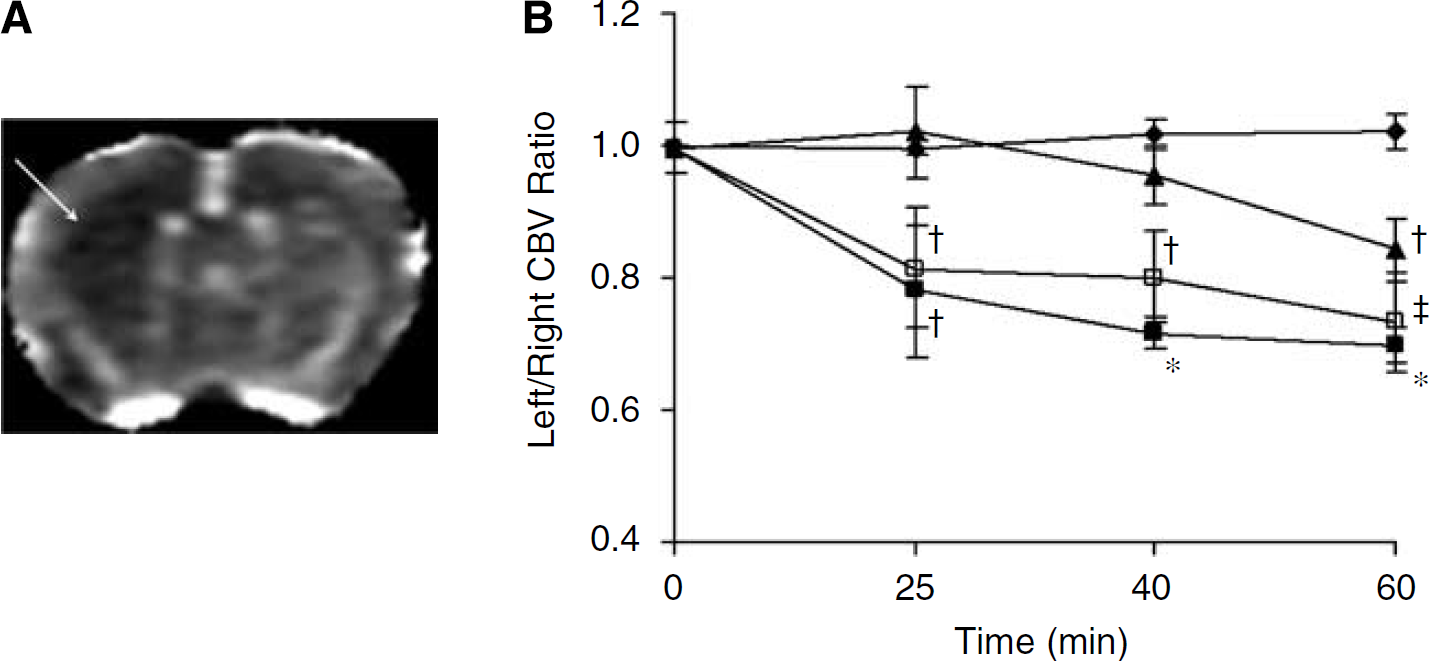
CBV data. (
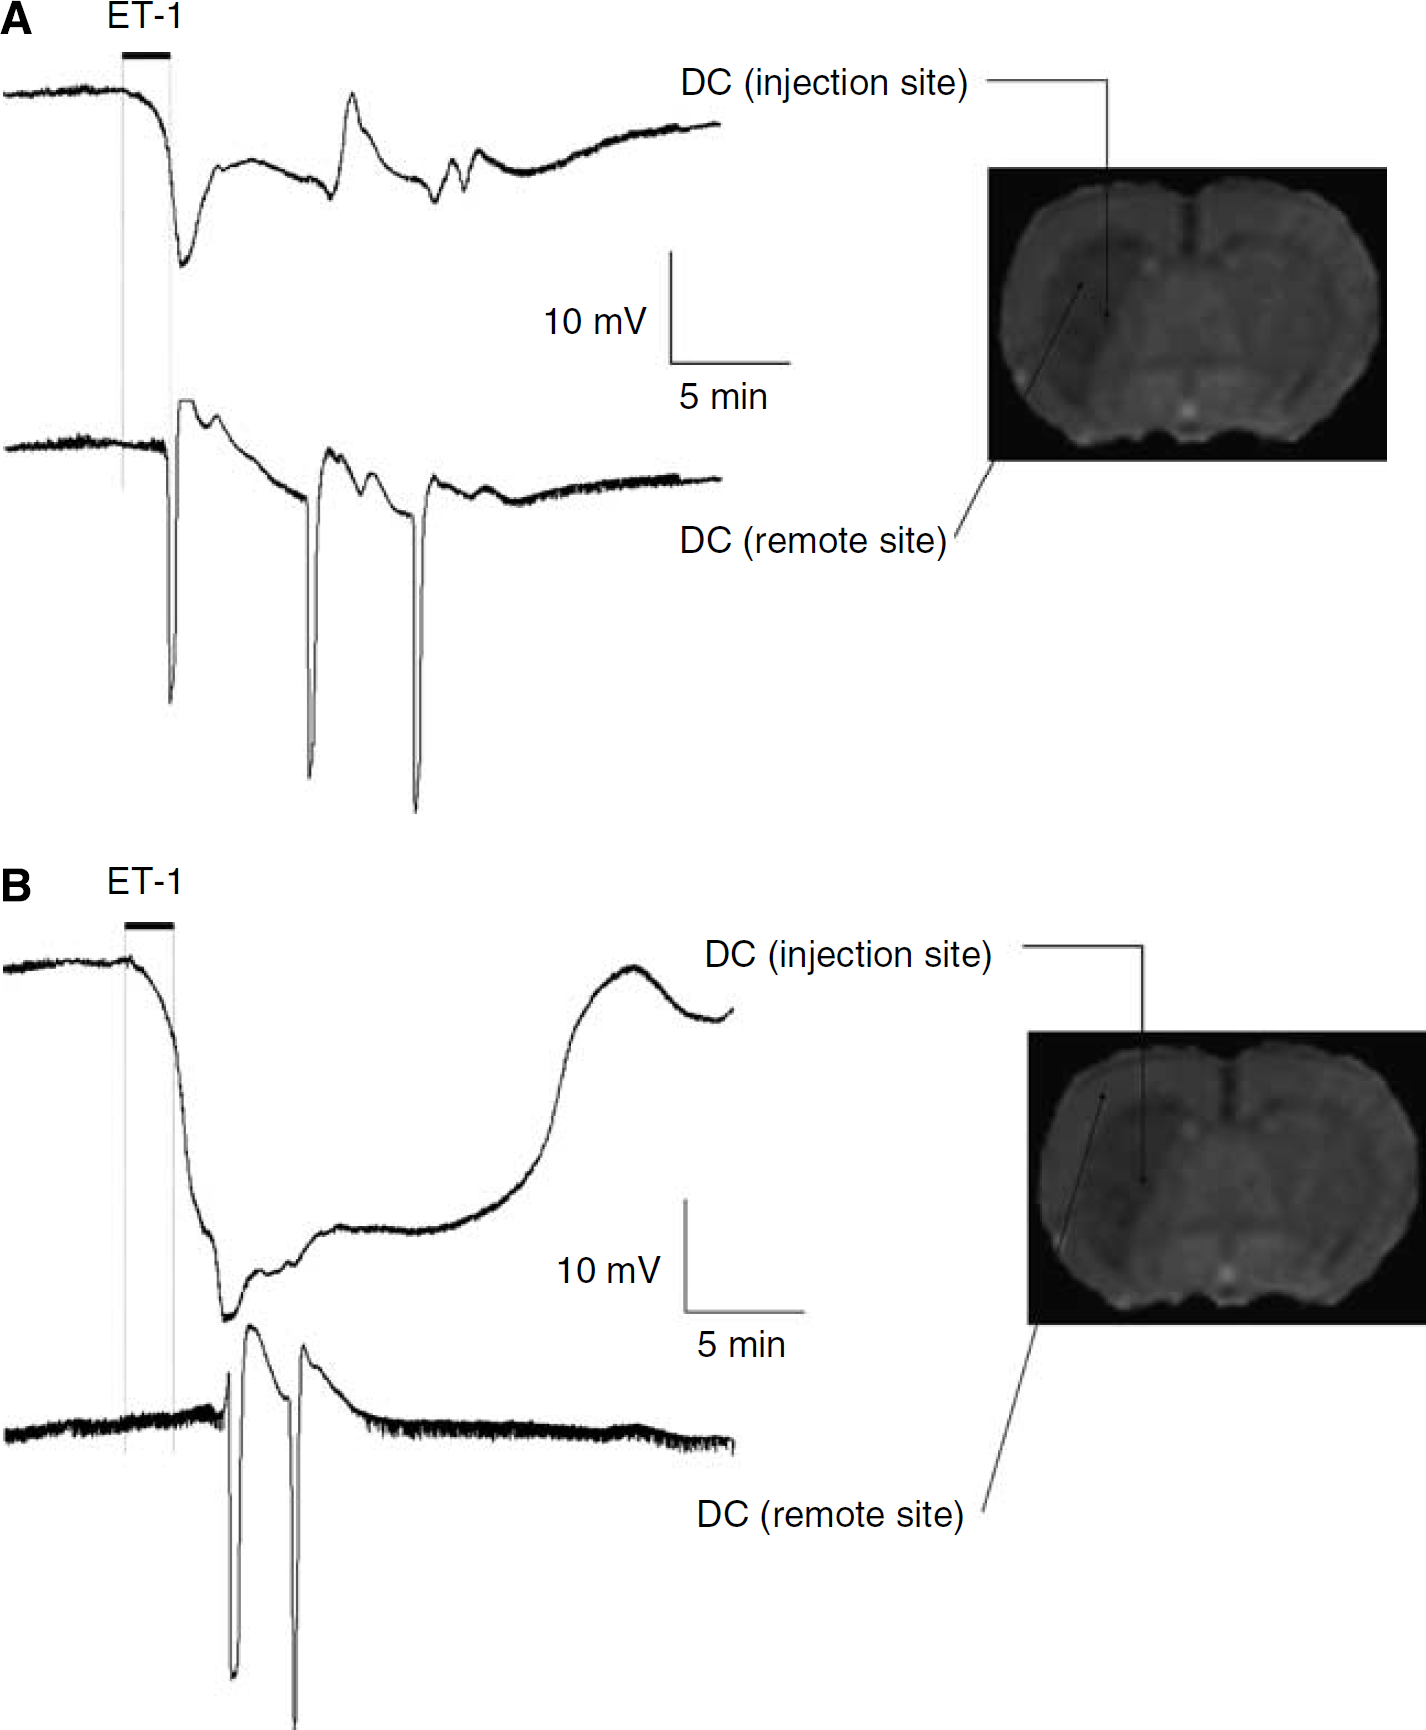
Effect of ET-1 on neuronal activity: electrophysiologic data. Representative changes in the DC potential recorded after microinjection of ET-1 (25 pmol in 1 μL). The upper trace (DC potential at injection site) in both (
No significant changes in T2 were observed in animals injected with ET-1 (Figure 1B; Table 1), although the injection site was initially evident as a small focal area of T2 hyperintensity, as reported previously (Sibson et al, 2002). In contrast, a significant increase in the T2 of the injected striatum in animals injected with NMDA was evident throughout the time-course post-injection compared with both pre-injection values and the contralateral hemisphere (Figure 1B; Table 1). In animals injected with the ETB agonist, the T2 of the injected striatum was mildly increased, and this was significant relative to pre-injection values (Figure 1B).
In the ET-1-injected animals, a focal area of reduced tissue water diffusion was apparent at the site of the intrastriatal injection, which spatially remained constant over the 2 h experimental period. The ADC of the injected striatum, calculated from the EPI data sets, was significantly reduced at all time points post-injection compared with both pre-injection values (Figure 1C) and the non-injected striatum (Table 1). Similarly, in animals injected with NMDA, the ADC of the injected striatum was significantly reduced at all time points post-injection compared with both pre-injection values (Figure 1C) and the non-injected striatum (Table 1). In contrast, animals injected with the ETB agonist IRL-1620 exhibited a significant increase in the ADC of the injected striatum at all time points post-injection compared with both pre-injection values (Figure 1C) and the non-injected striatum (Table 1).
The MTR of the injected striatum in animals injected with ET-1 was not significantly altered throughout the time course, although a trend towards a reduction was apparent (Figure 1D; Table 1). In animals injected with NMDA, however, the MTR of the injected striatum was significantly decreased throughout the 2 h period after injection compared with both pre-injection values and the contralateral hemisphere (Figure 1D; Table 1). No changes in MTR were found in the animals injected with the ETB agonist (Figure 1D).
Thus, there appears to be no consistent correlation between the increases in tissue T1 and any of the other measured MR parameters T2, ADC, or MTR.
Effect of Endothelin-1 and N-Methyl-d-Aspartate on Cerebral Blood Volume and Blood—Brain Barrier Integrity
To determine whether the observed changes in T1 were dependent on changes in cerebral perfusion or BBB breakdown, a second study was performed to measure these parameters after ET-1, NMDA, or IRL-1620 injection. As predicted, after ET-1 injection, a marked reduction in CBV was observed in the injected striatum (Figure 3). The reduction in CBV was significant compared with control values at all time points (P < 0.05 at 20 mins and P < 0.001 thereafter; Figure 3B). The reduction (~25%) in left/right CBV ratio was maintained up to 2 h after ET-1 injection. In contrast, no reduction in CBV was observed in animals injected with the ETB agonist IRL-1620 (Figure 3B), showing the expected lack of activity of the compound at the ETA receptors located on vascular smooth muscle. Similarly, no immediate effect of NMDA on CBV was observed, although this subsequently decreased gradually to reach a significantly decreased level 60 mins after NMDA injection (P < 0.05 compared with control group and both 20 and 40 mins post-NMDA; Figure 2B).
No effects of ET-1 or IRL-1620 on BBB integrity were observed, as evidenced by a lack of signal enhancement on post-gd T1-weighted images throughout the time course in all animals. However, a small focal area of contrast enhancement was observed on post-gd images acquired from NMDA-injected animals. This was evident from 20 mins post-injection and spatially remained constant over the experimental period (data not shown).
Astrocyte Activation and Endothelin-1-Induced Changes in T1 and Cerebral Blood Volume
Immunohistochemically, the only morphologic change that could be detected within the first 2 h after ET-1 injection into the brain parenchyma was activation of astrocytes (Figure 2). Consequently, to determine the potential contribution of astrocyte activation to the observed increase in T1 relaxation rate, we studied a further group of animals that received an intraperitoneal injection of arundic acid, which has been shown to selectively inhibit astrocyte activation (Tateishi et al, 2002), before intracerebral ET-1 injection. Subsequently, we followed the effect of arundic acid pretreatment on the area of T1 hypointensity (increased T1) on T1-weighted images. These images were higher resolution than that attainable with the EPI approach used for the multiparametric time-course studies, and hence enabled more accurate spatial quantitation of the region of T1 signal change. This group of animals were compared with the initial group (CBV/BBB study (ii)) that had undergone an intracerebral injection of ET-1. A marked and significant reduction in the extent of the T1 hypointensity induced by ET-1 injection was clearly evident after pretreatment with arundic acid (Figure 2). This finding indicates that astrocyte activation contributes significantly to the increase in T1 relaxation observed after intrastriatal ET-1 injection. It should be noted that in animals pretreated with arundic acid the reduction in CBV after ET-1 injection was still evident, such that no significant differences were found between the ET-1-injected animals with and without pretreatment (Figure 3B). Consequently, the changes in CBV and T1 were dissociated after pretreatment with arundic acid.
Effect of Endothelin-1 on Electrophysiology
In all animals treated with a striatal microinjection of ET-1, anoxic depolarisation occurred rapidly at the injection site (onset delay = 26±26 secs, mean±s.d., n = 6) (Figure 4). In 3 of 5 animals that underwent secondary striatal recordings within the region of increased T1, either single or multiple waves of SD were recorded at the remote, dorsolateral striatum electrode site (onset delay=144±36 secs, mean±s.d., n = 3; Figure 4A). Among the remaining 2 of 5 animals, in which anoxic depolarisation occurred later (onset 75 to 150 secs) and was followed by an apparent recovery of the DC potential, one of these animals also exhibited a delayed SD wave at the remote striatal site. However, in experiments where cortical recordings were made, waves of SD were also observed at the cortical electrode site where no change in T1 is observed (Figure 4B).
Effect of KCl-Induced Spreading Depression on T1
It has previously been shown that cortical SD can induce changes in T1 (Stanisz et al, 2002); thus to determine whether the striatal SD induced by ET-1 could account for the observed changes in T1, we investigated the effect of KCl-induced SD in the striatum. Electrophysiologic experiments showed that the intrastriatal injection of KCl induced a single wave of SD at the striatal injection site, of which around 50 to 60% propagated to the ipsilateral cortex. However, no effects of KCl injection on T1 signal intensity were detected over the first hour after intracerebral injection (data not shown).
Discussion
In this study, we have shown that an acute and sustained increase in the T1 relaxation of tissue water can be detected in both ischaemic (ET-1-induced) and excitotoxic (NMDA-induced) lesions. In the case of the ET-1 lesion, the T1 changes were accompanied by a decrease in local tissue water diffusion, although this was spatially more restricted than the change in T1 and probably reflects a small focal core of irreversibly damaged tissue. Similarly, the T1 change after NMDA injection was accompanied by a decrease in diffusion, as reported previously in neonatal rats (Dijkhuizen et al, 1996; Verheul et al, 1994), but in this case the area of reduced diffusion was considerably more extensive than the area of T1 change. A concomitant reduction in MTR and increase in T2 was also observed after NMDA injection, which has not been reported previously. Interestingly, activation of the ETB receptors alone with the ETB agonist IRL-1620, induced a small, but nonsignificant, increase in T1 relaxation and, in direct contrast to both ET-1 and NMDA, caused a significant increase in tissue water diffusion.
Taken together, our MRI findings suggest that there is dissociation between the observed T1 changes and the other MRI modalities, because they did not consistently correlate (spatially or temporally) with MTR, T2, ADC, or CBV changes. However, the increase in T1 may identify acute cellular changes that are common to both the ET-1 and NMDA lesions. It appears that processes downstream of the initial reduction in cerebral perfusion after ET-1 injection led to this phenomenon, because an early reduction in perfusion is not evident after NMDA injection. Similarly, it is unlikely that the increase in T1 is caused by the neurotoxic components of the NMDA lesion because these are absent in the first 24 h of the ET-1 lesion (Hughes et al, 2003). Histologically, the only common acute morphologic feature of the two lesions is astrocyte activation. Consequently, we investigated the possible contribution of this process to the increase in T1 observed after ET-1 injection. The results of this study suggest that acute astrocyte activation plays a major role in the increase in T1 relaxation of the brain detected by MRI.
T1 and Cerebral Perfusion
It is possible that under normal flow conditions inflowing non-inverted spins might cause an underestimate in the T1 of tissue water. Consequently, in the condition where CBF is substantially reduced (as after ET-1 injection), an increase in T1 may be observed as a result of reduced in-flow effects. However, theoretical calculations indicate that, at most, the contribution of such processes will be of the order of 1 to 2%, which is considerably smaller than the 12 to 15% increases in T1 measured in the ET-1-injected animals. Moreover, our experimental observations do not support a major contribution from altered in-flow effects. Specifically, the reduction in CBV following intrastriatal ET-1 injection, which is in agreement with previous studies (Fuxe et al, 1992; Hughes et al, 2003; Ueki et al, 1993), was also evident in animals pretreated with arundic acid despite a substantial reduction in the extent of the T1 hypointense area in these animals. Conversely in NMDA-injected animals, an acute increase in T1 was observed in the absence of any changes in CBV. Previous studies have reported increases in CBF after intrastriatal injection of NMDA but at substantially higher doses (150 to 300 nmol) than used here (Globus et al, 1995), or during prolonged microdialysis NMDA perfusion (Bhardwaj et al, 2000). However, with the bolus injection paradigm and dose (56 nmol) used in this study, no immediate effect of NMDA injection on CBV was evident, and a gradual decrease (rather than increase) in CBV was observed from 40 to 60 mins post-injection. It is likely that this is a dose-related difference in NDMA effect, but it is also possible that an acute increase in CBV occurred before the first acquisition time point of 20 to 25 mins post-NMDA injection. In the study of Bhardwaj et al (2000), the increase in CBF was observed 4 to 12 mins after onset of NMDA perfusion and had returned to near-normal levels by 40 to 60 mins despite continuing NMDA administration. Moreover, with the relatively low dose of NMDA used in the current study, any change in CBV is likely to be spatially very restricted, based on the findings of Globus et al (1995) who demonstrated a relationship between the spatial extent of increased CBF and the dose of NMDA. Such a focal change in CBV may not be detectable with the spatial resolution and analysis methods employed here. Nevertheless, taken together these findings suggest that the observed changes in tissue T1 are independent of changes in CBV and/or an ischaemic event.
T1 and Astrocyte Activation
Immunohistochemically, within the first 2 h after ET-1 injection there are few discernible changes – the BBB remains intact, there is no inflammatory cell recruitment, and no neuronal death. Endothelin-1 is thought to contribute to astrocyte activation and astrogliosis (Hama et al, 1997; Rogers et al, 2003; Wilhelmsson et al, 2004), although no previous studies have reported the acute (< 6 h) effects of ET-1 on astrocyte activation. Here, we show that reactive astrocytes can be detected immunohistochemically within 2 h of an intrastriatal ET-1 injection. This observation likely reflects very acute astrocyte activation because the appearance of glial fibrillary acidic protein is subject to a delay after the onset of activation while astrocyte processes retract and gene expression is altered sufficiently to be detectable by immunohistochemistry. Astrocytes are activated by neuronal degeneration, and early astrocyte activation has also been reported after intrastriatal NMDA injection (Bolton and Perry, 1998). Thus, we hypothesised that astrocyte activation may underlie the acute increase in T1 relaxation observed in both the ET-1 and NMDA lesions. Arundic acid ((R)-(–)-2-propyloctanoic acid) has recently been shown to selectively modulate astrocyte activation and to have a potent neuroprotective effect in vivo via astrocyte-dependent mechanisms (Asano et al, 2005; Himeda et al, 2006; Tateishi et al, 2002). In this study, we show that pretreatment with arundic acid significantly reduced the spatial extent of the T1 change induced by intrastriatal ET-1 injection. Taken together these findings suggest that the acute increase in T1 relaxation (T1-weighted hypointensity) reflects early activation of astrocytes. It has been shown that arundic acid does not eliminate astrocyte activation, but rather appears to prevent the development of strongly reactive astrocytes, thus maintaining the astrocytes at a neuroprotective rather than harmful level of activation (Mori et al, 2004). Therefore, we would not necessarily expect the astrocyte activation to be abrogated in the ET-1 lesion, nor the T1 signal change to be entirely abolished. Although not yet shown, it is possible that astrocyte activation occurs very early in a developing ischaemic lesion and, based on the current findings, that the rapid increases in T1 previously reported in models of cerebral ischaemia (Calamante et al, 1999; Ewing et al, 1999; Grohn et al, 2000; Kettunen et al, 2001; Lythgoe et al, 2000; Makela et al, 2002) could reflect an acute period of astrocyte activation and/or associated events.
In the ET-1-injected animals, the area of T1 increase tended to correspond spatially with the area of reduced CBV, which is likely to be an indication of the spread of ET-1 away from the injection site. Thus, the effects of ET-1 on astrocytes may be a combination of both indirect actions resulting from a reduction in CBV and direct actions on the astrocytes via ETB receptors (Rogers et al, 2003). The mild (~4%) increase in T1 relaxation observed after intrastriatal injection of the ETB agonist IRL-1620 would also support a relationship between increased T1 and astrocyte activation. Spatially, the area of increased tissue water diffusion in the IRL-1620-injected animals did not appear to be accounted for by the volume of fluid injected as determined from the T2 maps (Sibson et al, 2002). Moreover, the increase in ADC persisted to the end of the 2 h period, whereas the increase in T2 arising from the injection disappeared within 1.5 to 2 h. Consequently, the cause of the increased ADC remains unclear, but may also reflect astrocyte activation (being masked when additional processes that reduce ADC are in evidence). In the NMDA-injected animals, the area of T1 increase tended to be a small focal core region within the broader area of reduced water diffusion. This observation might be explained by more rapid and severe neuronal degeneration at the initial site of NMDA injection leading to greater astrocyte activation in this region. However, a core area of BBB breakdown and an increase in T2 was also observed in these animals. The areas of T1 and T2 increase were not spatially coincident, but in areas of overlap more than one process might contribute to the altered T1.
Mechanisms of T1 Change
It has been found that transient increases in T1 relaxation, together with reductions in MTR, occur during KCl-induced cortical SD (Stanisz et al, 2002). Endothelin-1 has been shown to be a potent inducer of cortical SD that is blocked by the NMDA-receptor antagonist MK-801 (Dreier et al, 2002), whereas striatal microinjection of NMDA induces SD within both the striatum (Obrenovitch et al, 1994) and cortex (Marrannes et al, 1988). Furthermore, mice with reduced inter-astrocyte communication, as is likely to accompany astrocyte activation (Brand-Schieber et al, 2005), exhibit more rapid spread of SD (Theis et al, 2003), suggesting that activation of astrocytes in disease may contribute to SD as a result of reduced intercellular communication. On the basis of these observations, we aimed to determine whether ET-1 can induce SD in the striatum, and whether changes associated with SD might underlie the observed T1 changes. Electrophysiologic studies demonstrated that intrastriatal injection of ET-1 rapidly induced anoxic depolarisation at the site of injection, and elicited single or multiple waves of SD in the dorsolateral region of the striatum corresponding to the outer edges of the MRI-detected T1 signal change. However, it was also found that a more delayed wave of SD was elicited in the overlying cortex, where no changes in T1 relaxation were observed. In addition, no further electrophysiologic changes were recorded, beyond these initial SD events, over the remainder of the time period studied (30 to 60 mins post-ET-1 injection). Thus, the ET-1-induced SD does not appear to correlate either spatially or temporally with the T1 changes observed after intracerebral ET-1 injection. Intrastriatal injection of KCl induced single episodes of SD within the striatum, with propagation of over half of these to the cortex, which is in accord with previous findings (Vinogradova et al, 1991). However, although similar patterns of striatal SD were elicited by KCl and ET-1, intrastriatal injection of KCl did not induce MRI-detectable changes in T1 over the time course studied. These findings suggest that SD or events related to this phenomenon are unlikely to be the cause of the observed increase in T1. However, this does not preclude an astrocytic origin, such as transient cell swelling, for the transient T1 events observed during SD (Stanisz et al, 2002), which would not have been detectable with our temporal resolution.
Correlation between increases in T1 during the first few hours of cerebral ischaemia and an increase in tissue water content has been reported, despite the absence of overt BBB breakdown, vasogenic oedema, and associated changes in T2 (Barbier et al, 2005; Ewing et al, 1999). This acute increase in tissue water has been suggested to result from either transient opening of the BBB or induction of an osmotic gradient between healthy and injured tissue (Barbier et al, 2005). If this is the case, it is perhaps surprising that corresponding increases in T2 are not observed. However, this might reflect the effect of cytotoxic oedema and the cellular localisation of the additional water content. In the study of Barbier et al (2005), a 16% increase in tissue T1 after 2 h focal ischaemia was reported to correlate with a 2% increase in tissue water content. In the current study, we measured 14 and 8% increases in T1 after ET-1 and NMDA injection, respectively, within 20 mins of intracerebral challenge. It is unclear, therefore, whether the increase in tissue water necessary to induce an increase in T1 would occur within this time frame, and no opening of the BBB was observed in either model. However, it is possible that astrocyte hypertrophy and increased metabolic/synthetic activity associated with astrocyte activation could give rise to an osmotic gradient between the compromised and surrounding tissues causing net water accumulation. Alternatively, acute increases in T1 after injury to the brain may reflect alterations in tissue structure, as a consequence of astrocyte activation.
In conclusion, we have found that a rapid increase in T1 relaxation in the brain occurs as a consequence of both low-flow ischaemia and excitotoxic challenge. This increase in T1 appears to reflect the activation of astrocytes and might explain similar early increases in T1 observed in other models of cerebral ischaemia. Although we found no evidence that SD was involved in the prolonged T1 changes observed here, astrocytes might play a key role in SD genesis. Consequently, the two phenomena of astrocyte activation and SD propagation could be related, and further studies in this area are warranted. Although an increase in T1 is not unique to acute astrocyte activation, other causes of prolonged T1 tend to be more chronic injury processes such as vasogenic oedema and axonal loss. Thus, early changes in T1, such as those observed before contrast enhancement in MS patients, may provide insight into acute and reversible injury processes associated with astrocyte activation.
Footnotes
Acknowledgements
The authors thank Dr Joe Mankowski for careful reading of this paper and helpful comments and Professor Bernard Silverman for advice on Statistics. This work was supported by the Medical Research Council under the MRC-funded co-operative entitled ‘The Host Response to Acute Brain Injury’.