
Abstract
Acute mountain sickness is common among not acclimatized persons ascending to high altitude; the underlying mechanism is unknown, but may be related to cerebral edema. Nine healthy male students were studied before and after 6-h exposure to isobaric hypoxia. Subjects inhaled room air enriched with N2 to obtain arterial O2 saturation values of 75 to 80%. Acute mountain sickness was assessed with the environmental symptom questionnaire, and cerebral edema with 3 T magnetic resonance imaging in 18 regions of interest in the cerebral white matter. The main outcome measures were development of intra- and extracellular cerebral white matter edema assessed by visual inspection and quantitative analysis of apparent diffusion coefficients derived from diffusion-weighted imaging, and B0 signal intensities derived from T2-weighted imaging. Seven of nine subjects developed acute mountain sickness. Mean apparent diffusion coefficient increased 2.12% (baseline, 0.80±0.09; 6 h hypoxia, 0.81 ± 0.09; P = 0.034), and mean B0 signal intensity increased 4.56% (baseline, 432.1 ±98.2; 6 h hypoxia, 450.7 ± 102.5; P < 0.001). Visual inspection of magnetic resonance images failed to reveal cerebral edema. Cerebral acute mountain sickness scores showed a negative correlation with relative changes of apparent diffusion coefficients (r = 0.83, P = 0.006); there was no correlation with relative changes of B0 signal intensities. In conclusion, isobaric hypoxia is associated with mild extracellular (vasogenic) cerebral edema irrespective of the presence of acute mountain sickness in most subjects, and severe acute mountain sickness with additional mild intracellular (cytotoxic) cerebral edema.
Introduction
Unacclimatized subjects, who rapidly ascent to high altitude, may develop acute mountain sickness (AMS), which is characterized by headache, anorexia, nausea, vomiting, insomnia, and dizziness (Basnyat and Murdoch, 2003; Hackett and Roach, 2001; Levine et al, 1989; Roach et al, 1993). The underlying mechanism for AMS is unclear. Intracellular (cytotoxic) cerebral edema, extracellular (vasogenic) cerebral edema, and increased cerebral blood volume have all been implicated, but without convincing scientific evidence (Basnyat and Murdoch, 2003; Hackett and Roach, 2001; Sutton and Lassen, 1979). Some magnetic resonance imaging (MRI) studies, using 1.5 T machines, found that exposure to moderate hypo- or isobaric hypoxia, corresponding to altitudes of 4,500 m, increased brain volume by 0.5 to 2.8% (Kallenberg et al, 2007; Morocz et al, 2001) and decreased cerebrospinal fluid (CSF) volume in the lateral and third ventricles by 10.3% (Fischer et al, 2004). Results with respect to the presence and type of cerebral edema were, however, conflicting (Fischer et al, 2004; Kallenberg et al, 2007; Matsuzawa et al, 1992; Morocz et al, 2001). This could have been related to the relatively low resolution of 1.5 T MRI and because the MR images were only visually evaluated and not analyzed with more sensitive quantitative methods.
In this study, we used 3 T MRI to investigate whether experimental hypoxia-induced AMS is associated with intra- and/or extracellular cerebral edema. We compared diffusion-weighted (DWI) and T2-weighted (T2WI) MR images obtained before and after 6-h exposure to isobaric hypoxia by visual inspection and quantitative analysis of apparent diffusion coefficients (ADCs) derived from DWI and B0 signal intensities derived from T2WI.
Materials and methods
Subjects
Nine healthy male volunteers (mean age: 26.4 ± 3.5 years) were recruited from students of the University of Zurich, Switzerland. Exclusion criteria were altitude exposure (> 1,500 m) in the previous 3 months, a history of smoking, substance and drug abuse, or of lung, cardiac, neurological, or psychiatric disease, and contraindication to undergo MRI (e.g., pacemaker).
The Local Medical Ethical Committee approved the study protocol, and written informed consent was obtained from all subjects.
Study Design
The study subjects were in supine position and were fitted a facial mask, which was connected with a tube of 3 m length. The total flow of fresh gas varied between 9 and 12 L/min, because 6 L of compressed air per minute was mixed with 3 to 6 L of N2 per minute. Thus, the stimulus was assumed to cause poikilocapnic hypoxia. Baseline examinations were done when the subjects were familiarized with the facial mask and the attached tube, and included assessment of the cerebral symptoms of AMS (AMS-C) by completion of the environmental symptom questionnaire (Sampson et al, 1983), monitoring of arterial O2 saturation (SaO2), the measurement of the blood pressure, and baseline MRI. The supine subjects were then shifted to a room adjacent to the MR suite, and the tube was connected to a gas container. Here, one investigator gradually increased the concentration of N2 in the inspired air, over a period of 20 mins, to obtain SaO2 values of 75 to 80%. This corresponds to an altitude of approximately 4,500 m. The SaO2 values were measured using a fingertip pulse oximeter (Datex-Ohmeda, Helsinki, Finland). End-tidal pCO2 was not determined for technical reasons. The SaO2 was kept stable during the following 6 h and the second MRI study by adjusting the mixture of inspired gas. After 6 h of hypoxia, the subjects were shifted to the MR suite in the supine position for the second MRI study. Symptoms of AMS and blood pressure were re-assessed every hour, and finally during the second MRI study.
Magnetic Resonance Imaging Studies
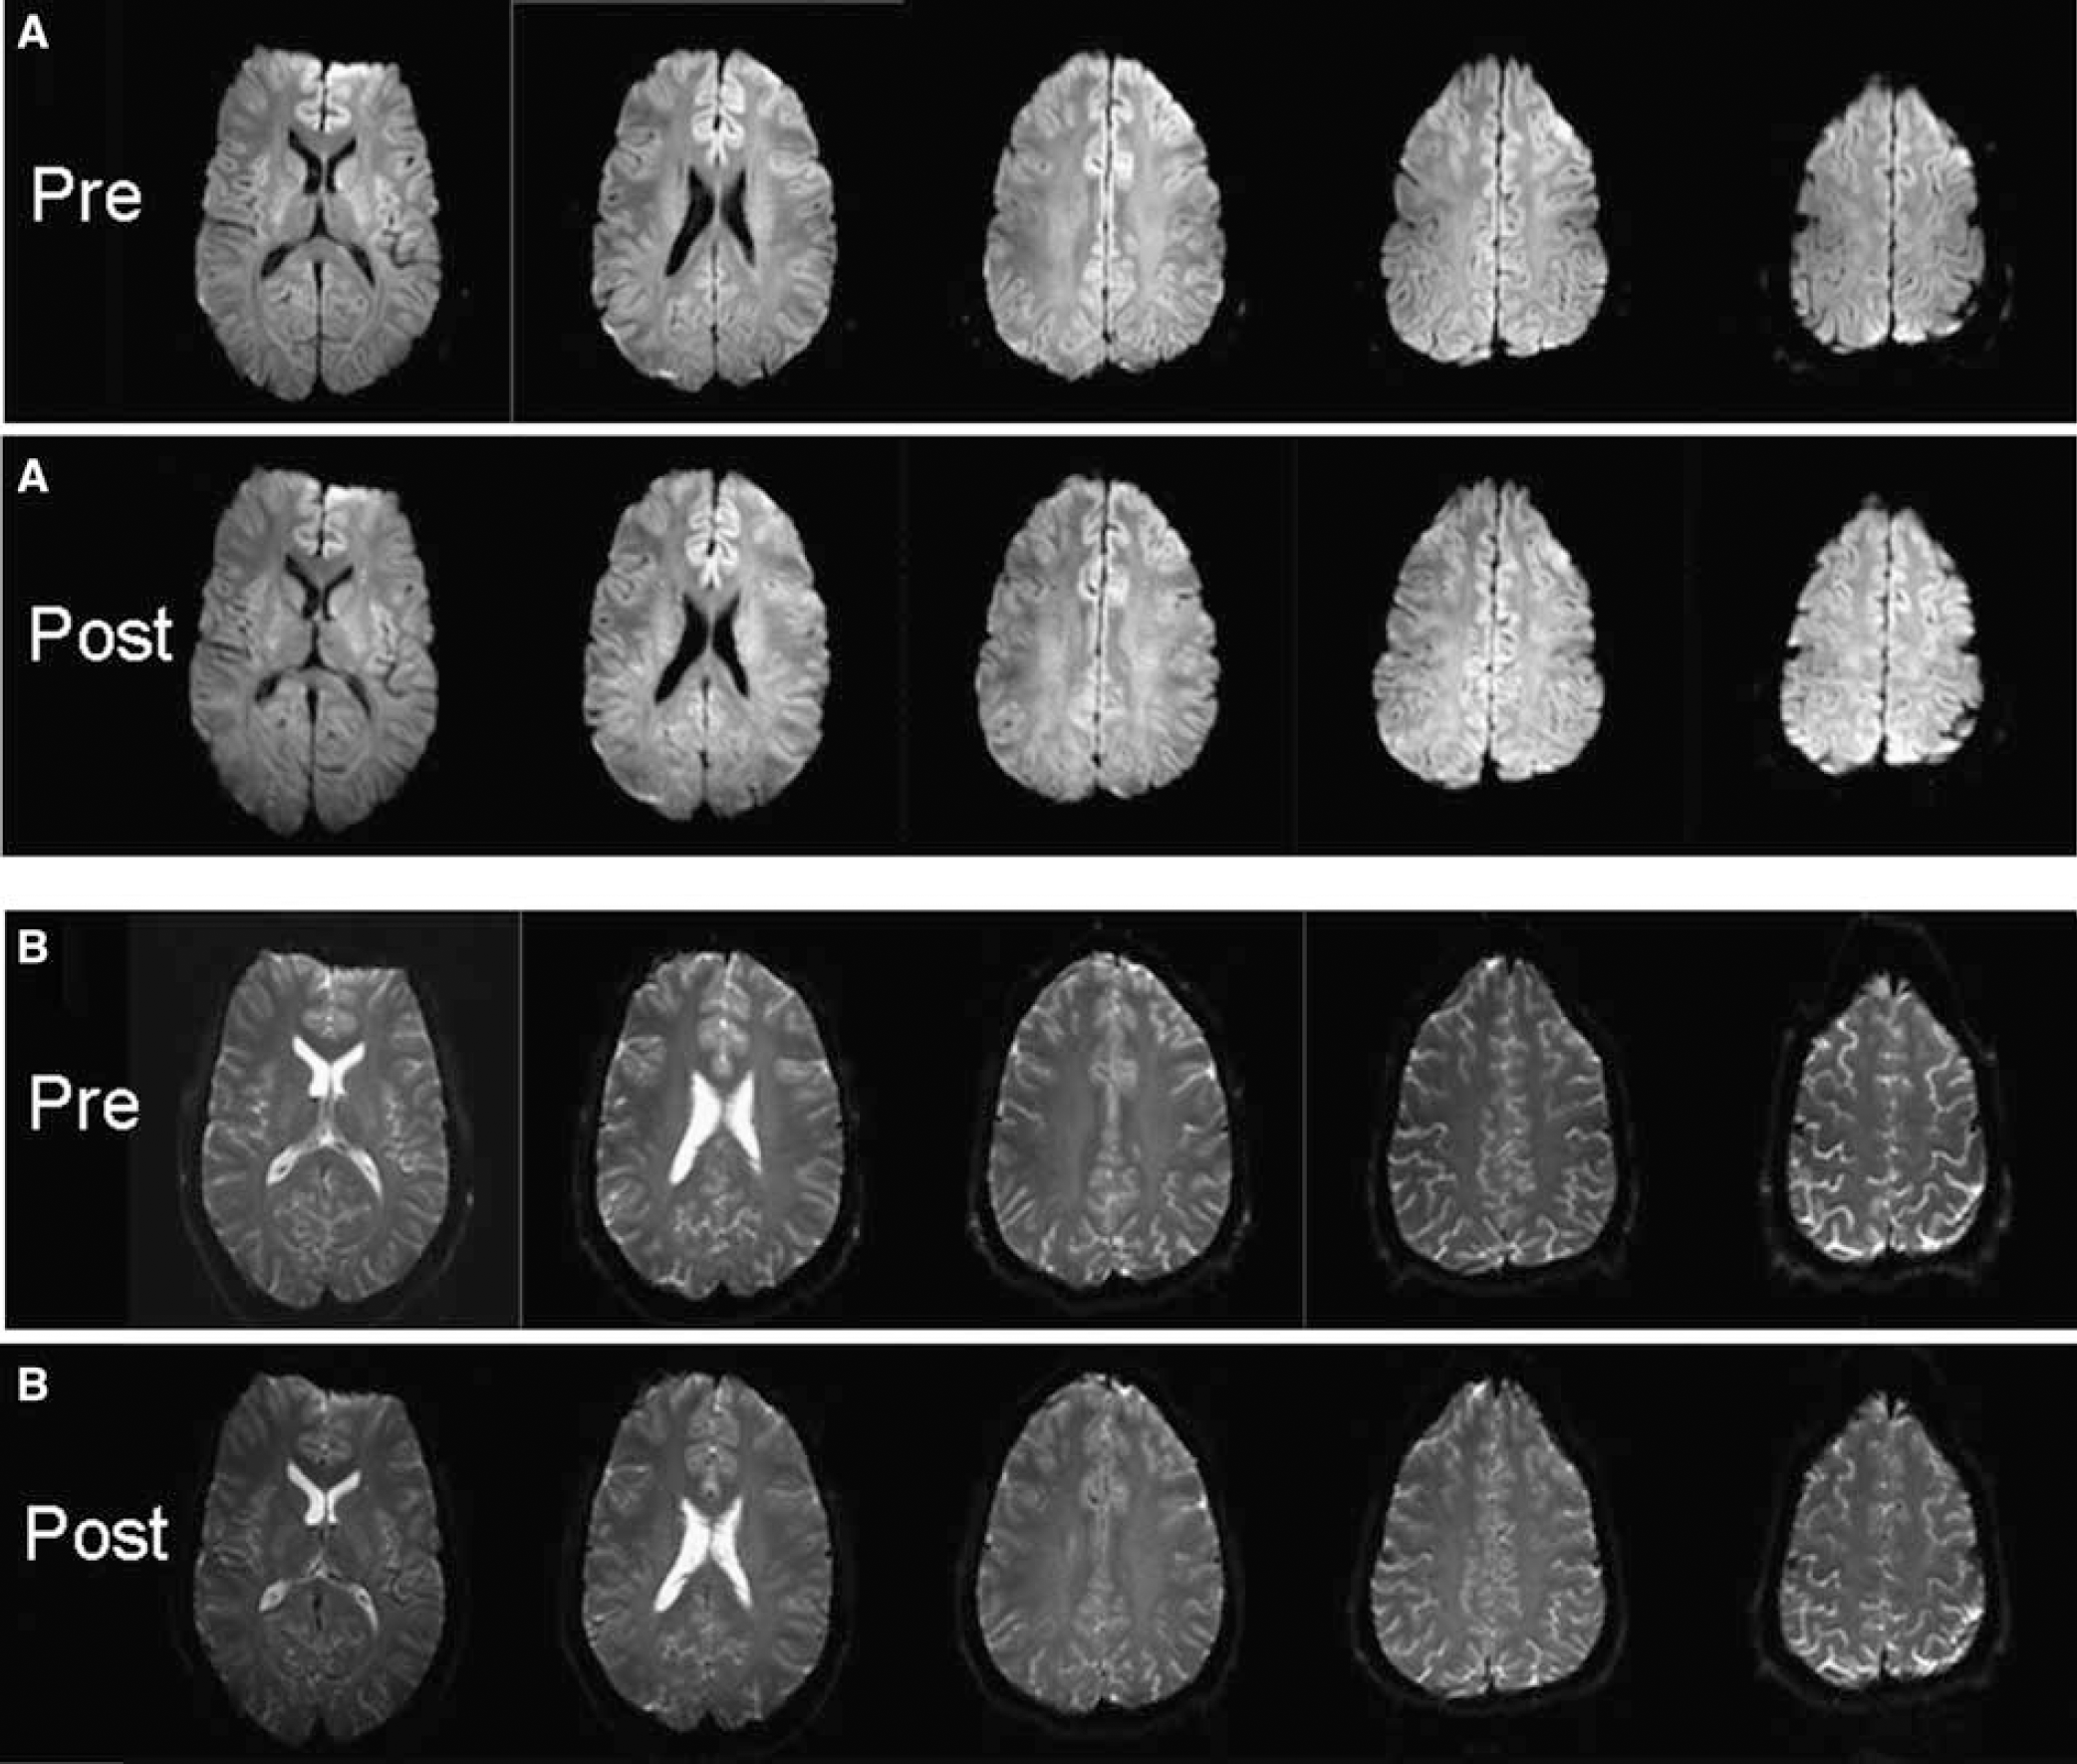
Magnetic resonance imaging studies were performed using a 3 T Philips Intera whole body system (Philips Medical Systems, Best, The Netherlands). Identical protocols and volume positioning were used at baseline and during hypoxia. The DWI data were based on a spin-echo single excitation echo-planar imaging protocol. Whole brain scans with an in-plane resolution of 1.6 × 1.6mm2 (14 contiguous slices, slice thickness =4 mm, matrix = 128 × 128, echo time = 79 ms, relaxation time = 3,987 ms) were performed along three orthogonal diffusion directions with a diffusion weighting of b = 1,000 secs/mm2, of b = 0 (Patel et al, 1995) and of B0 images (T2*-weighted images from the same sequence, with no applied diffusion gradient). An isotropic DWI image (Figure 3A) was calculated as the geometric mean of three orthogonal DWI images. Additionally, for each slice, a T2WI with minimal diffusion weighting (b < 20 secs/mm2) was acquired. The duration for the imaging procedure including the diffusion and the T2 protocol was 4 mins and 6 secs.
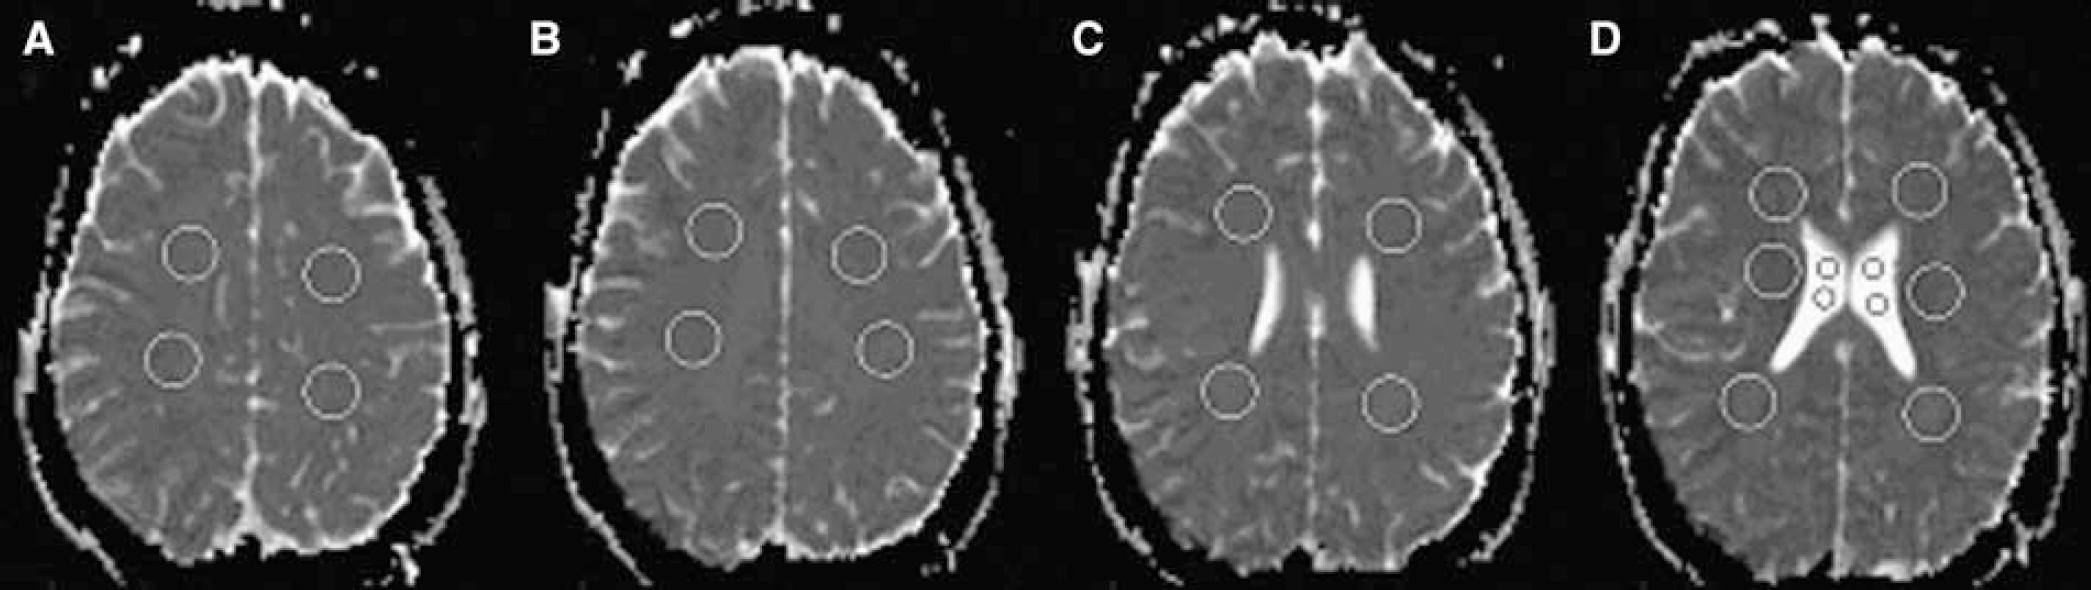
Axial T2-weighted MR images show the 22 regions of interest. Slice A is placed above slice B, and slices C and D are placed at the level of the cella media of the lateral ventricles.
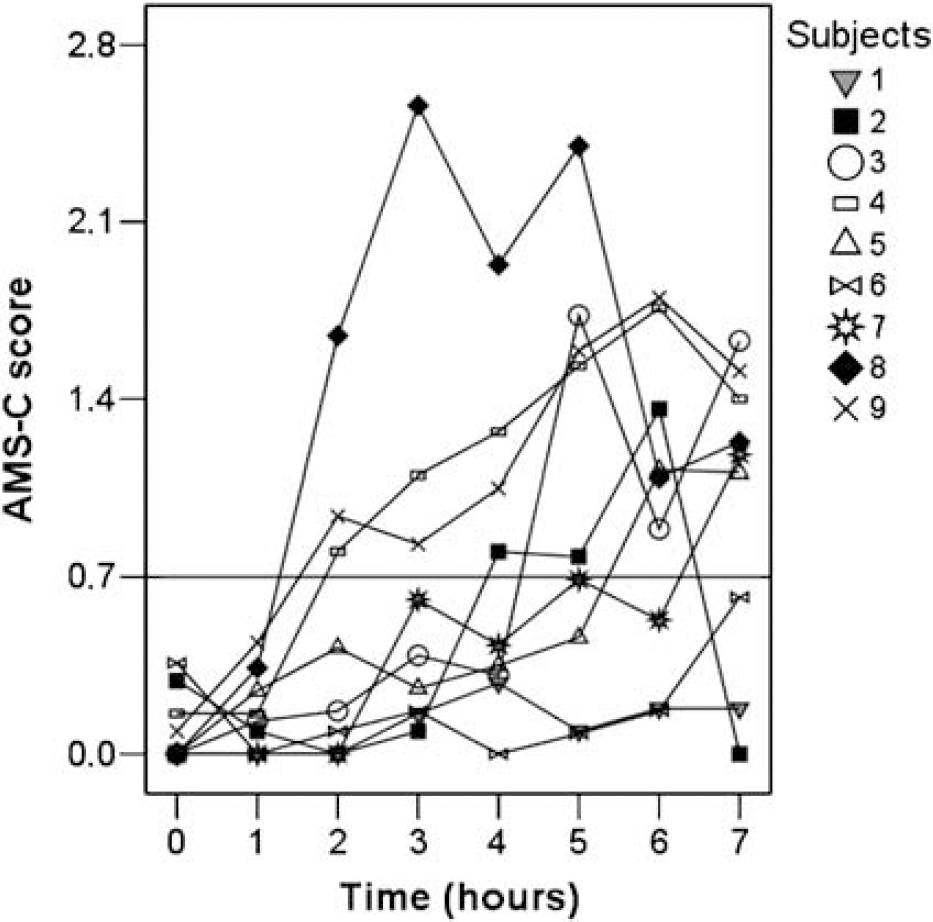
Cerebral acute mountain sickness (AMS-C) scores of all subjects at baseline and during hypoxia.
Axial (
The MRI data were stored and independently analyzed after completion of the study by investigators who were not aware of the cerebral AMS (AMS-C) scores. Two physicists (TJ and UD) and neurologists (PSS and RWB), masked to the AMS scores, looked for the presence of cerebral edema by comparing the second DWI and T2WI scans of each subject with the corresponding baseline scans (Figure 3). Another neurologist (ACN), also masked to the AMS scores, measured the ADC values and B0 signal intensities in 22 regions of interest (ROI) as the average value of all pixels in the respective ROI.
The ROIs were circular and located on four consecutive slices (Figure 1). Slices A and B were placed above, and the next two slices at the level of the cella media of the lateral ventricles. Eighteen of 22 ROIs were located in the cerebral white matter (nine in each hemisphere), and the other four in the CSF of both lateral ventricles. Cerebral white matter ROI were located in the anterior part in eight cases (beside the forceps minor; two measurements per slice), the middle part for two ROIs (beside the lateral ventricles; two measurements on the lowest slice), and the posterior part for eight ROIs (next to the forceps major, which corresponds to the lateral part of the corpus callosum fibers; two measurements per slice). Each white matter ROI consisted of 88 pixels, and each CSF ROI of 16 pixels. CSF ROIs contained fewer pixels than ROIs in the white matter, because not all ventricles were wide enough to accommodate larger circles. The use of smaller reference ROI in the CSF is appropriate, since the MRI signal is higher in the CSF than the white matter, and thus provides a better signal-to-noise ratio. Magnetic resonance imaging signal intensities are arbitrary units with different absolute values at baseline and 6-h sessions. Therefore, ROIs placed in the CSF were used to correct for intersession differences, because the CSF signal levels are assumed to remain unchanged during hypoxia. All ADC values and B0 signal intensities measured after 6 h were thus corrected to achieve the same values in CSF as at baseline according to the proportion: ROI6-h corrected = ROI6-h × CSFbaseline/CSF6-h, where CSF is the mean value of all CSF ROIs.
Interpretation of Apparent Diffusion Coefficient and B0 Changes on Magnetic Resonance Imaging
Increase of both ADC and B0 values are indicative of extracellular (vasogenic) edema, whereas an increase of B0 values in combination with a decrease of ADC values is indicative for the development of intracellular (cytotoxic) edema (Brunberg et al, 1995; Kucharczyk et al, 1993; Mintorovitch et al, 1991, 1994; Tien et al, 1994).
Assessment of Acute Mountain Sickness
The environmental symptom questionnaire was translated to German and used as described previously (Bartsch et al, 1990). Subjects were considered to have AMS when the AMS-C score was ≥0.70 (Sampson et al, 1983). The AMS-C score ranges from 0 to 5 and it is based on 11 neurological symptoms.
Statistical Analysis
Statistical analysis was performed using SPSS 12.0 (SPSS, Chicago, IL, USA).
Mean ADC (primary outcome of the study) and B0 values obtained at baseline and after 6 h were compared using a general linear model for repeated measurements including ROI location as covariate (total white matter ROI, n = 162; anterior white matter ROI, n = 72; middle white matter ROI, n = 18; posterior white matter ROI, n = 72). Associations between AMS-C scores and relative changes of ADCs and B0 signal intensities were assessed using the non-parametric Spearman correlation coefficients. P <0.05 was considered significant.
Results
All nine subjects completed the study. The data set was complete and was evaluated for all nine subjects. Seven out of nine subjects (subjects 2 to 6, 8, and 9) developed AMS during hypoxia. Six of the nine subjects had AMS during the second MRI scan (Figure 2). Baseline blood pressure did not differ between subjects with and without AMS. The mean AMS score of all subjects was higher at the time of MRI scanning than at baseline (Table 1).
Apparent diffusion coefficient values at 3T MR imaging in the cerebral white matter and cerebrospinal fluid, and cerebral acute mountain sickness scores in nine healthy subjects at baseline and 6-h exposure to isobaric hypoxia a
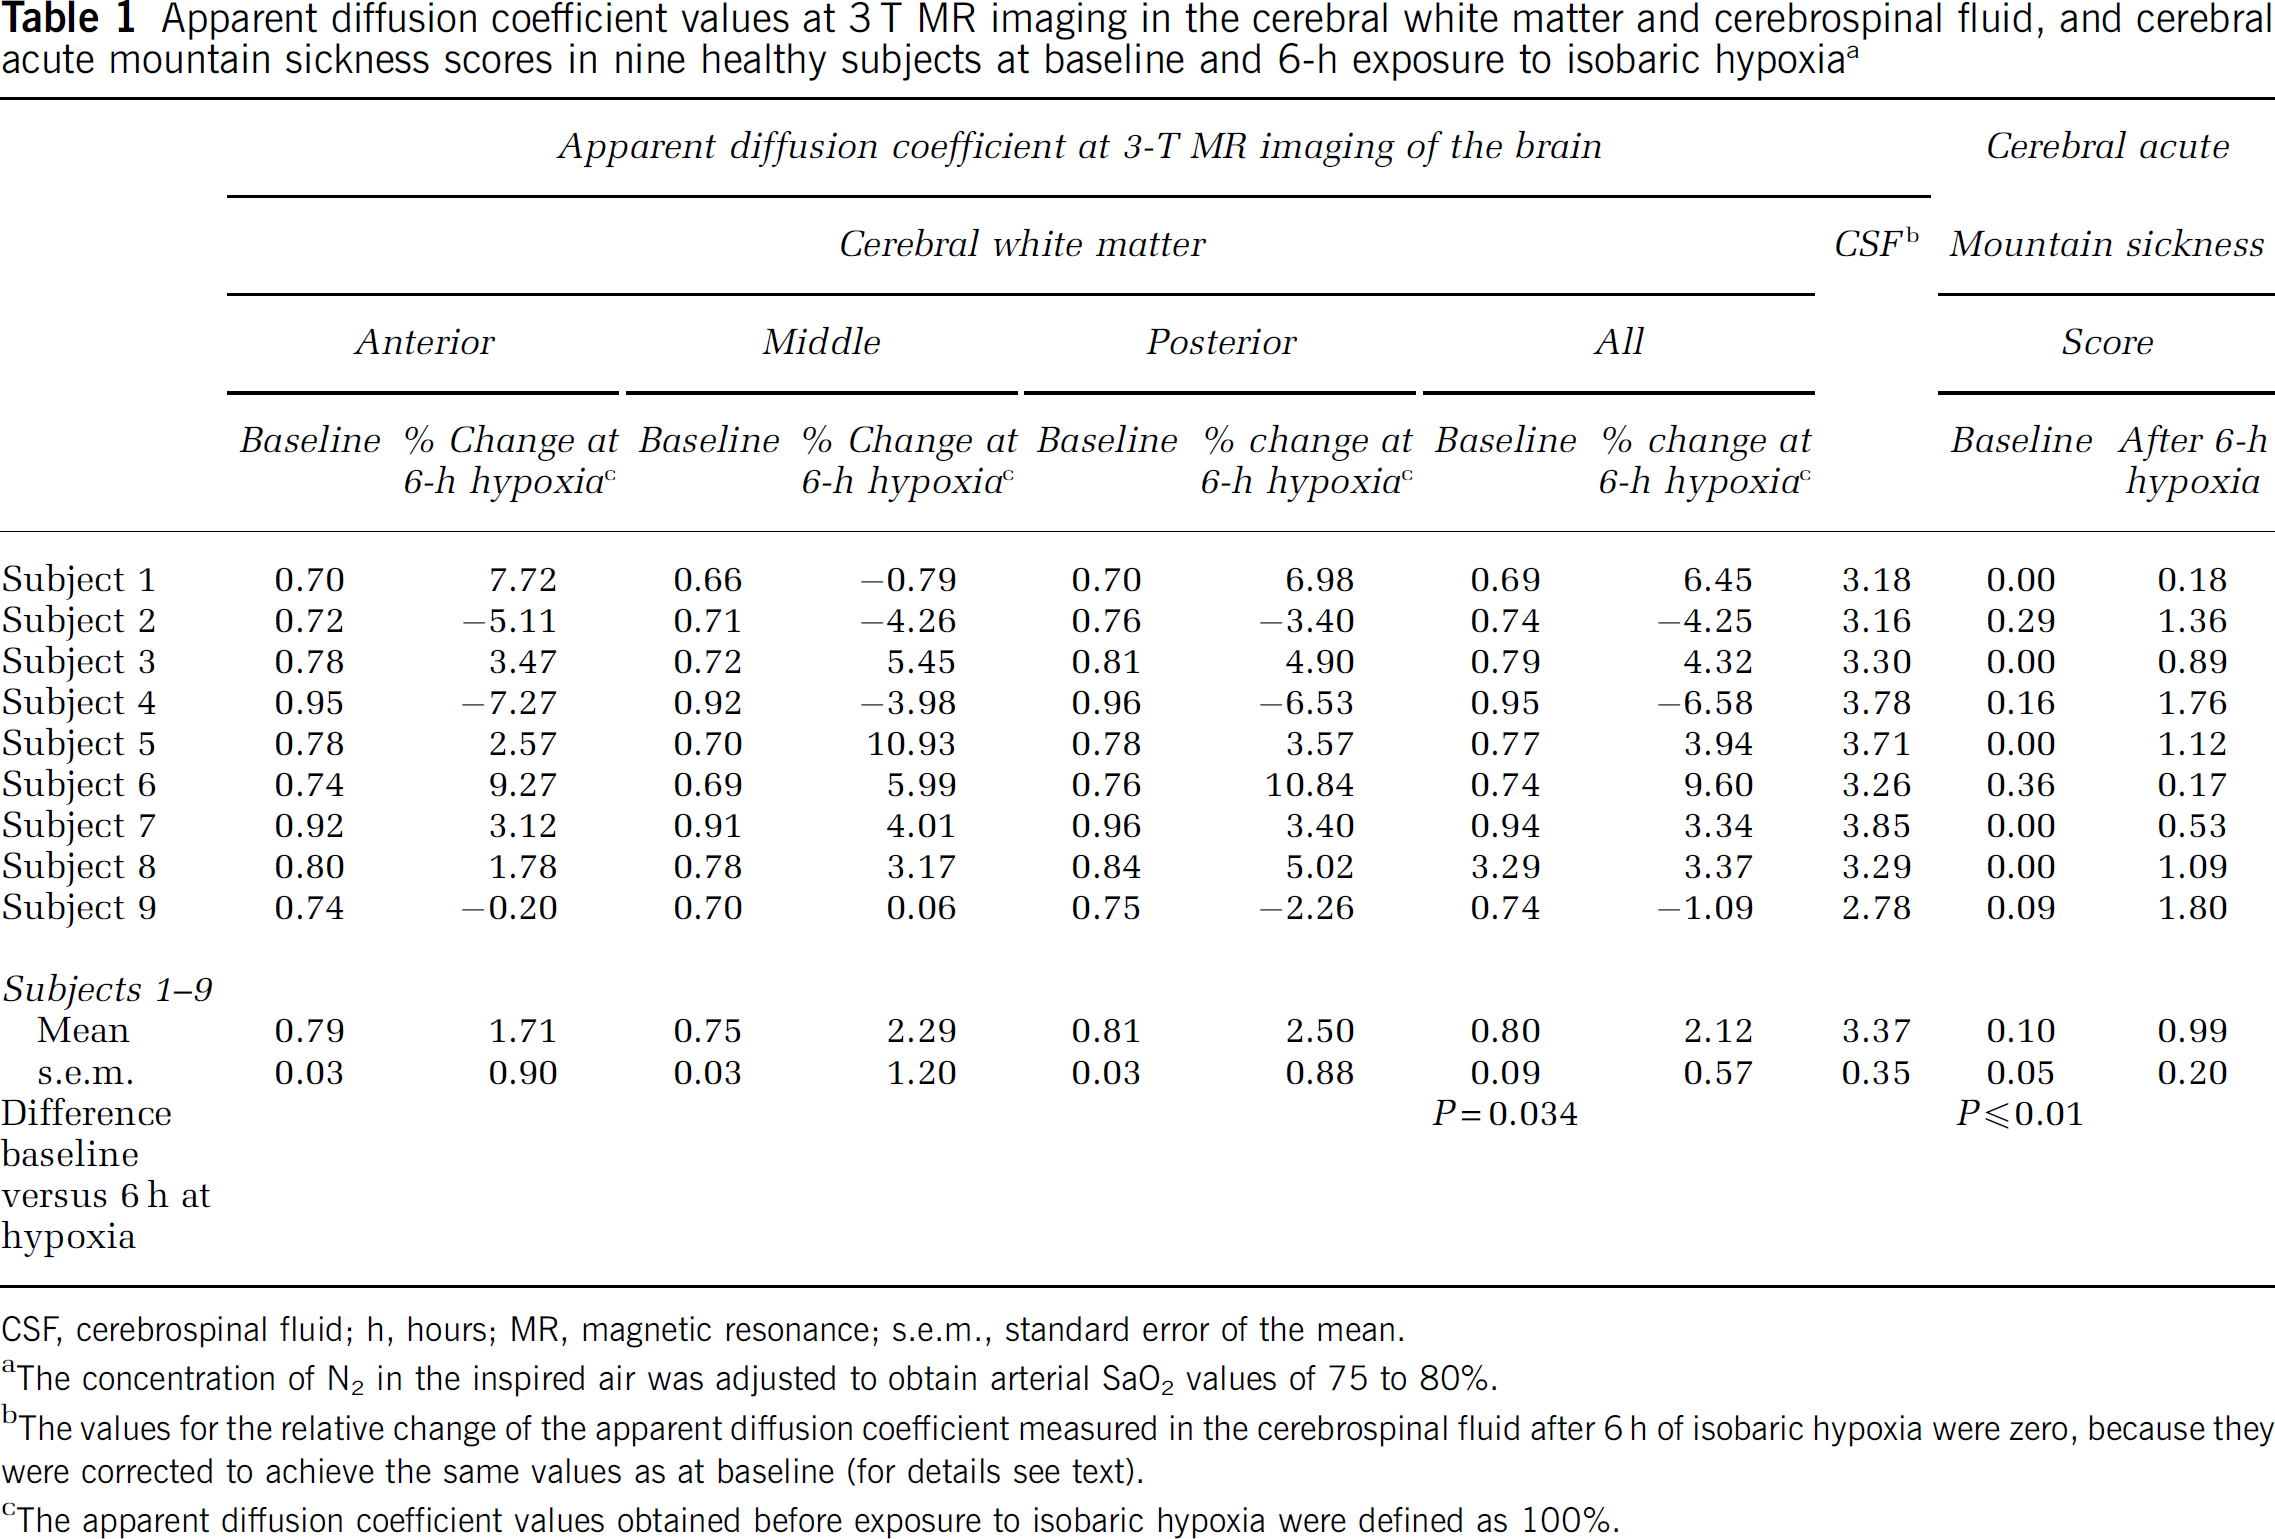
CSF, cerebrospinal fluid; h, hours; MR, magnetic resonance; s.e.m., standard error of the mean.
The concentration of N2 in the inspired air was adjusted to obtain arterial SaO2 values of 75 to 80%.
The values for the relative change of the apparent diffusion coefficient measured in the cerebrospinal fluid after 6 h of isobaric hypoxia were zero, because they were corrected to achieve the same values as at baseline (for details see text).
The apparent diffusion coefficient values obtained before exposure to isobaric hypoxia were defined as 100%.
Systolic (baseline, 113 ± 9 mm Hg; during second MRI study, 115 ± 11 mm Hg; P =0.49) and diastolic (baseline, 72 ± 6 mm Hg; during second MRI study, 74 ± 4mm Hg; P = 0.71) blood pressure did not change during the study (values are mean ± standard deviation).
Magnetic Resonance Imaging Study
Visual inspection showed no evidence for cerebral edema (Figure 3).
Mean ADCs were increased by 2.12% (P = 0.034, Table 1), and mean B0 values were increased by 4.56% (P <0.01, Table 2) after 6-h exposure to hypoxia. The ADCs increased in six subjects (Figure 4), and B0 values in eight subjects (Figure 5). ADCs (P = 0.32) and B0 values (P = 0.06) did not differ between the three white matter ROIs.
B0 values at 3 T MR imaging in the cerebral white matter and cerebrospinal fluid, and cerebral acute mountain sickness scores in nine healthy subjects at baseline and 6-h exposure to isobaric hypoxia a
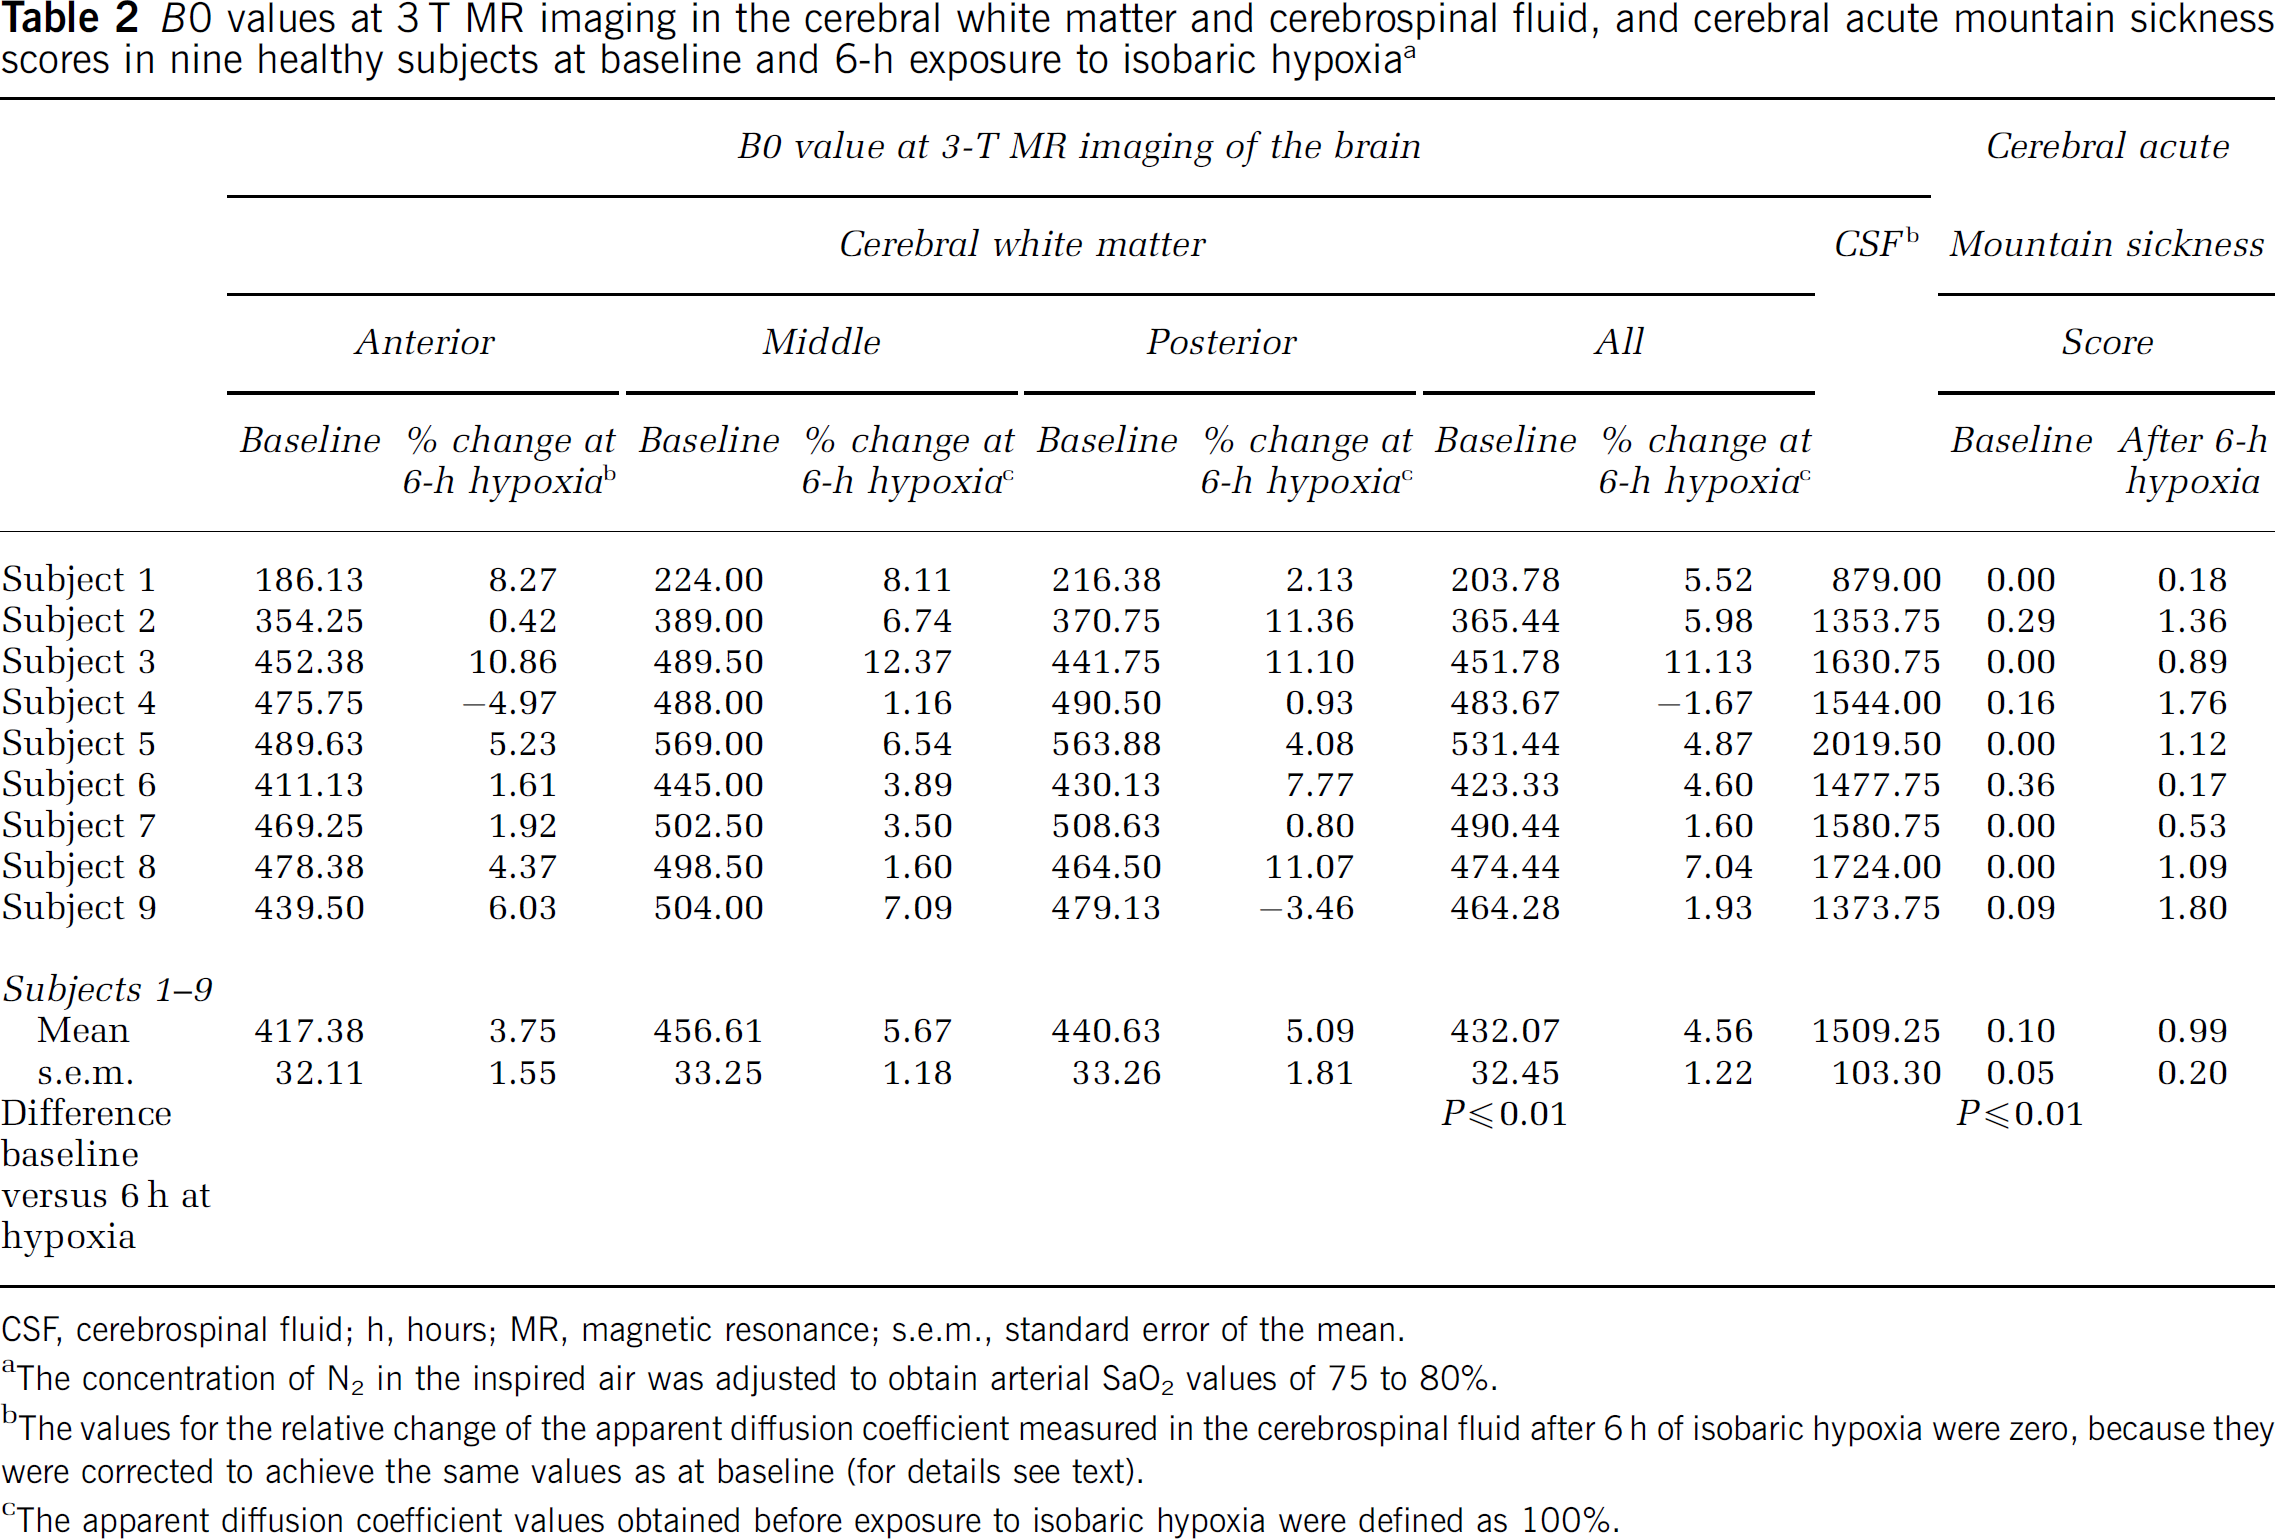
CSF, cerebrospinal fluid; h, hours; MR, magnetic resonance; s.e.m., standard error of the mean.
The concentration of N2 in the inspired air was adjusted to obtain arterial SaO2 values of 75 to 80%.
The values for the relative change of the apparent diffusion coefficient measured in the cerebrospinal fluid after 6 h of isobaric hypoxia were zero, because they were corrected to achieve the same values as at baseline (for details see text).
The apparent diffusion coefficient values obtained before exposure to isobaric hypoxia were defined as 100%.
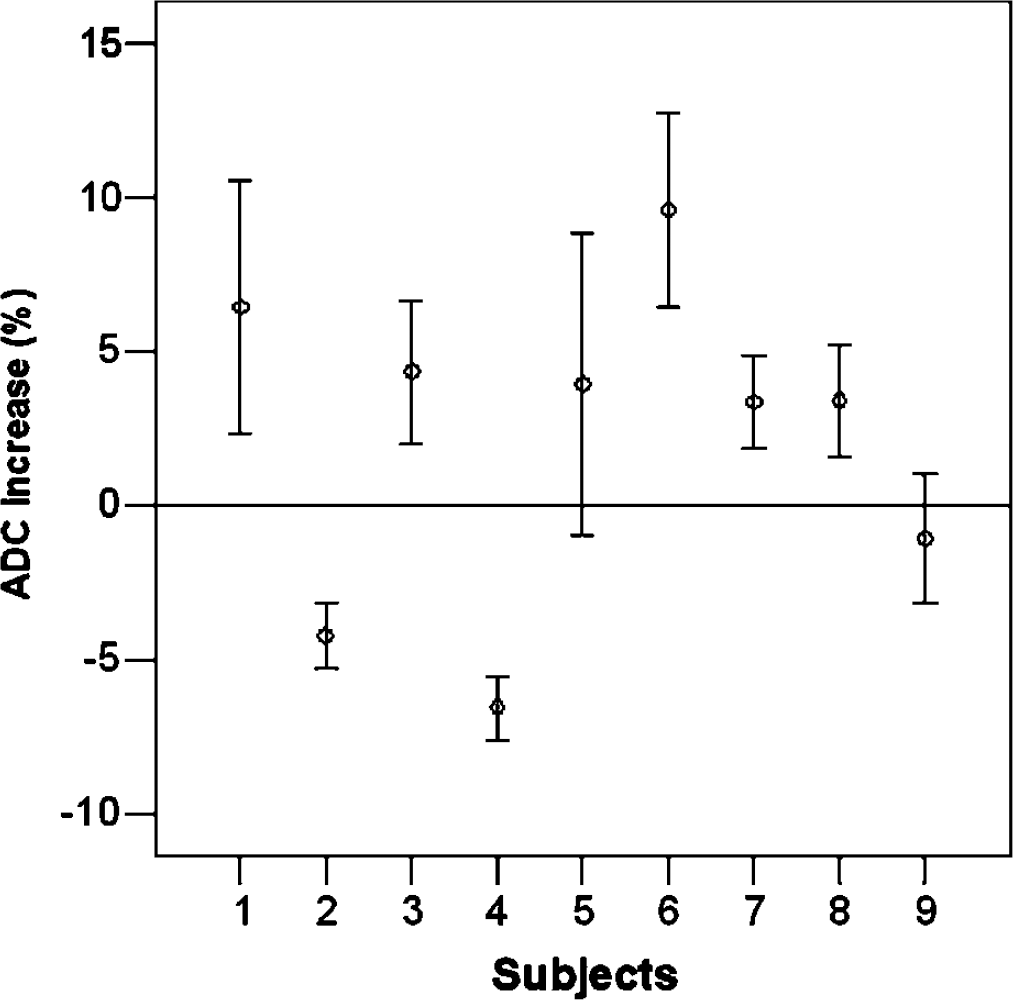
Relative changes of the apparent diffusion coefficient (ADC) after 6 h of hypoxia compared with baseline in all nine subjects.
As shown in Figure 6, the AMS-C scores measured after 6-h exposure to hypoxia showed a negative correlation with the relative change of ADC values (Spearman correlation coefficient −0.83, P = 0.006). There was no association between the AMS-C scores measured after 6-h exposure to hypoxia and the relative change of B0 values (Spearman correlation coefficient −0.22, P = 0.576; Figure 7).
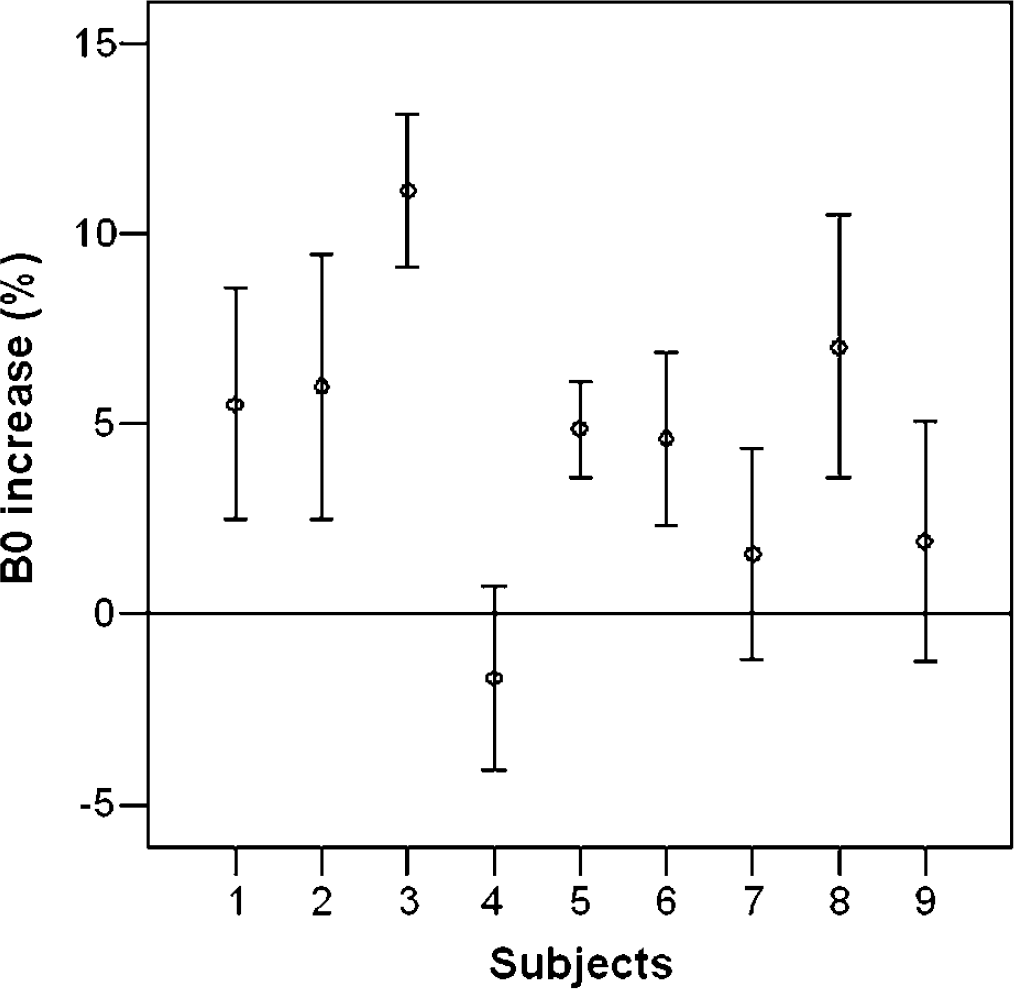
Relative changes of the B0 values after 6 h of hypoxia compared to baseline in all nine subjects.
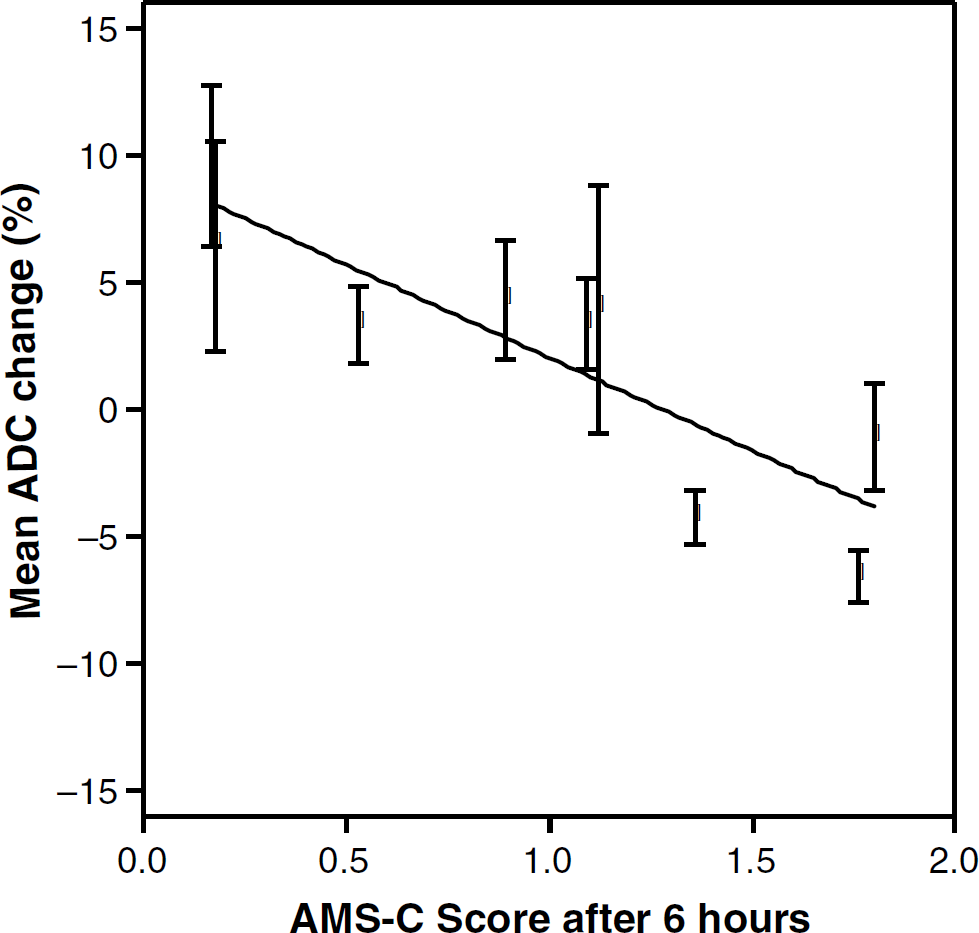
The mean value of two cerebral acute mountain sickness (AMS-C) scores measured immediately before and after MR imaging performed at hypoxia showed a weak but significant negative correlation with the relative change of the apparent diffusion coefficient (ADC).
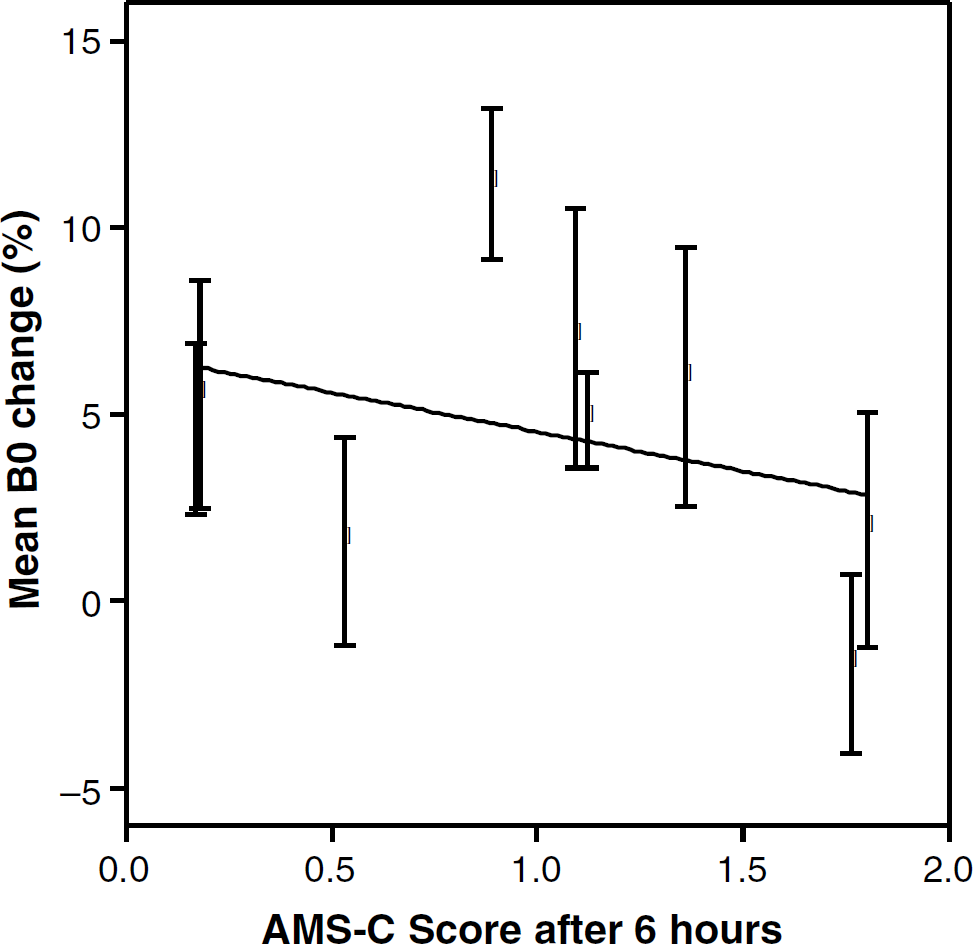
The mean value of two cerebral acute mountain sickness (AMS-C) scores measured immediately before and after MR imaging performed at hypoxia showed no correlation with the relative change of the B0 signal intensity values.
Discussion
In the present 3T MRI study, we found that experimental isobaric hypoxia for 6 h: (1) caused AMS in seven (77%) of nine healthy volunteers; (2) produced a mild extracellular (vasogenic) cerebral edema, irrespective of the presence of AMS, which was identified by a small increase of both ADCs and B0 values, whereas visual inspection of the MRI data failed to detect any differences; (3) that the AMS-C scores were negatively correlated with the ADC values. The prevalence of AMS in this series is in accordance with the results of two previous studies exposing 31 subjects to isobaric hypoxia corresponding to altitudes of 4,500 to 4,564 m during 9 to 16 h (Kallenberg et al, 2007; Roach et al, 1996). In the study of Roach et al (1996), six (67%) of nine subjects developed AMS, and in the study of Kallenberg et al (2007) 11 (50%) of 22 subjects were affected by this altitude illness.
The fact that the mild extracellular (vasogenic) cerebral edema was just detected by quantitative but not visual analysis of the MRI data is in accordance with the results obtained in three 1.5-T MRI investigations (Fischer et al, 2004; Kallenberg et al, 2007; Morocz et al, 2001). These studies found no cerebral edema at visual inspection of T2WI and DWI in 41 subjects with mild to moderate AMS who were exposed to hypobaric or isobaric hypoxia corresponding to altitudes of 4,500 to 4,572 m for 10 to 32 h (Fischer et al, 2004; Kallenberg et al, 2007; Morocz et al, 2001). Furthermore, one of these three studies found a mild extracellular cerebral edema with increased B0 values and a trend for decreased ADCs (Kallenberg et al, 2007). The higher resolution and signal-to-noise ratio of 3T MRI used in the present study makes it more sensitive for detecting cerebral abnormalities (Scarabino et al, 2003) than 1.5 T MRI employed in previous AMS investigations (Fischer et al, 2004; Kallenberg et al, 2007; Morocz et al, 2001). Despite this, visual inspection even of 3 T MRI brain images was still not sensitive enough to detect the cerebral edema associated with AMS. This is in sharp contrast to high-altitude cerebral edema. Here, visual inspection of proton density- and T2-weighted MRI brain images revealed extracellular edema of the white cerebral matter at a mean of 58 h (range: 16 to 132) after the onset of high-altitude cerebral edema symptoms (Hackett et al, 1998).
There was no association between AMS-C scores and BO signal intensities in this series, which confirms the results of a previous study (Kallenberg et al, 2007). In this respect it is important to note that, in reality, the degree of extracellular brain edema might have been higher. The B0 signal intensity increase due to cerebral edema may have been neutralized by the blood oxygenation level-dependent effect of hypoxia (Ogawa et al, 1990a, b ). This effect is related to the intravascular concentration of deoxyhemoglobin, which lowers signal intensity of B0 images by increasing magnetic susceptibility (Lin et al, 1998; Prielmeier et al, 1994; Rostrup et al, 2005; van Zijl et al, 1998). As hypoxia will increase the intravascular concentration of deoxyhemoglobin, it will also lower the intensity of the B0 signal and thus the level of perceived cerebral edema. Therefore, the blood oxygenation level-dependent effect might have prevented the detection of an association between the B0 values and the AMS-C scores. Consequently, it cannot be completely excluded that the mild extracellular cerebral edema is in part responsible for AMS, for example, by stimulating pain-sensitive fibers in the meninges, the meningeal and pial vessels (Sanchez and Moskowitz, 1999). A potential role of vasogenic cerebral edema is underscored by two observations: symptoms and signs of AMS as well as abnormal B0 values and ADCs occurring during exposure to isobaric hypoxia disappeared after the subjects were re-exposed to normoxia (Kallenberg et al, 2007) and corticosteroids, which reduce extracellular cerebral edema, are an established therapy of AMS (Ferrazzini et al, 1987).
The third and most important result of the present study is based on the observation that subjects with the most severe AMS symptoms showed the lowest ADC values. Being in accordance with the findings reported by Kallenberg et al (2007), this would suggest that severe AMS is associated with intracellular (cytotoxic) edema of the cerebral white matter, on top of hypoxia-driven extracellular (vasogenic) edema. The cytotoxic edema may have been caused by a decreased activity and/or expression of the Na+, K+ -ATPase in the cerebral white matter (Allen et al, 1992; De Angelis and Haupert, 1998; Nioka et al, 1990). A reduction of ATPase activity is associated with reduced levels of tissue ATP and a shift from aerobic to anaerobic glycolysis, and lactate is built up causing acidosis (Allen et al, 1992; Ben Yoseph et al, 1993; Nioka et al, 1990). Using declining intracellular pH as an indicator of increased intracellular lactate production, 31P MR spectroscopy (MRS) studies observed a intracellular pH decline at arterial PO2 (PaO2) values of 30 to 45 mm Hg (Allen et al, 1992; Nioka et al, 1990; Rolett et al, 2000). We observed PaO2 values of 40 to 45 mm Hg in subjects exposed to an altitude of 4,559 m (Bartsch et al, 1990; Baumgartner et al, 2002). Consequently, the subjects investigated in this series were exposed to levels of hypoxia, which might lead to PaO2 values causing anaerobic glycolysis and reducing the cerebral metabolic rate of oxygen, although no study has shown a decrease of cerebral metabolic rate of oxygen in humans exposed to high altitude (Moller et al, 2002; Severinghaus et al, 1966). However, the study of Severinghaus et al (1966) was performed at a lower altitude of 3,800 m, and the investigation of Moller et al (2002) in subjects who were chronically exposed to high altitude. More important is that a recent study comparing MRI with positron emission tomography findings in patients with acute ischemic stroke has shown that ADCs are not reliable predictors of reduced cerebral metabolic rate of oxygen at the levels of hypoxia applied in our subjects (Guadagno et al, 2006). These PET findings question the assumption that more severe forms of AMS are associated with intracellular (cytotoxic) edema. Further studies also assessing the cerebral metabolic rate of oxygen in the cerebral white matter are needed to answer this question.
The study is limited by the low number of included subjects. Furthermore, the present findings may not be applicable to hypobaric hypoxia, because the severity of AMS has been shown to be increased during simulated altitude compared with isobaric hypoxia (Roach et al, 1996).
We conclude that experimental isobaric hypoxia is associated with mild extracellular (vasogenic) cerebral edema irrespective of the presence of AMS in the majority of subjects, and severe AMS with additional mild intracellular (cytotoxic) cerebral edema.
Footnotes
Acknowledgements
GGS was responsible for conception and design of the study, collected and analyzed/interpreted data, and drafted the manuscript. GGS had full access to all of the data in the study and took responsibility for the integrity of the data and the accuracy of the data analysis. PSS, ACN, CK, and TL were responsible for the conception and design of the study, collected and analyzed/interpreted data, and critically edited the manuscript. TJ and UD were responsible for the conception and design of the study, collected and analyzed/interpreted data, supervision, and critically edited the manuscript. MDF, PB, and RWB were responsible for conception and design of the study, obtaining funding, supervision, interpreted data, and critically edited the manuscript.