
Abstract
The multiinjection approach was used to study in vivo interactions between α4β2* nicotinic acetylcholine receptors and 2-[18F]fluoro-A-85380 in baboons. The ligand kinetics was modeled by the usual nonlinear compartment model composed of three compartments (arterial plasma, free and specifically bound ligand in tissue). Arterial blood samples were collected to generate a metabolite-corrected plasma input function. The experimental protocol, which consisted of three injections of labeled or unlabeled ligand, was aiming at identifying all parameters in one experiment. Various parameters, including B'max (the binding sites density) and KdVR (the apparent in vivo affinity of 2-[18F]fluoro-A-85380) could then be estimated in thalamus and in several receptor-poor regions. B'max estimate was 3.0±0.3 pmol/mL in thalamus, and ranged from 0.25 to 1.58 pmol/ml_ in extrathalamic regions. Although KdVR could be precisely estimated, the association and dissociation rate constants kon/VR and koff could not be identified separately. A second protocol was then used to estimate koff more precisely in the thalamus. Having estimated all model parameters, we performed simulations of 2-[18F]fluoro-A-85380 kinetics to test equilibrium hypotheses underlying simplified approaches. These showed that a pseudo-equilibrium is quickly reached between the free and bound compartments, a favorable situation to apply Logan graphical analysis. In contrast, the pseudo-equilibrium between the plasma and free compartments is only reached after several hours. The ratio of radioligand concentration in these two compartments then overestimates the true equilibrium value, an unfavorable situation to estimate distribution volumes from late images after a bolus injection.
Keywords
Introduction
Nicotinic receptors, which form a family of ligandgated ion channels, mediate some of the effects of the neurotransmitter acetylcholine and are present either at the neuromuscular junction or in the nervous system. In the central nervous system, they are implicated in numerous functions related to memory, pain, or drug addiction (Gotti et al, 1997). The best-known receptor subtypes present in the central nervous system are the α4β2*, α3β4, ãL2β3, α7, and α6* subtypes, among which the α4β2* subtype is the most abundant. Brain nicotinic receptors may be involved in various diseases, including epilepsy, schizophrenia, and neurodegenerative diseases (Gotti and Clementi, 2004; Paterson and Nordberg, 2000). In particular, mutations affecting the α4 or β2 subunits have been described in Autosomal Dominant Nocturnal Frontal Lobe Epilepsy (Steinlein, 2002), and the α4β2* subtype receptor density declines in Alzheimer's disease (Sihver et al, 1999).
Recently, several 3-pyridylether analog ligands have been radiolabeled and characterized for positron emission tomography (PET) or single photon emission computed tomography imaging of nicotinic receptors of the β2* subtype: 2-[18F]fluoro-A-85380 (Koren et al, 1998; Dollé et al, 1999; Valette et al, 1999a), 6-[18F]fluoro-A-85380 (Koren et al, 1998; Horti et al, 2000), 5-[123I]iodo-A-85380 (Koren et al, 1998; Chefer et al, 1998), [18F]nifrolidine (Chattopadhyay et al, 2005), 5-[11C]methyl-A-85380 (Iida et al, 2004). The compounds of this family were the first to display high-specific binding in vivo and a low toxicity.
Among these compounds, 2-[18F]fluoro-A-85380 is the most studied PET radioligand. It has a high affinity for the α4β2* subtype, and its affinity for the α3β4 subtype is 2400 times lower (Pavlova et al, 2000). In vitro, 2-[18F]fluoro-A-85380 has fast binding kinetics and low nonspecific binding (Pavlova et al, 2000; Hassoun et al, 2004). In whole rat brain membrane preparations, a single binding site was evidenced in saturation experiments (Hassoun et al, 2004). Moreover, 2-[18F]fluoro-A-85380 low toxicity makes it suitable for human studies (Valette et al, 2002; Bottlaender et al, 2003; Vaupel et al, 2005).
A first in vivo estimate of the density of 2-[18F]fluoro-A-85380 binding sites has been performed in the thalamus of rhesus monkeys, using a multiexperiment approach (Chefer et al, 2000). Then, 2-[18F]fluoro-A-85380 distribution volumes have been quantified in rhesus monkeys (Chefer et al, 2003) and humans (Gallezot et al, 2005). No in vivo estimates of the density of nicotinic receptors in extrathalamic regions are available to date.
The purpose of this study was to characterize 2-[18F]fluoro-A-85380 kinetics in the baboon brain, using a compartmental model, and to quantify in vivo α4β2* nicotinic receptor density in several brain regions, including the cortex and basal ganglia. One of the main difficulties in quantifying nicotinic receptors in these regions is their very low density. We used the multiinjection approach (Delforge et al, 1990), consisting of multiple injections of labeled and/or unlabeled ligand within a single experiment, to collect enough information so that all the parameters of the model would be identified. This approach has already been successfully used to quantify low receptor concentrations with a high-affinity ligand, such as FLB 457 for extrastriatal D2 dopaminergic receptors (Delforge et al, 1999).
A first experimental protocol was designed and tested. The density of binding sites and the ligand affinity were assessed in several regions of interest (ROIs), including both receptor-rich and receptor-poor regions. However, this protocol appeared unable to provide reliable estimates of the in vivo association and dissociation rate constants. A second protocol was used to obtain more precise estimates of these rate constants. With these two complementary protocols, estimates of the in vivo association and dissociation rate constants could be obtained in the thalamus. This dissociation rate was compatible with the kinetics observed in the other ROIs. Knowing all the model parameters, equilibrium was then studied by simulations.
Materials and methods
The Ligand Receptor Model
The compartmental model used in this study (Figure 1) is based on the usual nonequilibrium nonlinear model (Syrota et al, 1984; Mintun et al, 1984; Huang et al, 1986; Delforge et al, 1990). It includes three compartments and five parameters. The multiinjection protocols used in this study include injections of unlabeled ligand, which affects the concentration of the free receptors sites, and thus the association rate of the labeled ligand, Therefore, it is necessary to simulate the kinetics of the unlabeled ligand (Morris et al, 1996). The latter are assumed to be driven by the same model as those of the labeled ligand. Thus, the two parts of the model shown in Figure 1, respectively associated with the labeled and unlabeled ligand kinetics, have the same structure and the same parameters.
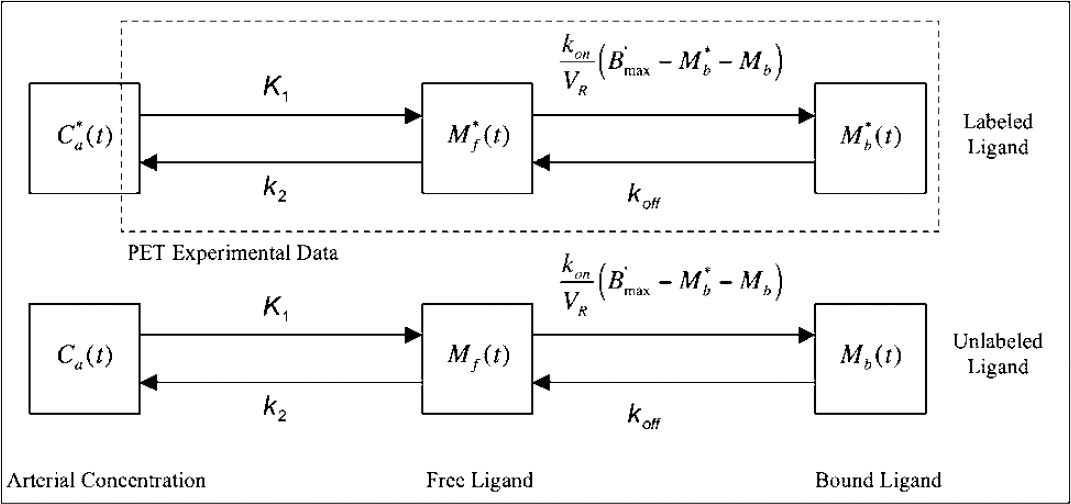
Compartmental ligand—receptor model. The upper part represents the model describing the kinetics of the labeled ligand and the lower part represents the same model used for the unlabeled ligand. All transfer rates of ligand between compartments are linear except the binding rate, which depends on the bimolecular association rate constant kon/VR and the local concentration of free binding sites B'max–M*b(t)–Mb(t). The transfer rates are identical for the labeled and unlabeled ligand because they are chemically identical. The PET experimental data correspond to the sum of the labeled ligand in the free and specifically bound ligand compartments plus a fraction Fv of the blood concentration. The unlabeled ligand compartments are not directly observable but the concentration of the specifically bound ligand Mb(t) has an impact on the local concentration of free receptors, and consequently on the binding rate of the labeled ligand.
The concentration of unmetabolized available 2-[18F]fluoro-A-85380 in plasma (denoted as C*a(t)) was measured. The plasma concentration of the unlabeled and unmetabolized ligand (denoted as Ca(t)) was estimated using the curve C*a(t) corresponding to the labeled ligand. Briefly, it is assumed that labeled and unlabeled ligands have the same kinetic properties, because they are chemically identical, and that the concentration in plasma is proportional to the injected dose. This latter assumption can be verified by comparing C*a(t) measured after successive injections, at different doses. For 2-[18F]fluoro-A-85380, this assumption is verified for doses up to 150 nmol, at least. Thus, when both labeled and unlabeled ligands are injected, Ca(t) is deduced from C*a(t), taking into account the respective doses, and the residual concentration(s) due to previous injection(s). When only unlabeled ligand is injected, Ca(t) is deduced from C*a(t) measured after the tracer injection. Detailed descriptions and discussions of this procedure have been published previously (Delforge et al, 1990; Morris et al, 1999, 2004; Muzic et al, 2000).
The flux of 2-[18F]fluoro-A-85380 from the arterial plasma compartment to the free compartment is given by K1C*a(t) (as pmol/minmL of tissue). The free ligand in the tissue can bind to an unoccupied specific binding site, or escape back to the blood circulation with a rate constant k2. The quantity of free-labeled ligand present in 1 mL of the tissue volume is denoted by M*f(t). However, because of the obvious heterogeneity of the tissue, this concentration can be heterogeneous in the PET volume. For example, the local concentration of the free ligand in the vicinity of the binding sites (which is the concentration to take into account in the ligand-receptor interactions) may be different from M*f(t). To take into account this heterogeneity, the concept of reaction volume, denoted by VR (as mL of tissue per mL of tissue), has been introduced (Delforge et al, 1996). By definition, the value of VR is such that M*f(t)/VR is equal to the local free ligand concentration in the vicinity of the binding sites.
The specific binding is a saturable reaction that depends on the bimolecular association rate constant kon, the free ligand concentration near the receptor sites M*f(t)/VR, and the quantity of free receptors in 1 mL of tissue. This latter quantity is equal to B'max—M*b(t)–Mb(t). B'max is the total binding site concentration available for binding. M*b(t) and Mb(t) are the quantity of receptors sites in 1 mL of tissue already occupied by the labeled and unlabeled ligand, respectively. The rate constant for the dissociation of the specifically bound ligand is denoted by koff. The in vivo equilibrium dissociation rate constant is denoted by KdVR, where Kd is the ratio koff/kon.
The quality of the fits obtained with this model was not improved by the addition of a nonspecific binding compartment. Therefore, no nonspecific binding compartment was included in the model. However, it is worth noticing that the free compartment may take into account a rapidly equilibrated nonspecific binding compartment (Koeppe et al, 1991).
The differential equations of the model were numerically integrated using an embedded Runge—Kutta—Fehlberg (4,5) algorithm, as implemented in the GNU Scientific Library (version 1.5) (www.gnu.org/software/gsl).
The simulated PET data (denoted as M*TEP(t)) corresponding to the PET scan performed between time ti and ts+1 is given by the following equation:
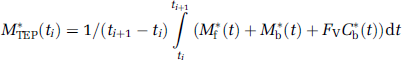
where C*b(t) is the whole blood time-concentration curve and where Fv represents the fraction of blood present in the tissue volume. For this analysis, Fv was assumed to be 0.04 mL blood/mL tissue (Perlmutter et al, 1986; Farde et al, 1989; Koeppe et al, 1991).
Experimental Protocols
In this study, two multiinjection protocols have been used. The first one, thereafter referenced as the Injection-Coinjection-Displacement (ICoD) protocol, consisted of the three following injections:
T0 min: a low dose injection (1.1 ± 0.1 nmol; 97 ± 15 MBq) of 2-[18F]fluoro-A-85380; T90 mins: a partial saturation injection, that is a coinjection of labeled (343 ± 64MBq, 7.3 ± 1.9nmol) and unlabeled 2-fluoro-A-85380, to obtain a total dose of 34.8 ± 0.9 nmol; T180 mins: a displacement, that is, an injection of a large amount of unlabeled 2-fluoro-A-85380 (2523 ±54 nmol);
The total duration of the emission acquisition was 270 mins.
The second protocol, thereafter referenced as the Injection-Displacement-Injection (IDI) protocol, consisted of the three following injections:
T0 min: a low dose injection (2.0 ± 1.3 nmol, 117 ± 36 MBq) of 2-[18F]fluoro-A-85380; T60 mins: a displacement, that is, an injection of a large amount of unlabeled 2-fluoro-A-85380 (2342 ± 224 nmol); T120 mins: a second injection of labeled ligand (353 ± 26 MBq);
The total duration of the emission acquisition was 200 mins.
The detail of administered doses is given in Table 1. All injections were approximately 1-min bolus except the displacement (5-mins bolus).
Numerical values of the protocol parameters corresponding to the seven experiments
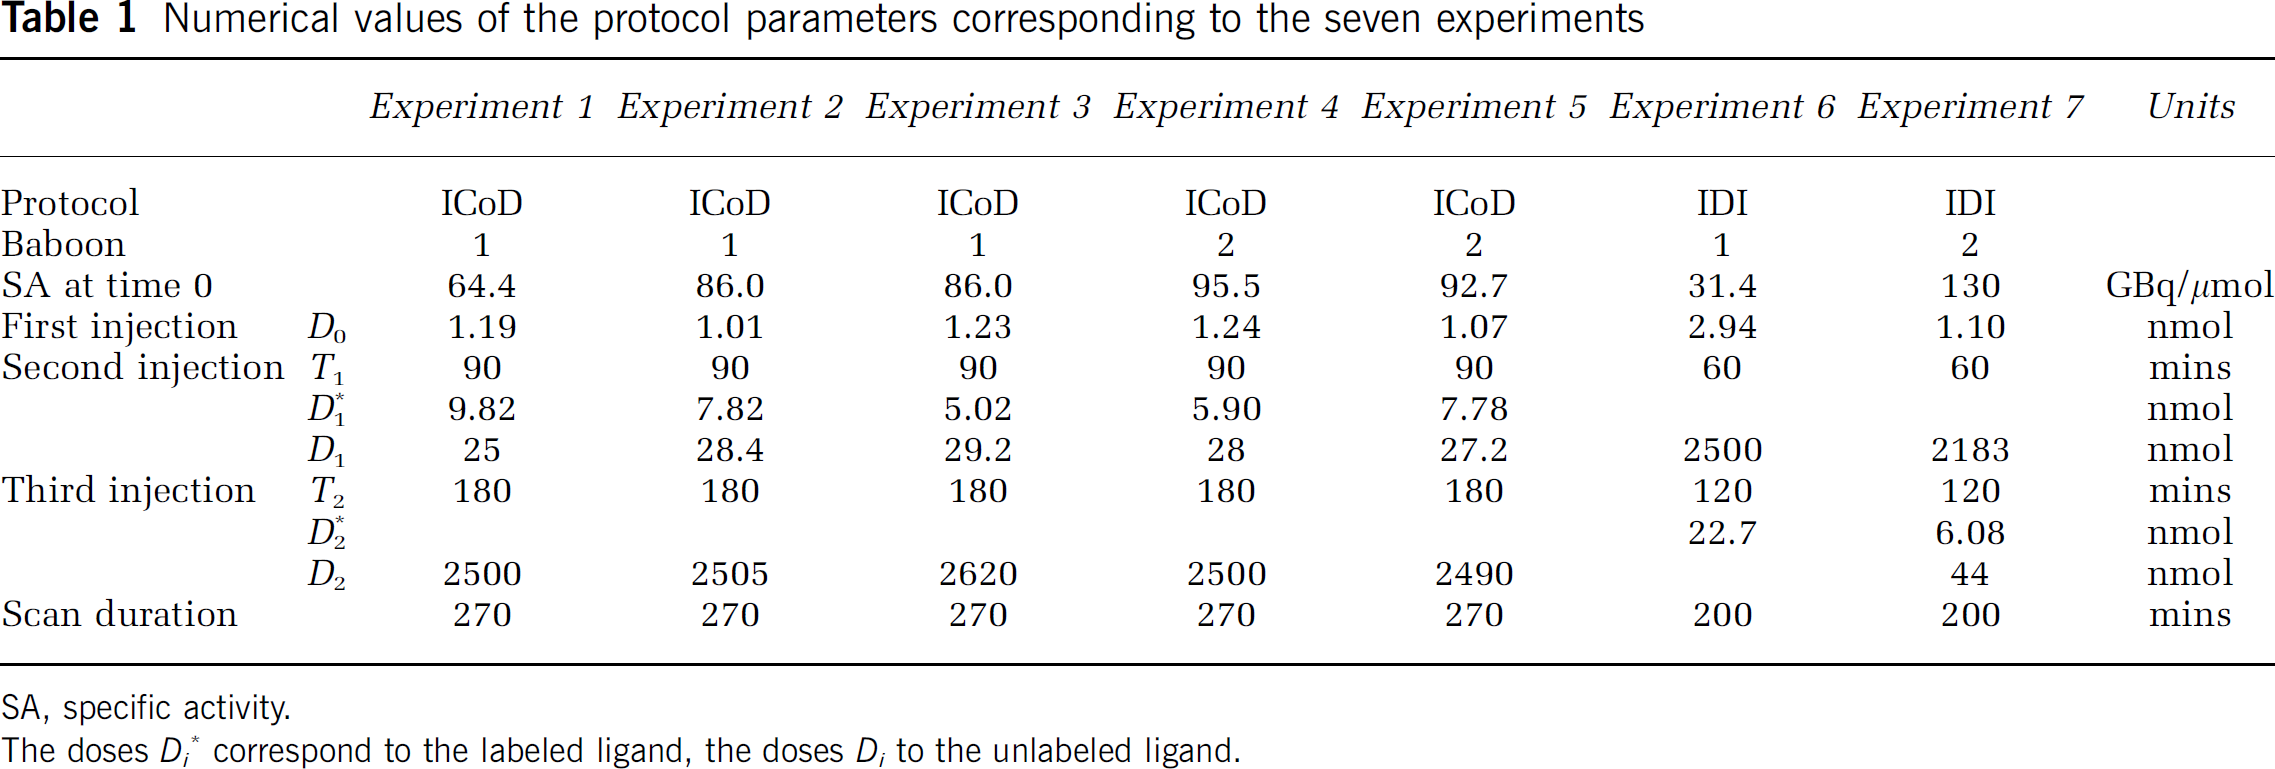
SA, specific activity.
The doses Di* correspond to the labeled ligand, the doses Di to the unlabeled ligand.
Animals
Seven PET experiments were performed on two male Papio papio baboons weighing 20.3 ± 0.9 kg. Each baboon underwent one IDI experiment. Three ICoD experiments were performed on one baboon, and two ICoD experiments on the other one. Each baboon also underwent one magnetic resonance imaging (MRI) scan.
All animal use procedures were in strict accordance with the recommendations of the European Community (86/609/CEE) and the French National Committee (décret 87/848) for the care and use of laboratory animals. Each animal was allowed to rest for a period of at least 2 weeks between PET studies.
Chemicals and Radiochemicals
2-[18F]Fluoro-A-85380: 2-Fluoro-3-[2(S)-2-azetidinylmethoxylpyridine was labeled with the positron emitter fluorine-18 (half-life = 109.8 mins) by no-carrier-added nucleophilic aromatic substitution by K[18F]F-K222 complex with (3-[2(S)-N-(tert-butoxycarbonyl)-2-azetidinylmethoxy]pyridin-2-yl)trimethylammonium trifluoromethanesulfonate as a highly efficient labeling precursor, followed by trifluoroacetic acid removal of the tert-butoxycarbonyl protective group (Dollé et al, 1999). Starting from a 7.0 GBq aliquot of a cyclotron [18F]F-production batch, 3.5 to 3.7 GBq of >99% radiochemically pure 2-fluoro-A-85380 were routinely obtained in 50 to 55 mins, with specific radioactivities of 111 to 222 GBq/μmol (overall decay-corrected radiochemical yields with respect to initial [18F]fluoride ion: 68% to 72%) (Dollé et al, 1998, 1999).
2-Fluoro-3-[2(S)-2-azetidinylmethoxy]pyridine: Authentic, unlabeled 2-fluoro-3-[2(S)-2-azetidinylmethoxy] pyridine was prepared as described previously (Dollé et al, 1998, 1999), and stored as its tartrate salt (>99% chemically pure).
Solutions for intravenous injections: All radioactive solutions of 2-[18F]fluoro-A-85380 used for each multi-injection PET protocol, were prepared from a single production batch of the radioligand and needed, before the first injection, determination of its specific radioactivity. One nanomole (maximum 3 nmol) of 2-[18F]fluoro-A-85380 (representing 74 to 148 MBq) was requested for the first injection. Relatively low-specific radioactivity 2-[18F]fluoro-A-85380 (second or third injection) was prepared by simple decay of the fluorine-18-labeled batch, followed usually (one exception – experiment 6) by addition of a known quantity of unlabeled 2-fluoro-A-85380 to adjust the total amount of the ligand to the desired value used in the PET protocol (20 to 50 nmol, 240 to 370 MBq at the time of injection). Nonradioactive solutions of the ligand were prepared using unlabeled 2-fluoro-A-85380.
Magnetic Resonance Imaging
A magnetic resonance imaging scan was performed for each baboon with a 1.5 T SIGNA system (General Electric, Milwaukee, WI), and a custom-made receive-only coil was used in proximity to the baboon's head to provide high sensibility. The animal was anesthetized by intramuscular injection of a mixture of ketamine (15 mg/kg, Ketalar; PanPharma, Fougere, France) and xylazine (1.5 mg/kg, Rompun; Bayer, Puteaux, France) (Banknieder et al, 1978) and positioned using a stereotaxic head holder. The imaging protocol used a T1-weighted inversion-recovery sequence in three-dimensional mode (256 × 192 matrix, more than 124 slices of 1.5 mm in thickness) to provide detailed anatomic images.
Positron Emission Tomography Measurement and Data Analysis
The animals were first anesthetized with ketamine (as for MRI scans) for transport from the animal facility to the scanner room. Then, the animals were intubated and anesthesia was maintained with 1% isoflurane and a mixture of 66% NO2, 33% O2, controlled by a ventilator (Ohmeda OAV 7710, Madison, WI). The number of respirations was set at 18 per min. The tidal volume was adjusted to achieve a stable end-tidal carbon dioxide tension between 38 to 42 mm Hg. The heart rate was recorded through the ventilator SpO2 probe.
The PET studies were performed on a CTI HR + Exact positron tomograph (CPS Innovations, Knoxville, TN), which allowed the acquisition in three-dimensinal mode of 63 slices with an isotropic intrinsic resolution of 4.5 mm (Brix et al, 1997). The baboon's head was fixed in a head holder. Before the first injection, a transmission scan (68Ge rods, 15 mins) was recorded to correct for γ-ray attenuation. Sixty-nine (respectively 58) sequential frames were acquired during the ICoD and IDI protocols, with acquisition duration ranging from 1 to 5 mins. Images were corrected for fluorine-18 decay from the time of the first injection.
MRI and PET images were coregistered using a mutual information algorithm (Viola and Wells, 1997). Nine ROIs were drawn in the thalamus, putamen, caudate nucleus, cerebellum, brain stem, and in the frontal, parietal, occipital, and temporal cortices. The ROIs were drawn on PET images, linked to the coregistered MRI images by our research software Anatomist (www.brainvisa.info). The ROIs were smaller than the corresponding anatomic structures, and centered on a local maximum of activity (if present), to reduce the spillover effect. MR images were used to ensure the consistency of the ROI localization, and as an aid for delineating tissues with low radioactivity (caudate nucleus, occipital cortex, and brain stem, where o local maximum of activity could be seen). The sizes of the ROIs were 321 ± 34 mm3 for the thalamus, 173 ± 23 mm3 for the caudate nucleus, 303 ±26 mm3 for the putamen, 195 ± 20 mm3 for the cerebellum, 193 mm3 for the brain stem, 408 ± 54 mm3 for the frontal cortex, 121 ± 17 mm3 for the parietal cortex, 390 ±85 mm3 for the occipital cortex, and 348 ± 9 mm3 for the temporal cortex. Concentrations of radioactivity in the ROIs were calculated for each frame and expressed as picomoles per mL (pmol/mL), by dividing the radioactivity by the specific activity at the time of the first injection.
Input Function and Metabolites Studies
During PET acquisition, arterial blood samples were withdrawn from a femoral artery at designated times (71 to 83 samples for the ICoD protocol, 65 to 66 samples for the IDI protocol). The interval between each sample varied: it ranged from 10 to 15 secs during the first 2 mins after each injection of labeled 2-fluoro-A-85380 to up to 10 mins when the distribution phase was completed. Whole blood and plasma radioactivity were measured in a cross-calibrated γ-counter (Cobra Quantum D5003; Perkin-Elmer, Courtaboeuf, France) and the time—activity curves were corrected for fluorine-18 decay from the time of the first injection.
The amount of unchanged radiotracer in plasma was measured in selected samples (four for each labeled ligand injection) as described previously (Valette et al, 1999b; Gallezot et al, 2005). The amount of unchanged radiotracer was expressed as a percentage of total radioactivity in plasma and used for the calculation of the arterial input function corrected for metabolites.
Variations of Parameter K1
Using the model and constants described in Figure 1, the quality of fit was unacceptably low in most experiments. On the basis of complementary analysis (see Results section) and physiologic considerations (see Discussion section), parameter K1 was allowed to vary during the experiment, following a step function: K1(t) = K1a for tc, K1(t) = K1b for t >tc. The time tc was set at the time of the second injection (i.e., 90 mins in the ICoD protocol, 60 mins in the IDI protocol). The volume of distribution of the free ligand DV1 = K1/k2 was assumed to remain constant throughout the experiment (i.e., k2(t) = DV1/K1(t)). Thus, the set of parameters used during the optimization procedure was B'max, kon/VR, koff, K1a, K1b, and DV1. The introduction of this K1 variation in the model increased the number of fitted parameters from five to six.
Parameter Identification
The model parameters were identified by minimizing of the usual weighted least-squared cost function:
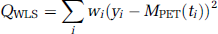
where yi is the measured (and decay-corrected) concentration of 2-[18F]fluoro-A-85380 in the ROI during frame number i. The weights wi were computed taking into account the frame duration and the radioactivity concentration into the ROI (Mazoyer et al, 1986). That is:
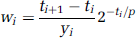
where p is the radioactive half-life of fluorine-18 (109.8 mins). The cost function was minimized using the Marquardt—Levenberg algorithm (Marquardt, 1963). The estimation of parameter standard errors (s.e.) is based on the use of a sensitivity analysis and the covariance matrix (Beck and Arnold, 1977; Carson, 1986; Delforge et al, 1989). All computations were made using custom-made or built-in routines in Matlab 7® (www.mathworks.com).
All result values listed in the text are expressed as interexperiment mean ± standard deviation, unless otherwise stated.
Results
Plasma Time—Concentration Curves
The radioactivity concentration in the plasma decreased slowly after the peak, with a late exponential rate of 0.0056 ±0.0017 min−1. The fraction of unchanged 2-[18F]fluoro-A-85380 in arterial plasma could be fitted with a sum of two exponential functions with a first exponential rate of 0.07 ± 0.02 min−1 (range, 0.04 to 0.09 min−1) and a second exponential rate of 0.0009 ± 0.0010 min−1 (range, 0 to 0.002 min−1). The injected mass had no detectable effect on the radioactivity concentration in the plasma (expressed in %ID/mL) and the metabolism rate.
Brain Time-Concentration Curves
Figures 2A and 2B show two examples of time—concentration curves (thalamus and frontal cortex) obtained with the ICoD protocol and the IDI protocol, respectively.
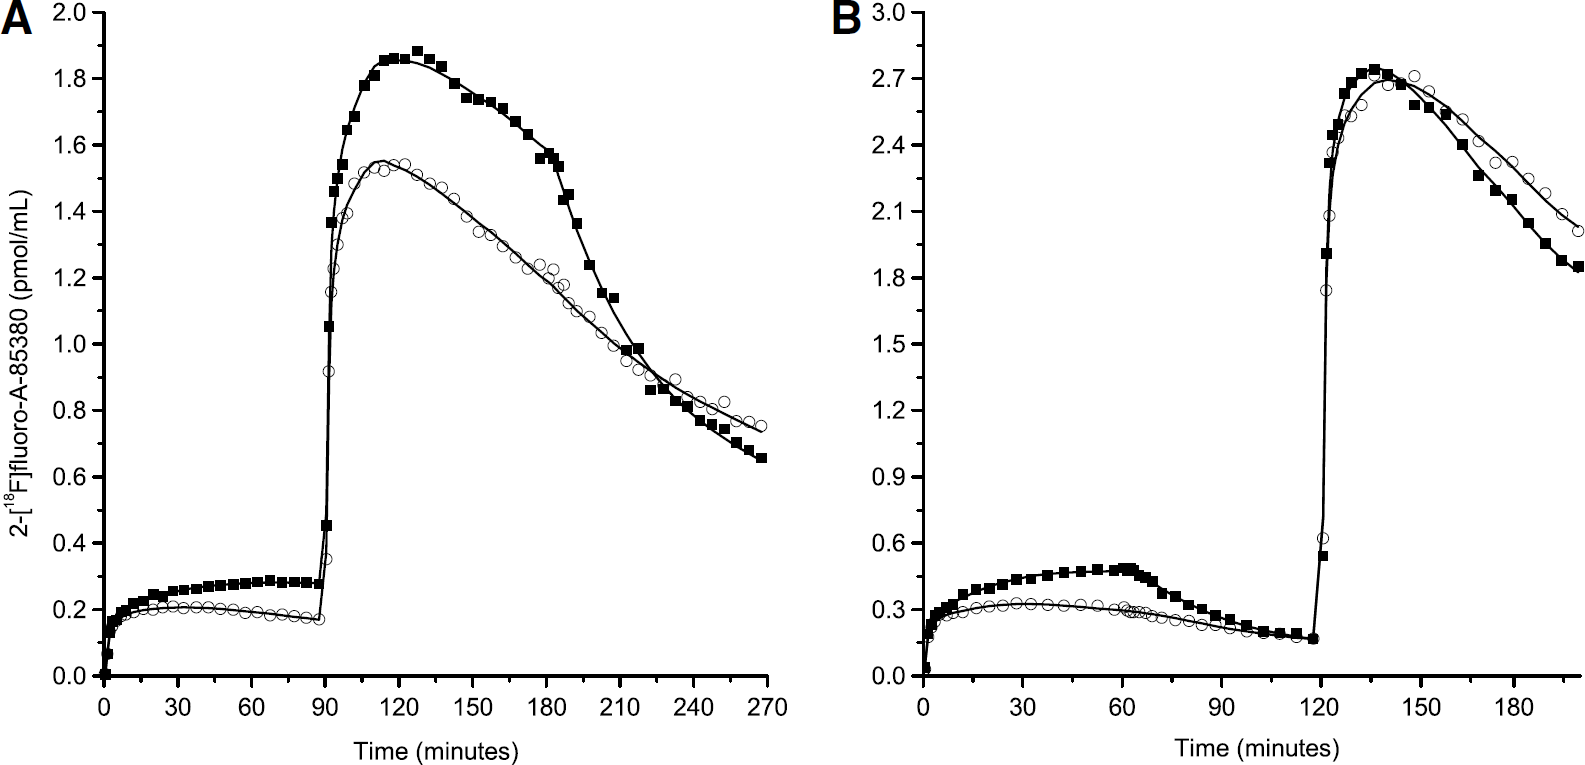
Examples of PET data obtained in baboon using the ICoD – experiment 5 (
After the first injection of 2-[18F]fluoro-A-85380 (high-specific activity), the radioligand concentration raised rapidly in all regions during the first minutes, corresponding to the peak of the input function. Then, in most ICoD experiments, the concentration in the thalamus kept increasing slowly during 90 mins (experiments 1, 2, 3, and 5). In experiment 4, however, the thalamus curve reached a maximum 55 mins post-injection and then slowly decreased. In the IDI experiments, because the observation time was shorter (60 mins), no interexperiment differences could be clearly seen, and the concentration kept increasing until the displacement injection. In all other regions, the time-concentration curves reached a maximum between 20 and 40 mins after the first injection, and then slowly decreased.
In the ICoD experiments, after the coinjection of labeled and unlabeled 2-fluoro-A-85380 at 90 mins, the time-concentration curves peaked between 110 and 130 mins in all regions, and then slowly decreased. The injection of a large amount of unlabeled 2-fluoro-A-85380 at time 180 mins, led to a decrease in 2-[18F]fluoro-A-85380 concentration in the thalamus, which can be explained by the saturation of the binding sites by the unlabeled ligand and the dissociation of the labeled bound ligand. In the extrathalamic regions, the effect of the displacement injection was much smaller, and not clearly visible for all regions or experiments.
In the IDI experiments, the injection of a large amount of unlabeled 2-fluoro-A-85380 at 60 mins also led to a decrease of the concentration in the thalamus, and to a lower extent, in the other brain regions. After the second injection of labeled 2-fluoro-A-85380 at 120 mins, all time-concentration curves peaked between 135 and 150 mins and then slowly decreased.
Variations of Parameter K1
When keeping K1 constant, a mismatch between the experimental data and the fitted curve was observed during the analysis of the ICoD experiments. This mismatch was mainly located within the first minutes after each injection of labeled ligand: the simulated curve overestimated the experimental data after the first injection, and underestimated the experimental data after the second injection. Two hypotheses can explain these discrepancies. First, the structure of the model could be invalid. Second, an increase in K1 may have occurred between the two injections of labeled ligand.
The model may have been invalid because of the lack of a nonspecific compartment. However, the inclusion of a nonspecific compartment did not significantly reduce the χ2 criterion (maximum decrease in the thalamus: 9.7%). Even more complicated models, including multiple binding sites or affinity states, also did not produce acceptable fits.
To test the second hypothesis, the fitting interval was reduced from 0 to 270 mins to 0 to 100 mins. Then, only the data obtained after the first injection and in the first 10 mins after the partial saturation injection were taken into account. In spite of this reduction of the number of data points, the quality of the fit was still unsatisfactory: the fitted curve still overestimated the experimental during the first 20 mins, and the experimental points ranging from 90 to 100 mins were still underestimated. This showed that the influx rate of the ligand during the early phase of the second injection was not compatible with the influx rate observed during the first injection. Therefore, we assumed that the blood flow (or the blood—brain barrier permeability) was modified after the second ligand injection and that we had to introduce in the model two different values of parameter K1: K1a at the beginning of the experiment and K1b after the second injection.
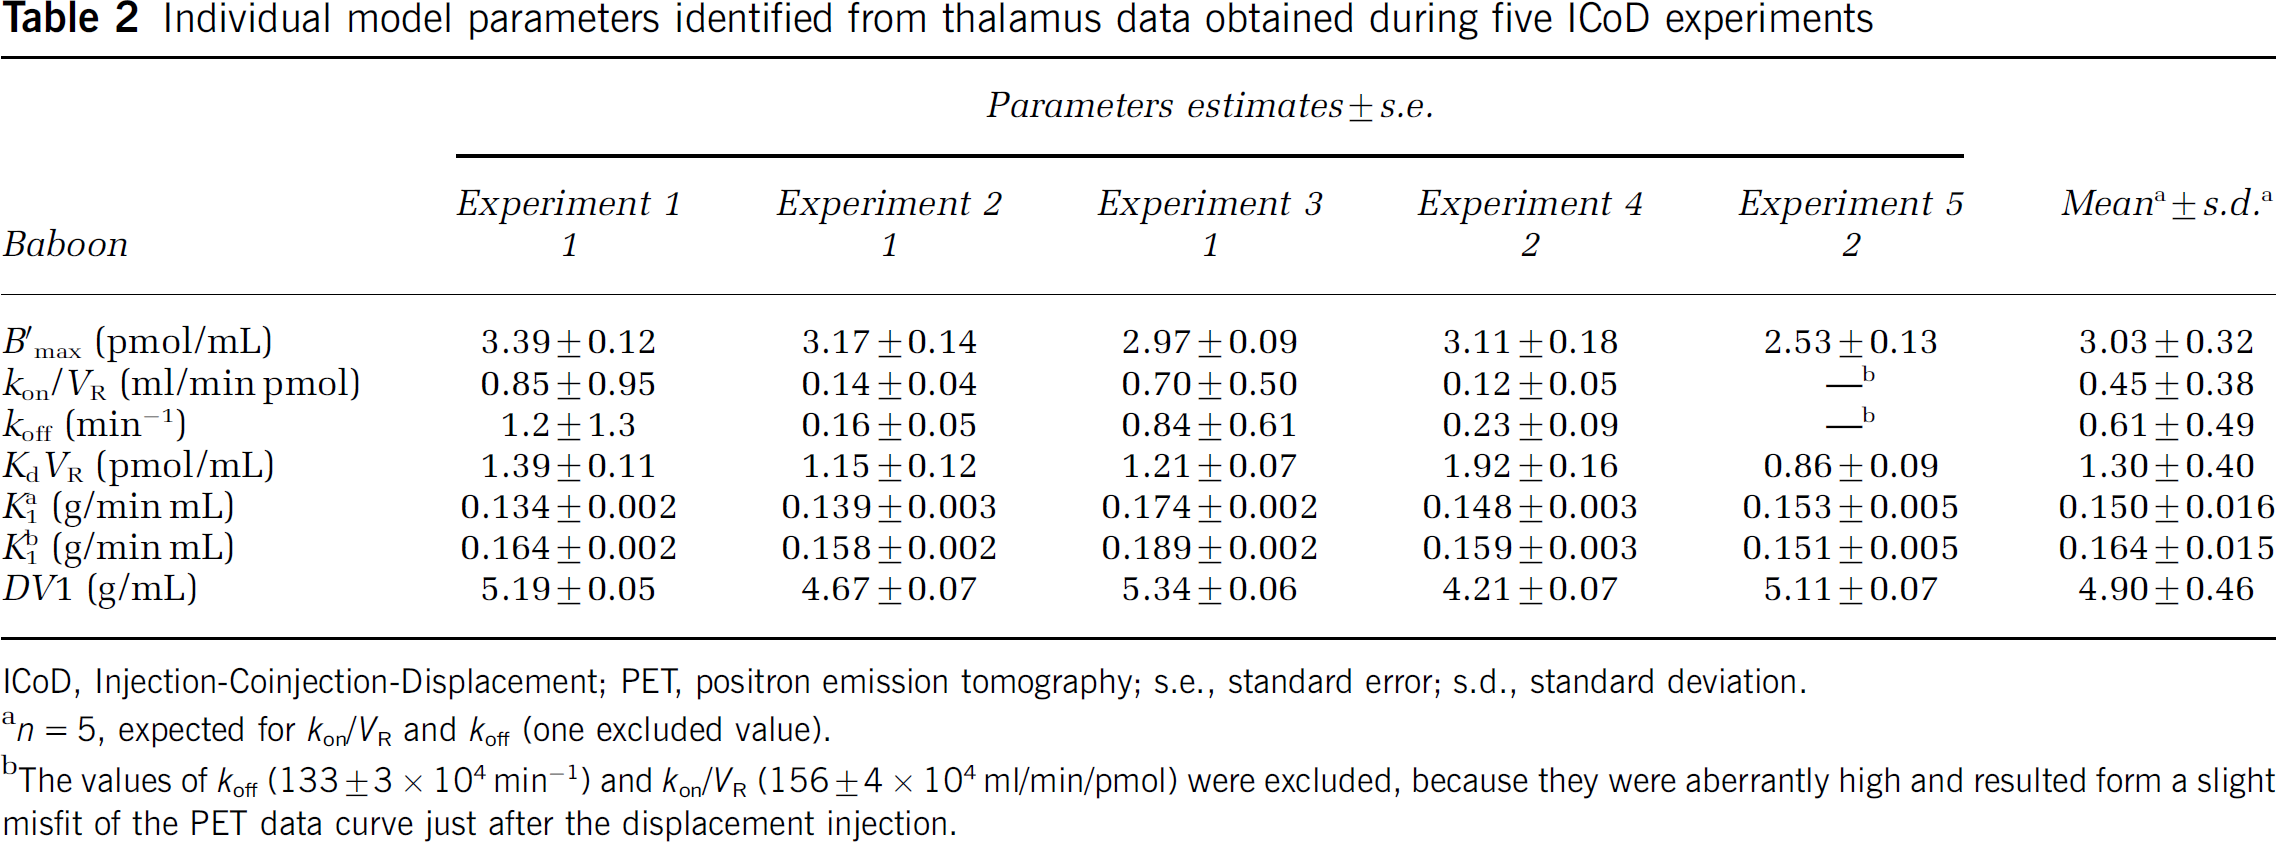
As expected, χ2 criterion decreased after the introduction of the K1 variation in the model, because of the additional degree of freedom. This decrease was important (mean decrease, 32.5%; range, 0.6% to 84.2%), showing the interest of this modification. Both K1a K1b could be very precisely identified in all experiments, with typical relative s.e. (RSE) of 2%. In experiments 1 to 4, K1b was higher than K1a in all ROIs, excepted in the occipital cortex. In experiment 5, the differences were negligible for all ROIs. The maximal relative increase between K1a K1b was 23% in the thalamus and ranged from 4% (occipital cortex) to 27% (putamen) in the extrathalamic regions. The variations tended to be higher in the putamen than in the other regions, and lower in the cerebellum and occipital cortex. In the latter area the increase was negligible, and even slight decreases were observed in some experiments. See Table 2 for the detailed K1a K1b values obtained in the thalamus, and Table 3 for the mean values of K1a K1b in extrathalamic regions. The relative difference between K1a K1b was correlated with the decrease of the χ2 criterion (r = 0.98 in the thalamus).
Individual model parameters identified from thalamus data obtained during five ICoD experiments
ICoD, Injection-Coinjection-Displacement; PET, positron emission tomography; s.e., standard error; s.d., standard deviation.
n = 5, expected for kon/VR and koff (one excluded value).
The values of koff (133 ± 3 × 10⁴ min−1) and kon/VR (156 ± 4 × 10⁴ ml/min/pmol) were excluded, because they were aberrantly high and resulted form a slight misfit of the PET data curve just after the displacement injection.
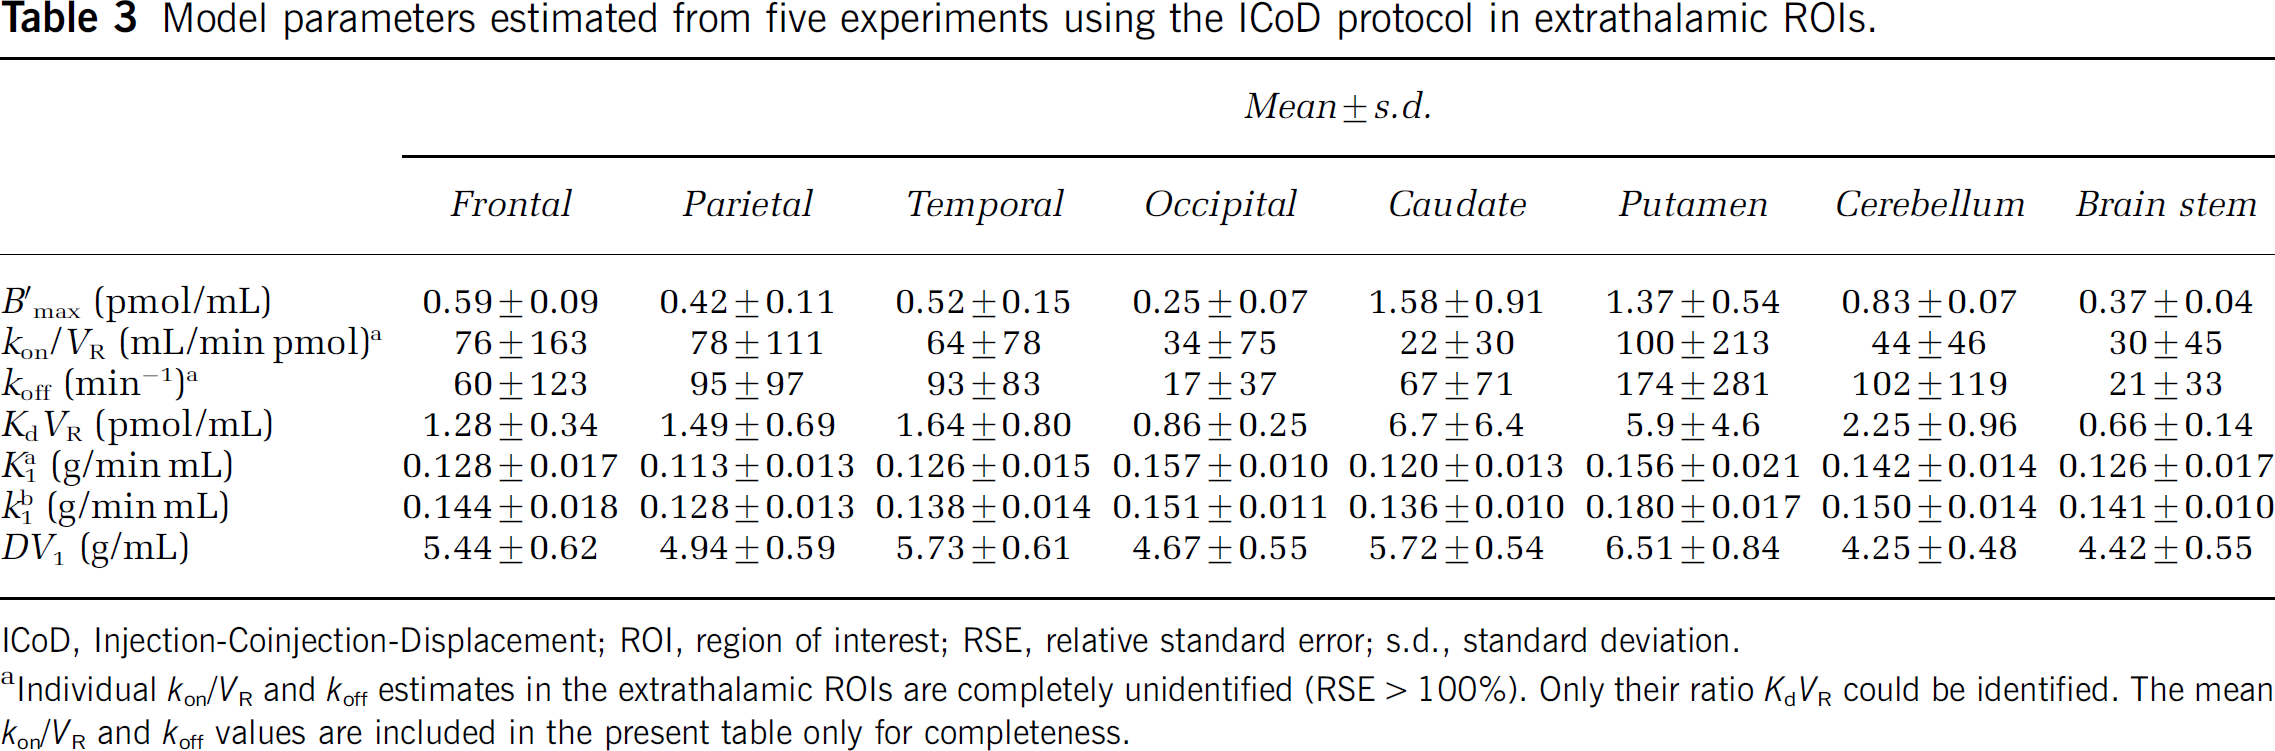
Model parameters estimated from five experiments using the ICoD protocol in extrathalamic ROIs.
ICoD, Injection-Coinjection-Displacement; ROI, region of interest; RSE, relative standard error; s.d., standard deviation.
Individual kon/VR and koff estimates in the extrathalamic ROIs are completely unidentified (RSE > 100%). Only their ratio KdVR could be identified. The mean kon/VR and koff values are included in the present table only for completeness.
Physiologic Recordings
pCO2 stayed in the normocapnic range (38 to 42 mm Hg) throughout the experiments. The heart rate tended to decrease from 30 to 60 mins (115 ± 4 at 60 mins) until the end of the experiment (99 ± 4 at 270 mins). This decrease over time is statistically significant: each scan data can be fitted with a monoexponential decrease function with P <0.05. However, the injections of 2-fluoro-A85380 had no immediate effect on heart rate, nor modified the general trend. Moreover, a nicotinic agonist is more likely to increase heart rate. With 2-fluoro-A-85380, small increases of arterial blood pressure have indeed been reported, but at higher doses (≥500 nmol/kg; Valette et al, 1999b). It is also difficult to relate this variation of heart rate to a variation of cerebral blood flow due to the number of mechanisms involved. For example, anesthesia can have opposite effects on the cardiovascular function and cerebral blood flow: isoflurane has minor, and variable, effects on heart rate (it can decrease or increase it), tends to decrease arterial blood pressure, and to increase cerebral blood flow (Eger, 1984). Thus, these heart rate variations were not used during the data analysis.
Parameter Identification
The ligand—receptor model included two tissue compartments (free and specifically bound ligand) and six parameters to estimate (because of the need to introduce two different values for K1).
Injection-Coinjection-Displacement Protocol: Table 2 shows the detailed results (parameters estimates and s.e. calculated using the covariance matrix) obtained in the thalamus from the five ICoD experiments. The last column of Table 2 shows the average parameter values and the standard deviations calculated from the five experiments. Using this protocol, only five parameters could be correctly identified from a single experiment in the thalamus: B'max, KdVR, K1a, F1b, and DV1. Indeed, the association and dissociation constants konVR and koff could not be identified separately in some experiments: the RSE is too large (experiments 1 and 3) or the estimated value is aberrant (experiment 5). The other parameters are correctly identified, because the maximal RSEs are 5.8% for B'max, 10.1% for KdVR, 3.4% for both K1a K1b, and 1.6% for DV1, B'max and KdVR are estimated to be 3.0 ± 0.3 pmol/mL and 1.3 ± 0.4 pmol/mL, respectively.
The results are similar in the extrathalamic ROIs: all parameters are identifiable except konVR and koff (only the ratio KdVR was identified). For B'max, the range of RSE is 14% to 23% in the cerebellum, 10% to 28%, 13% to 33%, 21% to 47%, 21% to 55% in the frontal, temporal, occipital, and parietal cortex, respectively, 17% to 43% and 13% to 105% in the putamen and caudate, respectively, and 19% to 40% in the brain stem. The RSEs for KdVR are approximately equal to the ones of B'max in all (extrathalamic) ROIs and experiments. The RSEs are below 8.7% for K1a, 3.3% for K1b, and 2.8% for DV1. The mean values and standard deviations of the parameters, estimated from the five experiments are given in Table 3. The highest B'max values are reached in the caudate (1.6 ± 0.9 pmol/mL) and putamen (1.4 ± 0.5 pmol/mL), whereas the lowest B'max values are observed in the occipital cortex (0.25 ± 0.07 pmol/mL). For the apparent affinity KdVR, the highest value are also observed in the caudate (6.7 ± 6.4 pmol/mL) and putamen (5.8 ± 4.6 pmol/mL), whereas the lowest values are observed in the brain stem (0.66 ± 0.14 pmol/mL).
Injection-Displacement-Injection Protocol: To attempt to estimate kon/VR and koff more precisely, the IDI protocol was used. This protocol allowed us to obtain better estimates of koff in the thalamus: the RSE are below 28%. It is however at the expense of the quality of the estimates of other parameters: RSEs are higher than 40% for B'max, and 32% for KdVR. The RSE for K1a (< 2.2%), K1b (< 1.7%), and DV1 (<6.7%) are comparable to the ones obtained with the ICoD protocol. koff is estimated to be 0.31 ± 0.03 min-1. K1a, K1b, DV1, B'max, kon/VR, and KdVR estimates are 0.169 ± 0.004 g/min mL, 0.174 ± 0.002 g/min mL, 3.86 ± 0.04 g/mL, 22.2 ± 8.5 pmol/mL, 0.035 ± 0.012 mL/min pmol, and 9.5 ± 3.9 pmol/mL, respectively.
Simultaneous Analysis of Injection-Displacement-Injection and Injection-Coinjection-Displacement Experiments: Because the identification of parameters B'max, kon/VR and KdVR was not satisfactory with the IDI protocol alone, and could result in an error on the estimation of koff, we have tested a simultaneous fit of ICoD and IDI experiment data. We assumed that parameters B'max and koff are the same in the two experiments. Then, ICoD experiment data should provide information to estimate B'max (and subsequently KdVR), whereas IDI experiment data should provide information to estimate koff (and subsequently kon/VR). Each ICoD experiment data was analyzed with the IDI experiment data from the same animal. Detailed results obtained in the thalamus are shown in Table 4.
Model parameters identified from thalamus data by performing a simultaneous analysis of one ICoD and one IDI experiment with shared parameters B'max and koff
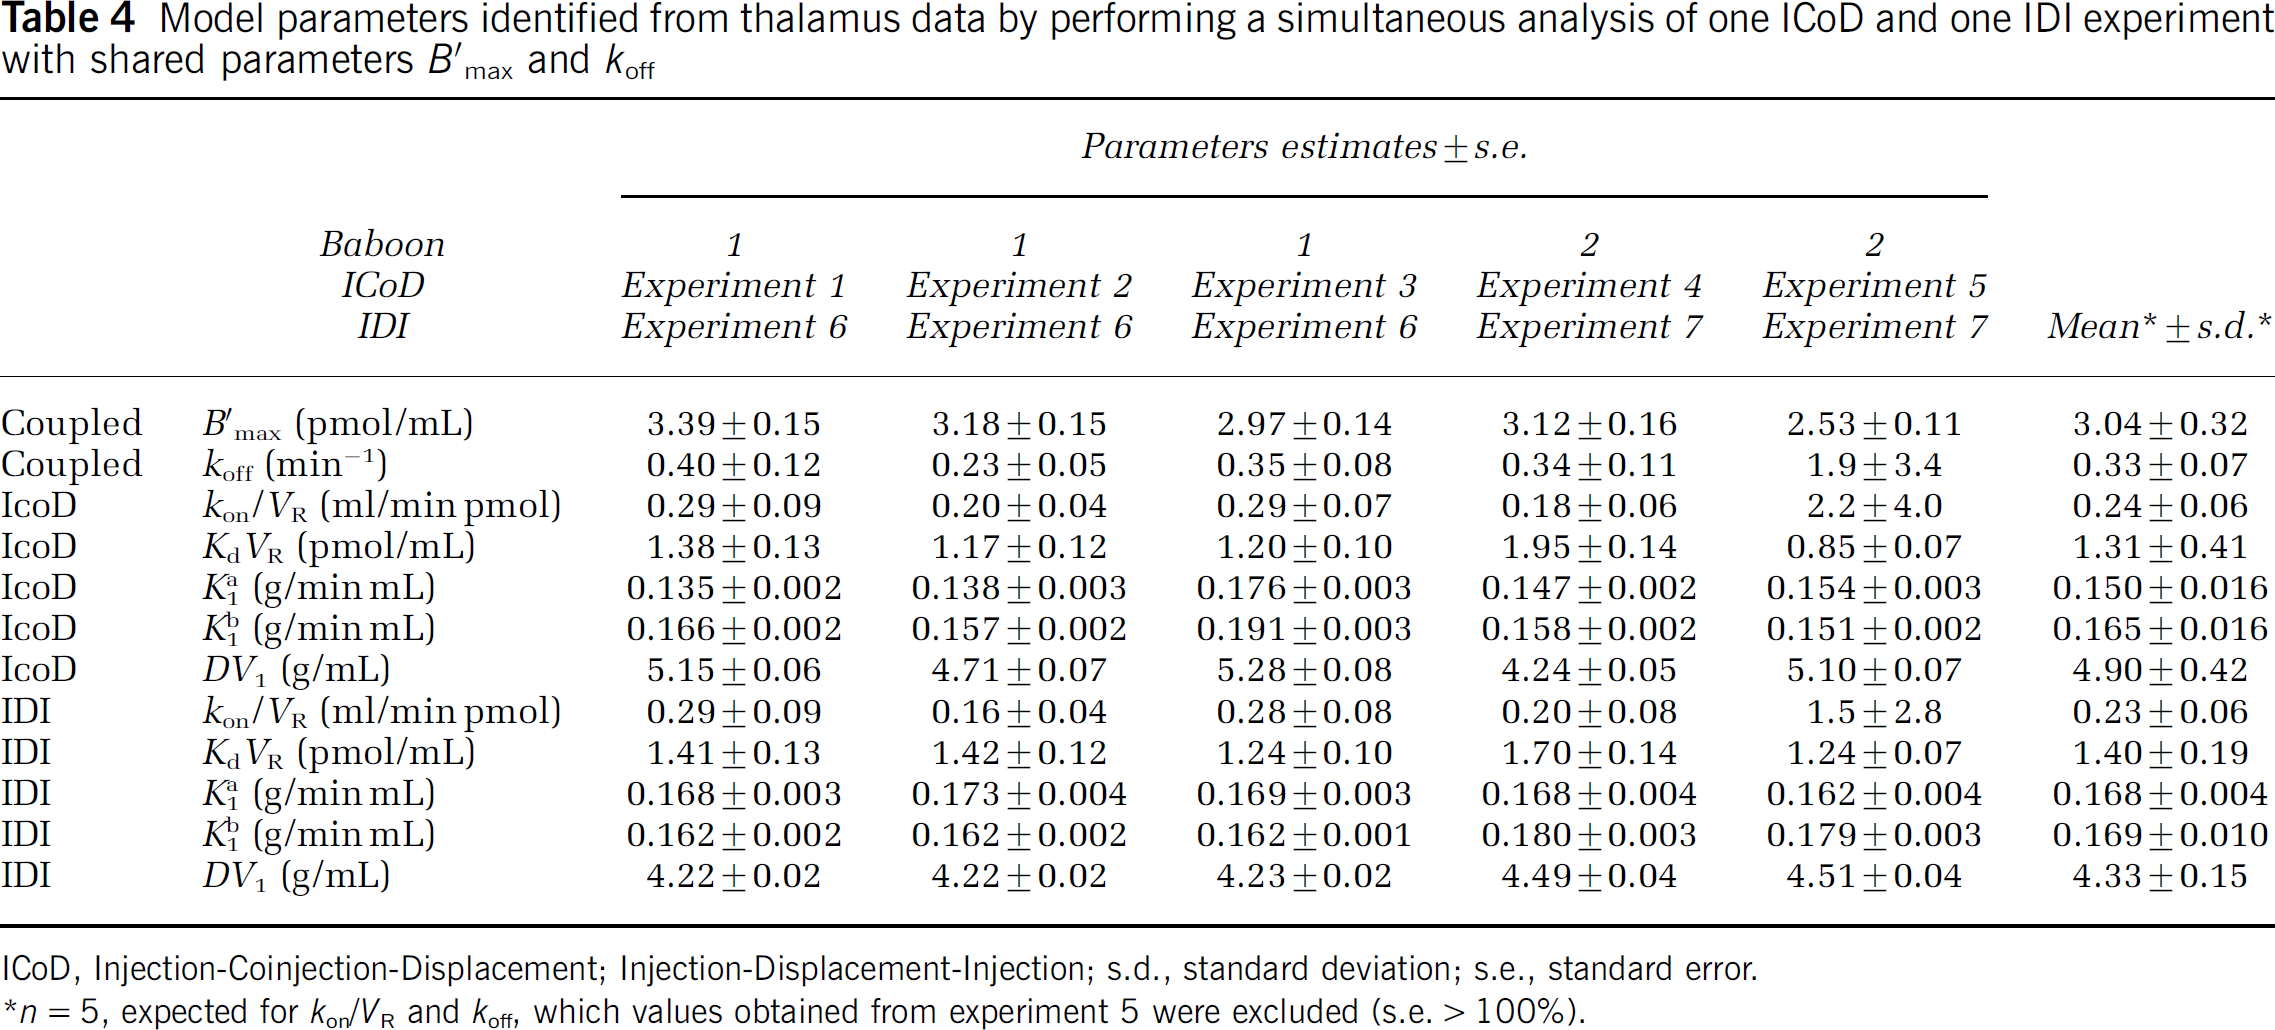
ICoD, Injection-Coinjection-Displacement; Injection-Displacement-Injection; s.d., standard deviation; s.e., standard error.
n = 5, expected for kon/VR and koff, which values obtained from experiment 5 were excluded (s.e. > 100%).
As expected, B'max estimates are almost the same as the ones listed in Table 2 (maximal variation 0.2%). The estimation of koff is improved compared with the results obtained from the analysis of ICoD experiment data alone: in experiments 1 to 4, the mean RSE is 26%. These RSEs are about the same than the ones obtained with the IDI experiment data alone. However in experiment 5, although the value was less aberrant, the standard error remains large.
The estimation of kon/VR is similarly improved compared with the analysis of ICoD experiment data alone, and also compared with the analysis of IDI experiment data alone. The koff and kon/VR values estimated using experiments 1 to 4 is 0.33 ± 0.07 min−1 0.23 ± 0.06 mL/min pmol, respectively. Again, this estimate of koff is close to the value (0.31 min−1) obtained with the IDI experiment data alone.
This analysis was performed only in the thalamus because the amplitude of the displacement was too low in the extrathalamic regions to allow a correct estimation of koff, even by using all the available experimental data obtained with the two protocols. Therefore the parameter koff was set in all regions to 0.33 min−1 (the value obtained in the thalamus). This hypothesis led to only moderate increases of the χ2 criterion (<12%) and the other parameter estimates did not change significantly (expected obviously kon/VR) (Table 5).
Model parameters estimated from five experiments using the ICoD protocol in extrathalamic ROIs, using a fixed koff value
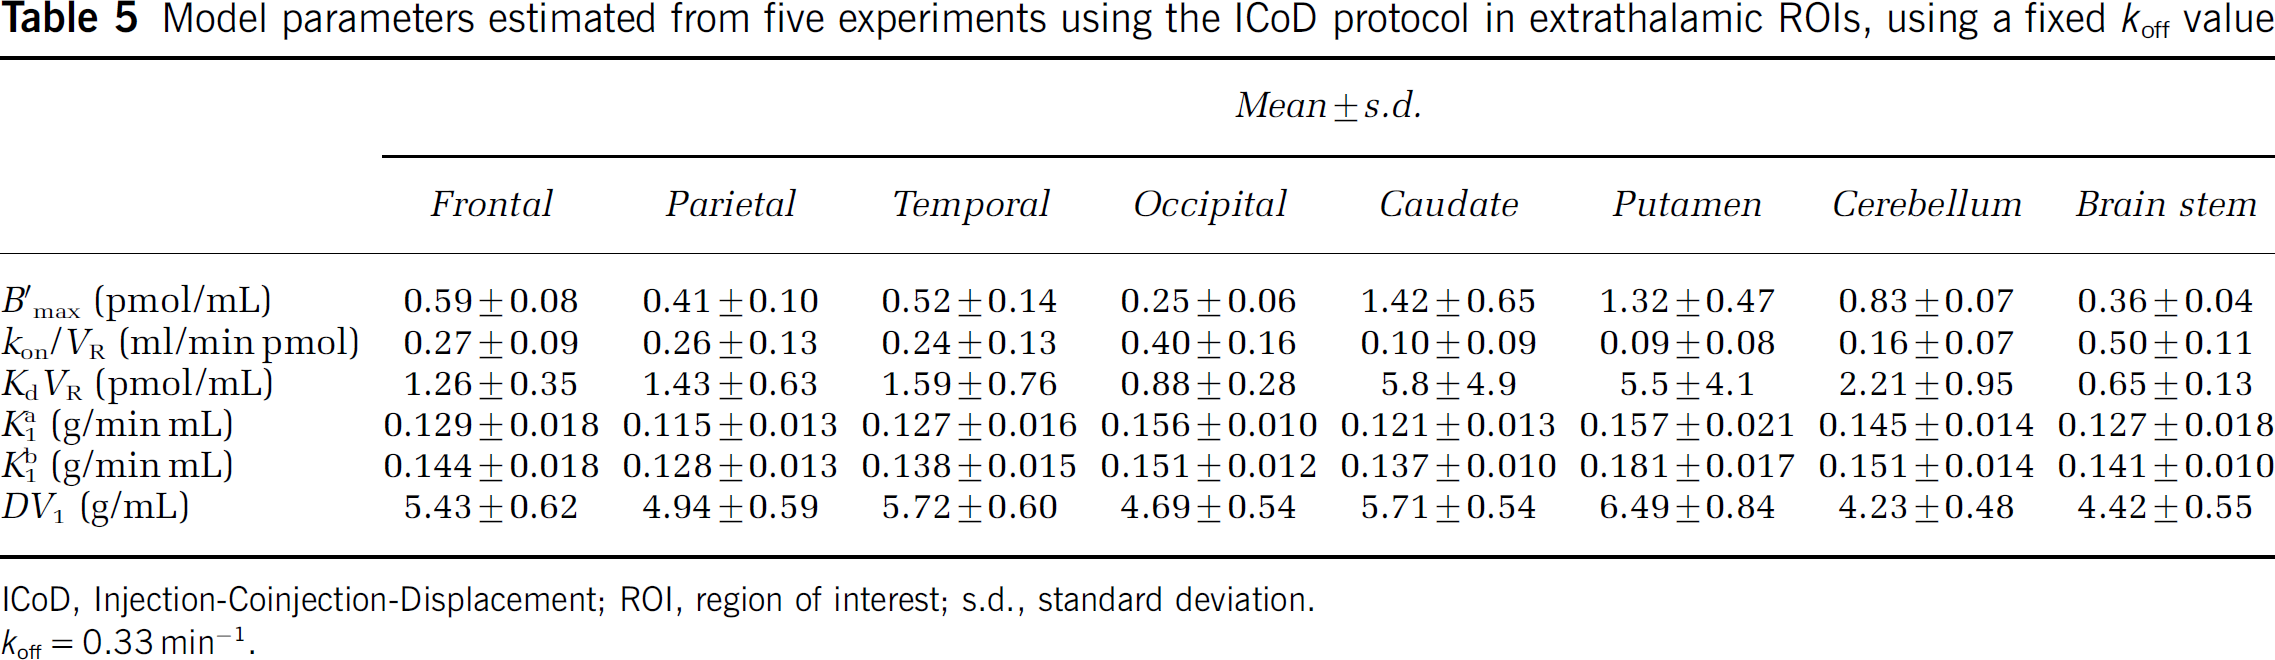
ICoD, Injection-Coinjection-Displacement; ROI, region of interest; s.d., standard deviation.
koff = 0.33 min−1.
Simulation of Compartmental Kinetics: One of the advantages of estimating all the parameters of the model is the possibility of simulating the time—concentration curves in all compartments. Simulations of both experimental protocols were performed using the input functions of experiment 1 (ICoD protocol) or experiment 6 (IDI protocol) and the mean model parameters given in Table 4 (thalamus) or Table 5 (extrathalamic regions). Figure 3 shows the simulated kinetics in the thalamus (Figures 3A and 3C) and in a receptor-poor region, the frontal cortex (Figures 3B and 3D).
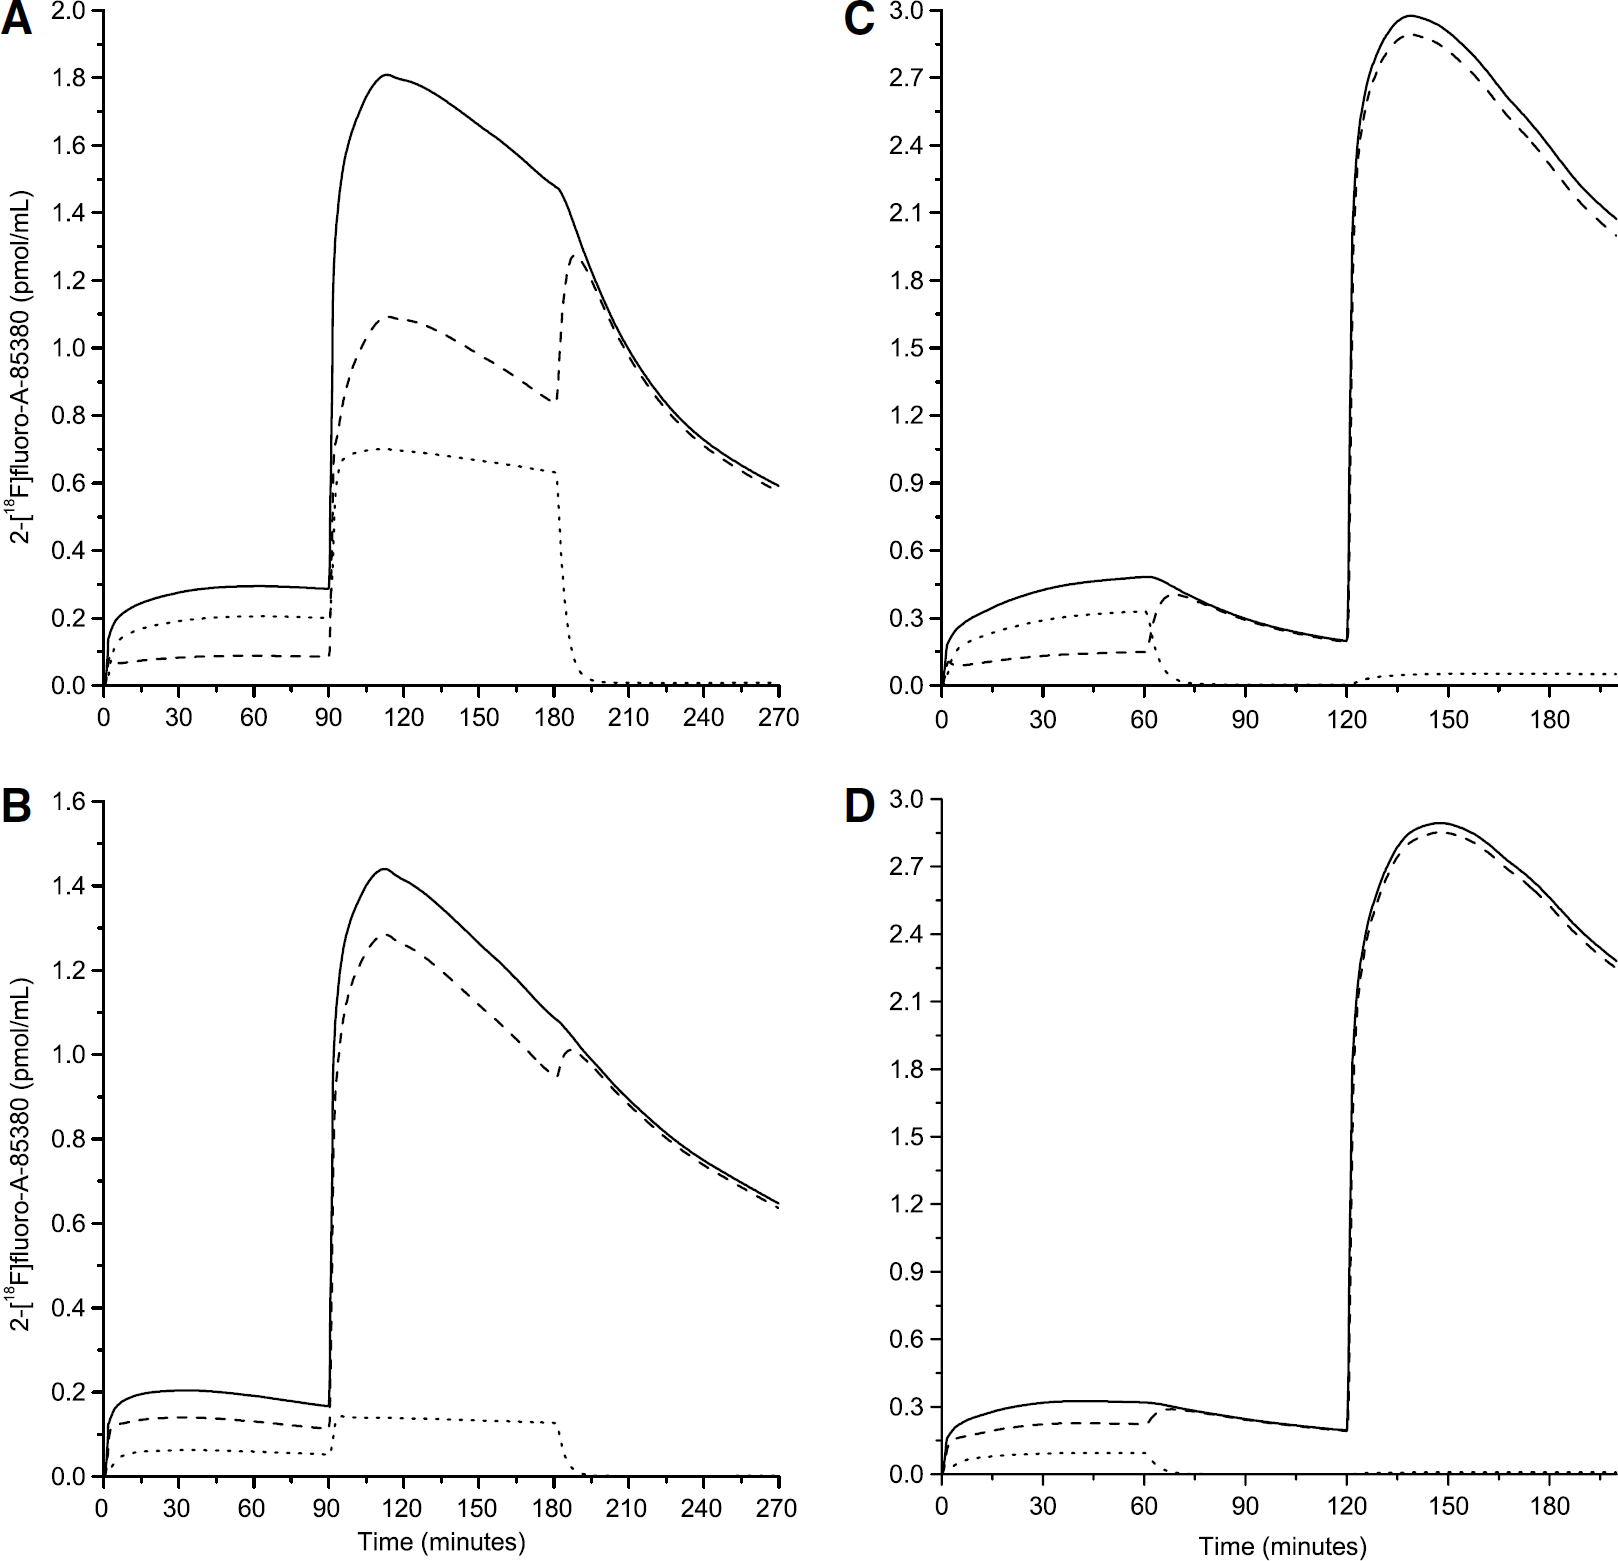
Examples of simulations of the 2-[18F]fluoro-A-85380 kinetics during the ICoD (A and B) and the IDI (C and D) protocols. The ROIs are the thalamus (A and C) and the frontal cortex (B and D). This figure shows the concentration of 2-[18F]fluoro-A-85380 in the free compartment (dashed line), the specifically bound compartment (dotted line), and the simulated PET data (continuous line) that is obtained by the sum of the concentration of the two tissue compartments and the vascular fraction (not shown).
These simulations show that after the injection of unlabeled ligand at 180 mins in the ICoD protocol, or 60 mins in the IDI protocol, the quantity of bound labeled ligand decreases rapidly: it represents only 2% of the total radioactivity in the tissue 10 mins after the injection of unlabeled ligand. The labeled ligand tends then to accumulate in the free compartment, and finally slowly clears from the tissue. The decrease of the total radioactivity in the tissue observed by PET after the displacement injection is thus limited by the low value of k2, and only moderately depends on the value of koff. This explains the difficulty to identify koff.
These simulations also explain the higher difficulty to identify B'max and KdVR in the extrathalamic regions. After the first injection, in the thalamus most of the radioactivity measured by PET correspond to ligand bound to the receptors (69%), whereas in the frontal cortex, the quantity of bound ligand represents only 30% of the total radioactivity. Additionally, in the ICoD protocol after the coinjection of labeled and unlabeled ligand at 90 mins, the specifically bound ligand concentration represents 39% to 44% of total radioactivity concentration in the thalamus, and only 10% to 12% in the frontal cortex.
Finally, the simulations also allow estimation of the receptor occupancy by both labeled and unlabeled ligand. After the first injection (1.2 nmol), the maximal receptor occupancy is 4.7% in the thalamus, 4.9% in the cerebellum, 3.6% in the basal ganglia, 12.3% in the brain stem, and range from 7.2% to 13% in the cortex. In the ICoD protocol, after the second injection (35 nmol), receptor occupancies correspond to a partial saturation: 69% in the thalamus, 56% in the cerebellum, 52% in the basal ganglia, 80% in the brain stem, and ranged from 72% to 76% in the cortex. After the third injection (a large amount of unlabeled ligand), the receptor occupancy is approximately 99% from 190 mins to the end of the experiment.
Studies of the Equilibrium States
Using simulations, we have studied the two most important equilibrium states. The first one is the capillary exchange equilibrium state (equilibrium between the arterial plasma and the free ligand compartments). The second one is the binding equilibrium state (equilibrium between the free and the bound ligand compartments). After a bolus injection, the concentration in the arterial plasma is not constant, and thus no true equilibrium can be reached. A pseudo-equilibrium state between the arterial plasma compartment and the free compartment is defined when the ratio M*f(t)/C*a(t) is constant. At the binding site level, it can be useful to define two pseudo-equilibriums. First, at nontracer doses, when the model is nonlinear, a pseudo-equilibrium between the free and specifically bound ligand compartments can be defined when the ratios M*b(t)/M*f(t) and (B'max–M*b(t))/KdVR are (approximately) equal (Delforge et al, 1993, 1999). This means that a plot of M*b(t)/M*f(t) versus M*b(t) (i.e., a Scatchard plot) is linear after a time teq. For this reason, we are calling this state a pseudo Scatchard equilibrium state. Then, at tracer dose, when the model is linear, a pseudo-equilibrium state between the free and bound compartment can also be defined when the ratio M*b(t)/M*f(t) is constant. This pseudo-equilibrium has been called quasi-equilibrium (Slifstein and Laruelle, 2001) or transient-equilibrium (Carson et al, 1993).
The simulations were performed using the mean parameters of Table 4 (thalamus) or Table 5 (extrathalamic regions), and an input function derived from experiment 6. The level of the input function was adjusted to simulate a tracer dose injection (0.5 nmol) and a partial saturation injection (35 nmol). Then, the input function was fitted by a sum of three exponential functions and extrapolated until 18 h. The lowest exponential rate constant (thereafter noted as β) was 0.005 min−1. The simulation results are presented in Figure 4.
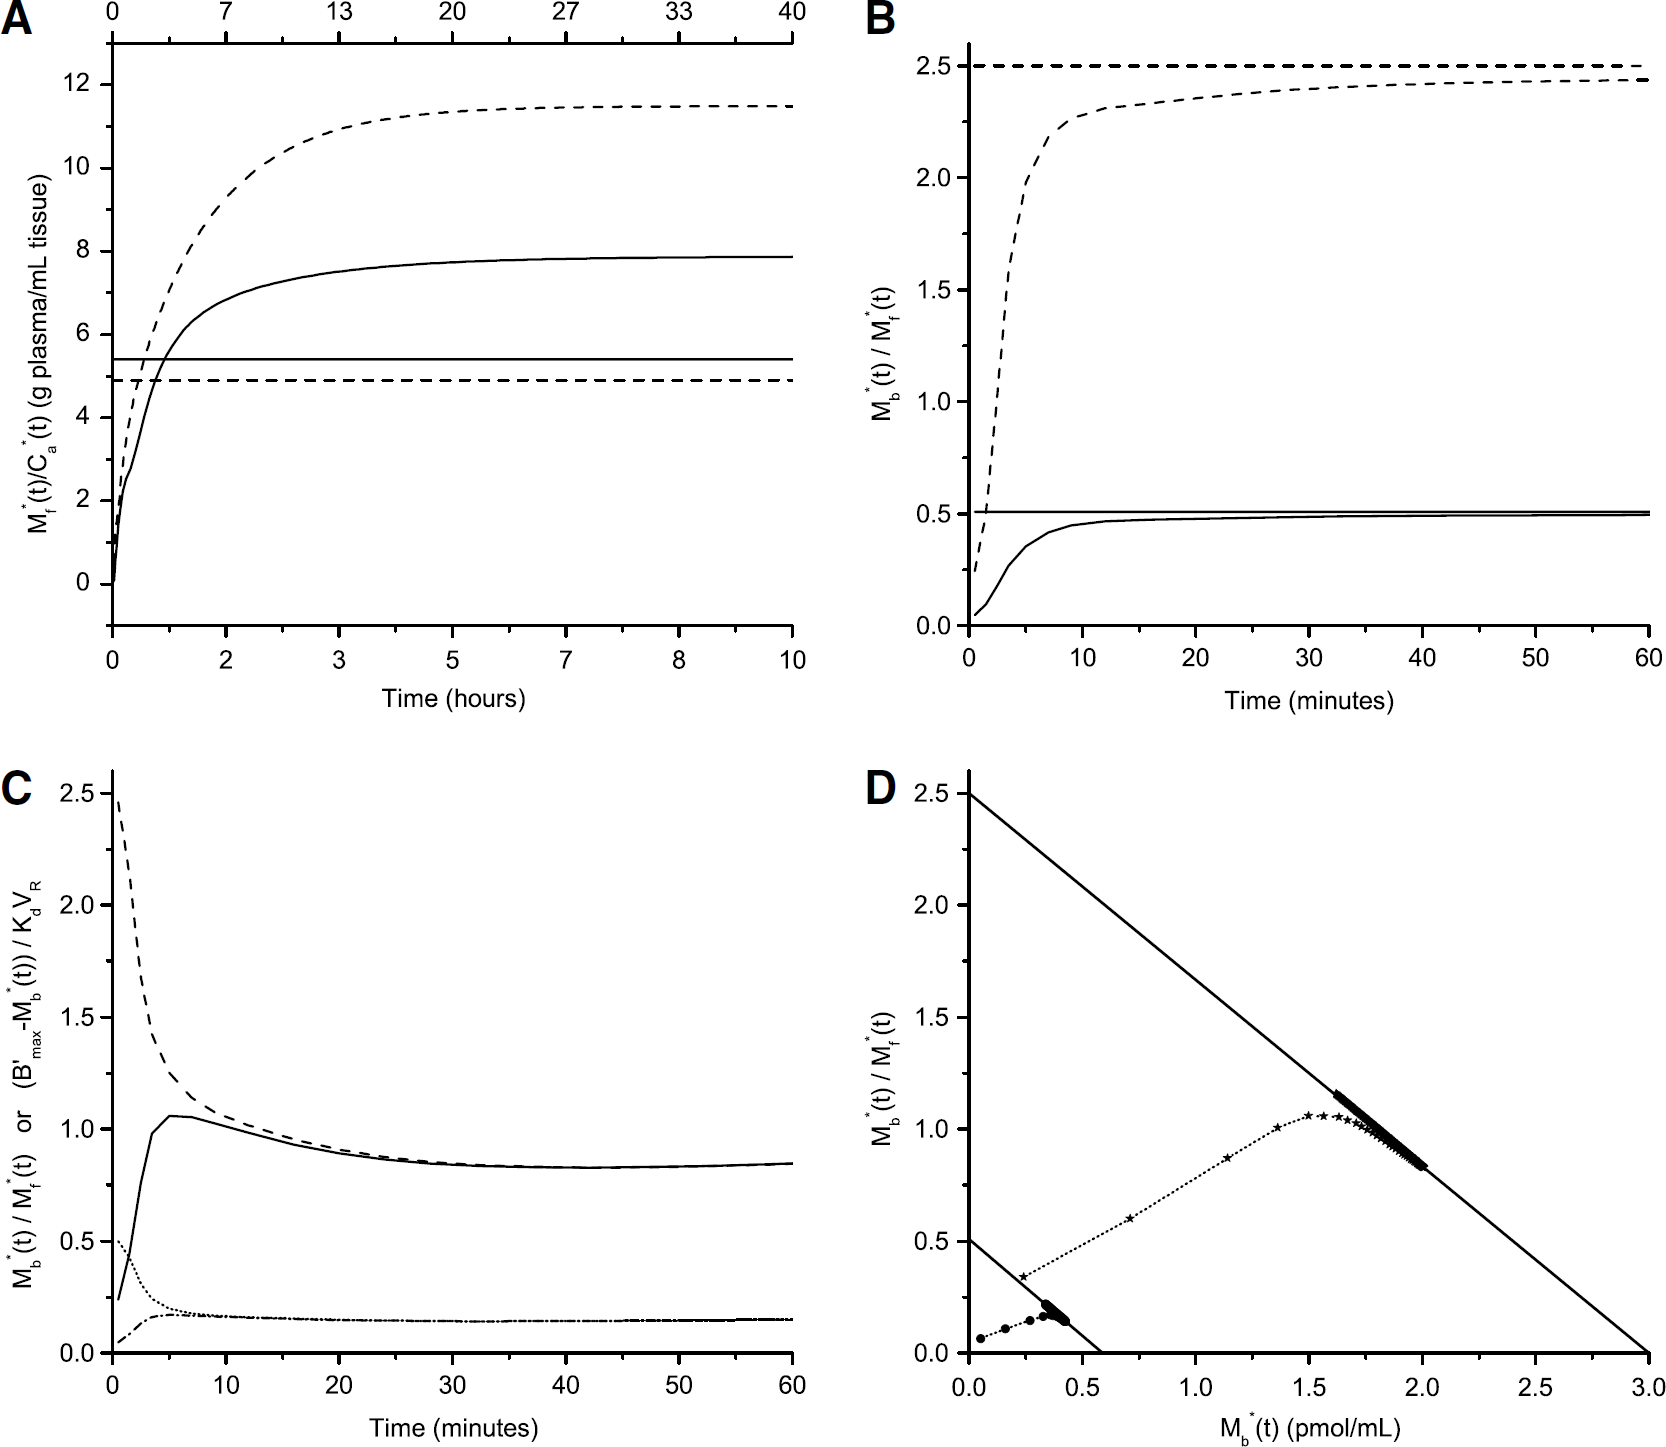
Study of the pseudo-equilibrium states in the thalamus and frontal cortex. Figures A and B show the pseudo-equilibrium states at tracer dose. In figures A and B, solid lines correspond to the frontal cortex and dashed lines to the thalamus. Horizontal lines represent the true equilibrium values. (
At tracer dose, in both the thalamus and the frontal cortex, the ratio M*f(t)/C*a(t) increases continuously for several hours and finally stabilizes (Figure 4A). The time needed for the ratio to reach 95% of its final value is 195 mins in the frontal cortex and 800 mins in the thalamus. For both regions, the final value of the ratio M*f(t)/C*a(t) overestimates DV1, In the frontal cortex, the final value of the ratio is 46% higher than DV1; in the thalamus it is 135% higher than DV1.
In contrast, the pseudo-equilibrium between the free and bound compartments is rapidly reached, in both regions, and in both tracer dose and partial saturation conditions. At tracer dose, the ratio M*b(t)/M*f(t) continuously increases and reaches 95% of its final value in 20 mins. Its final value is only 1% higher than the true binding potential BP (Figure 4B). In the simulation of a partial saturation injection, in both regions, the relative difference between the ratios M*b(t)/M*f(t) and (B'max-M*b(t))/KdVR decreases quickly: it is <5% after 8 mins. The relative difference stabilizes at 1% (Figure 4C).
Thus, in a plot of M*b(t)/M*f(t) versus A*b(t) (i.e., a Scatchard plot), data points match closely the theoretical Scatchard plot line from 10 mins after injection (Figure 4D).
Discussion
Experimental Protocol
The first aim of this study was to be able to quantify in vivo B'max in both the thalamus and, for the first time, extrathalamic regions.
In the multiinjection approach, several injections of labeled or unlabeled ligand are used to change the association probability, kon/VR (B'max–M*b(t)–Mb(t)), during the experimental time. The goal is to observe three phases: a phase with a low receptor occupancy (<20%), a partial saturation phase (50% to 70% of receptor occupancy), and a full saturation phase (receptor occupancy >90%).
Previous studies using 2-[18F]fluoro-A-85380 have shown that, after an injection of unlabeled ligand, the displacement of the labeled ligand is moderate in the extrathalamic ROIs (Valette et al, 1999b). To maximize the amplitude of this displacement, we chose to use a high mass of unlabeled ligand. This mass was set 2500 nmol (0.125 μmol/kg) because previous experiments have shown that this mass has no effect on physiologic parameters such as heart rate and arterial blood pressure (Valette et al, 1999b), and is sufficient to produce maximal displacements (unpublished data). However, because of the slow in vivo kinetics of 2-[18F]fluoro-A-85380, the receptor occupancy after the displacement injection was expected to remain too high to observe a partial saturation phase for several hours. Therefore, it was necessary to perform the displacement injection at the end of the experiment. Thus, the chosen protocol was naturally an ICoD protocol. This type of protocol has previously been used for other ligands with similar characteristics (i.e., very high affinity, low extrastriatal binding site density, slow kinetics), such as FLB 457 (Delforge et al, 1999).
The most critical part of the design of the ICoD protocol was the choice of the total mass of the partial saturation injection. This dose should be set to achieve a 50% to 70% occupancy of the binding sites in all ROIs. However, the ranges of receptor density and affinity were large (B'max ranged from 0.25 pmol/mL in the occipital cortex to 3.0 pmol/mL in the thalamus, Kd/VR ranged from 0.65 in the brain stem to 5.8 pmol/mL in the caudate nucleus), and thus the occupancy tends to be lower in the basal ganglia (high Kd/VR) and higher in the cortex and brain stem (low B'max and Kd/VR). The doses proposed in our protocol are valid because the achieved occupancy at the end of the partial saturation injection appears to be approximately 52% in the basal ganglia, 56% in the cerebellum, 69% in the thalamus, 72% to 76% in the cortex, 80% in the brain stem.
K1 Variations
It appeared necessary to use two different values of K1 to achieve a good quality of fit in the ICoD experiments. With this protocol, only two values of K1 may be estimated: one at 0 min and one at 90 mins, that is, the values of K1 at the time of each injection of labeled ligand. The way K1 varied between these two times had to be assumed. We chose to introduce in the model a simple stepwise change of K1. We also chose to set the time tc of the change to the time of the second injection of labeled ligand (90 mins, total dose 35 nmol), because we first hypothesized that the change could be due to the injection of a nontracer dose of ligand. However, the change may have occurred earlier, or could have been progressive, especially if the change is related to the time spent under anesthesia. Thus, we compared the results presented in Table 2, obtained with a stepwise change of K1 at 90 mins, to the results obtained with a linear increase of K1 between 0 and 90 mins. Most parameters are not significantly affected by the choice of the way K1 is allowed to change. Only KdVR is moderately higher when K1 is increased progressively between 0 and 90 mins rather than suddenly at 90 mins. The maximal difference was 6.2% for experiment 1.
In the IDI protocol, in a similar way, the change could only be detected at 120 mins. This is the time of the third injection, but it is only the second injection of labeled ligand. However, tc was set at 60 mins, the time of the second ligand injection, because this is the first nontracer injection (2500 nmol of unlabeled ligand).
For tracers that cross the blood—brain barrier by passive diffusion, the two main physiologic parameters related to K1 are the regional cerebral blood flow and the blood—brain barrier permeability. An increase of any of these two physiologic parameters could explain the observed increases of K1. Because 2-fluoro-A-85380 is a nicotinic agonist, it may mimic the effects of nicotine, which can increase both blood flow (Crystal et al, 1983; Linville et al, 1993; Uchida et al, 1997) and blood—brain barrier permeability (Abbruscato et al, 2002; Hawkins et al, 2004, 2005). Alternatively, anesthesia can also affect both blood flow (Boarini et al, 1984; McPherson et al, 1994) and blood—brain barrier permeability (Saija et al, 1989; Chi et al, 1992). It is not possible to discriminate from the presented data the mechanism responsible for the variation of K1. One argument in favor of the dose-related mechanism is that the same anesthesia has been used in several multiinjections studies with different radioligands without any apparent variations of K1. However, the findings of this study may also be due to the high sensitivity of 2-[18F]fluoro-A-85380 brain time-concentration curves to K1 and k2 (detailed in the ‘Study of equilibrium states and applications to simple protocols’ section). Indeed, for a radioligand with faster kinetics (i.e., a radioligand reaching more quickly a pseudo-equilibrium state between the free and plasma compartments) a 20% increase of K1 and k2 may not lead to a significant lack of fit, and thus may be undetected.
A change in cerebral blood flow is expected to modify both K1 and k2, whereas distribution volumes remain constant, as seen for [11C]flumazenil (Holthoff et al, 1991) or [11C]nicotine (Muzic et al, 1998). In contrast, after induction of a decrease in cerebral blood flow induced by hypocapnia in one subject, Logan et al (1994) have observed a decrease in both K1 and distribution volume values with [11C]raclopride. That is, a more important decrease in K1 than k2. However, in the extensive theoretical work in the latter study, no modeling of the exchanges between the plasma and the tissue could explain the differential sensitivity of K1 and k2 to blood flow, and the authors assumed that the observed results were due to other putative physiologic effects (changes in endogenous dopamine levels or in plasma pH) possibly induced by hypocapnia. In this study, the baboons were maintained in normocapnic conditions (pCO2 38 to 42 mm Hg during all the experiments). Therefore, in the model both K1 and k2 were allowed to vary, but not DV1.
Parameters Values
The use of the multiinjection approach allowed estimating B'max in the extrathalamic ROIs in vivo for the first time. In the thalamus, B'max has been estimated previously in vivo by Chefer et al (2000) to be 5.5 pmol/mL in rhesus monkeys, using 2-[18F]fluoro-A-85380 and the multiexperiment Scatchard analysis originally proposed by Farde et al (1986). The present value (3.0 ± 0.3 pmol/mL) is lower, but of the same order of magnitude. It is not possible to directly compare the two methodologies, because the multiexperiment Scatchard analysis cannot be applied to quantify B'max in baboons. Indeed, the cerebellum cannot be used as a reference region to estimate the concentration of free ligand in the thalamus in this species. First, there is a nonnegligible specific binding in the cerebellum. Second, the free compartment distribution volumes DV1 in the thalamus and cerebellum are not equal. Indeed, DV1 is slightly higher in the thalamus than in the cerebellum: the relative difference is 16 ± 6% (P <0.01, paired Student's t-test, n = 5).
In contrast, more in vitro measurements of nicotinic receptor densities are available. However, comparison of the absolute values is not straightforward owing to differences in species, radioligands, and methods of measurement (binding or autoradiography). In humans, using 5-[125I]iodo-A-85380, B'max has been estimated to 1.5 pmol/g of tissue in the thalamus, 0.56 pmol/g of tissue in the putamen and 0.45 pmol/g of tissue in the cortex (Pimlott et al, 2004). In rats, [3H]epibatidine binding site densities range between 2.6 pmol/g of tissue in the cortex and 4.1 pmol/g of tissue in the thalamus (Houghtling et al, 1994). The present B'max estimates (3.03 pmol/mL in the thalamus, 1.37 pmol/mL in the putamen, 0.25 to 0.59 pmol/mL in the cortex) are thus compatible with these studies.
The relative regional distribution of nicotinic densities can be more easily compared: most studies (including the present one) showed higher densities in the thalamus; intermediate densities in the basal ganglia; and lower densities in the cortex (Adem et al, 1987; Houghtling et al, 1994; Marutle et al, 1998; Kulak et al, 2002; Pimlott et al, 2004). The relative density of binding sites found in the cerebellum is more variable. In many studies, the cerebellum displayed the lowest density (Kulak et al, 2002; Martin-Ruiz et al, 2004; Houghtling et al, 1994). However in some human studies, using [3H]nicotine or [3H]epibatidine, the density of binding sites in the cerebellum was higher than the one measured in the cortex (Adem et al, 1989; Marutle et al, 1998), as seen in this study. This is partly due to interspecies differences, nicotinic receptor density being relatively low in the cerebellum of rat, and relatively high in the cerebellum of human and some other primates. This can also be due to differences in the precise localization of the ROI inside the anatomic structure. In this study, the ROI was drawn in the upper part of the cerebellum, the one with the highest radioactivity concentration, to maximize the signal-to-noise ratio. This may have increased the B'max values.
Our koff estimates (0.33 ± 0.07 min−1) are in good accordance with the values measured in vitro in rats at 37°C: 0.3 min-1 (Pavlova et al, 2000; Hassoun et al, 2004). KdVR estimates (range 0.65 to 6.0 nmol/L) are higher than Kd values measured in vitro at 37°C on whole rat brain membrane preparations: 0.145 nmol/L (Pavlova et al, 2000), 0.35 nmol/L (Hassoun et al, 2004). If this difference between the Kd values measured in vitro and the present KdVR estimates is only due to the volume of reaction concept (Delforge et al, 1996), then VR should be high (>3mL/mL). This is consistent with the high DV1 values, because these two parameters tend to be correlated (Delforge et al, 1996). The simplest mechanism that could explain both the high KdVR and DV1 values is a high level of nonspecific binding in the brain, resulting in a low fraction of effectively free ligand in the free compartment (f2; Mintun et al, 1984). It should also be noted that these high DV1 (and putatively VR) values are somehow surprising, because 2-[18F]fluoro-A-85380 has a low lipophilicity. Indeed, the logarithm of the octanol-water partition coefficient (log P) measured at pH 7.4 is −1.05 for 2-[18F]fluoro-A-85380 (Bottlaender et al, 2003). A low lipophilicity tends to be associated with a low nonspecific binding in the brain (Waterhouse, 2003) and a low VR (Delforge et al, 1996). But this trend is not universal, and in particular does not seem to apply well to 2-[18F]fluoro-A-85380.
Finally, 2-[18F]fluoro-A-85380 K1 and especially k2 values are low (ranges: 0.11 to 0.18 g/minmL and 0.018 to 0.041min−1, respectively). The low K1 values cannot be attributed to binding to plasma protein, because 2-[18F]fluoro-A-85380 free fraction in plasma is high (77%, Chefer et al, 2003). This is more likely due to 2-[18F]fluoro-A-85380 low lipophilicity. Conversely, because k2 values are substantially lower than K1 values, the low k2 values may be partly due to nonspecific binding in brain tissue, in addition to the low lipophilicity of 2-[18F]fluoro-A-85380.
Concerning the regional distribution of the parameters, it can be noted that the distribution volume of the free compartment, DV1, is not uniform across brain regions. As previously noted, DV1 is slightly higher in the thalamus than in the cerebellum (relative difference 16 ± 6%). The difference is higher while comparing the cortex, or the basal ganglia, to the cerebellum. For example, DV1 is 28 ± 5% higher in the frontal cortex, and 53 ± 4% higher in the putamen, than in the cerebellum. This nonuniform DV1 is clearly a disadvantage for the application of simplified methods to quantify 2-[18F]fluoro-A-85380 binding, especially for methods relying on the reference region concept. This issue has already been reported for other radioligands (Logan et al, 2005). Concerning 2-[18F]fluoro-A-85380, the implication of this finding to human studies is however unclear, because this phenomenon was not seen in rhesus monkeys (Chefer et al, 2003).
Study of Equilibrium States and Applications to Simple Protocols
It is worth noticing that the slow kinetics of 2-[18F]fluoro-A-85380 is not directly due to its high affinity. As stated by Sihver et al (2000), the affinity of a ligand and the time needed to reach equilibrium are not necessarily linked. In vitro affinity is expressed by koff/kon, and the time needed to reach equilibrium is linked to koff only (at tracer dose). Owing to 2-[18F]fluoro-A-85380 high koff value at 37°C (0.3 min−1, Pavlova et al, 2000; Hassoun et al, 2004), equilibrium is rapidly reached during in vitro binding experiments. Other in vivo factors are involved, such as the rate of efflux rate from the free compartment (k2), the arterial plasma kinetics, or the nonspecific binding.
Simulations showed that at nontracer doses the pseudo Scatchard equilibrium is quickly reached (10 mins). Similarly, the pseudo-equilibrium between the free and specifically bound compartments is also quickly reached at tracer dose (20 mins). And then the final value of the ratio M*b(t)/M*f(t) is close to its true equilibrium value, the binding potential BP. Conversely, the pseudo-equilibrium between the arterial plasma compartment and the free compartment is achieved at much latter times. In the frontal cortex, the pseudo-equilibrium is reached after approximately 3 h. In the thalamus, the pseudo-equilibrium time obtained in our simulations (800 mins) is too late to be reached in an actual experiment. Moreover, the ratio of ligand concentrations in the free and arterial plasma compartments does not match the true equilibrium value DV1.
Another way to evaluate the final values of the ratios M*f(t)/C*a(t) and M*b(t)/M*f(t) is to use asymptotic expressions. These expressions cannot provide estimations of the pseudo-equilibrium time as simulations do, but they can give readily explanations for the final value of the ratios. These analytical expressions can be computed only at tracer dose. However, this situation can be considered as the worst-case scenario, because the kinetics is then the slowest. At tracer dose, the concentrations in the two tissue compartments are given by the following equations:


with macroparameters
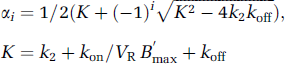
and
Because Eqs. 2 and 3 contain a convolution product with the arterial input function C*a(t), an approximation must be made to simplify these equations. At late times, C*a(t) could be approximated by a single exponential function A exp(–βt). Then, M*f(t) and M*b(t) can be expressed as a sum of three decreasing exponential functions with exponential rates β, α1, and α2. A necessary condition for the system to reach a pseudo-equilibrium state between the arterial plasma and free compartments is that β must be lower than α1. In this study, the lowest coefficient α1 was the one of thalamus: 0.0086 min−1. And because the value of β was 0.005 min−1, the condition was fulfilled. Then, the ratio M*f(t)/C*a(t) tends to:
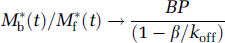
Under the same hypotheses, the ratio M*b(t)/M*f(t) tends toward the following value:
And thus the ratio M*b(t)/C*b(t) tends to (Carson et al, 1993):
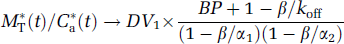
These relations can also be deduced from equations B3 and B4, in the article by Logan et al (1990).
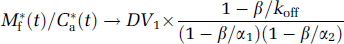
Eq. 7 shows that the final value of the ratio M*b(t)/M*f(t) equals the binding potential, because of the high koff value and the relatively slow variations of 2-[18F]fluoro-A-85380 concentration in the arterial plasma compartment (β ≪ koff).
In contrast, Eq. 6 shows that the ratio M*f(t)/C*a(t) does not match the DV1 value because the condition β ≪ α1 is not fulfilled: the value of β was 0.005 min−1, whereas the values of α1 were (only) 0.0086 and 0.016 min−1 in the thalamus and frontal cortex, respectively. For 2-[18F]fluoro-A-85380, because β ≪ koff and β ≪ α2 (minimum value 0.37 min−1 for all ROIs and experiments), the two other error factors are negligible and Eqs. 6 and 8 can be simplified (Carson et al, 1993):


where DVT is the true total distribution volume of the ligand.
It is worth noticing that, because koff ≫ k2, α1 approximately equals to k2/(1 + B'max/KdVR) (Logan et al, 1990). This latter value corresponds to k“2 in the one-tissue compartment model (Koeppe et al, 1991), and thus represents the overall clearance rate of 2-[18F]fluoro-A-85380 from the brain tissue. This expression shows that it is the low k2 value (and the relatively high BP value for the thalamus), which is responsible for the mismatch between the final value of the ratio M*f(t)/C*a(t) and the value of DV1.
Another negative consequence of the late pseudo-equilibrium between the plasma and free compartments is that the shape of the time-concentration curves is quite sensitive to k”2. For example, in experiment 4, the kinetics in the thalamus was faster (with an ‘early’ maximum at 55 mins), and that can be linked to a higher k“2 value (0.0135 versus 0.0081 ± 0.0009 min−1 in the other ICoD experiments). This high k”2 value can be itself linked to the highest KdVR value listed in Table 2. Another example is the variations of K1 reported in this study. Because the shape of the time-concentration curves is sensitive to both K1 and k2, and not only K1/k2, during the whole 80 to 180 mins after each injection of 2-[18F]fluoro-A-85380, small variations of K1 could have a impact on the quality of fit, especially in a multiinjection protocol. Thus, from a quality of fit point of view, a faster ligand may be less sensitive to variations of K1. However, such variations could still bias the estimated parameters, even though the quality of fit would be acceptable with a faster ligand. From this parameter estimation point of view, it is not possible to state if a faster ligand (i.e., with an higher k2) would be less or more sensitive to variations of K1. This would highly depend on the other properties of the ligand (i.e., its DV, BP, koff, and the shape of the input function) as well as the experimental protocol and data analysis employed, at least for all protocols based on some type of kinetic analysis (e.g., compartmental modeling or graphical analysis). However, a faster radioligand would make studies at equilibrium with a bolus plus infusion protocol more practical than with 2-[18F]fluoro-A-85380. And this type of protocol may be less sensitive to the type of variation of K1 we introduced in our model.
In conclusion, the pseudo-equilibrium between the arterial plasma and free compartments cannot be reached in practice in the thalamus, and is biased in receptor poor ROIs. Methods that use a late tissue-to-plasma ratio after a bolus injection of 2-[18F]fluoro-A-85380 are expected to provide overestimated distribution volumes. Conversely, because of the rapid pseudo-equilibrium between the two tissue compartments, kinetic analysis or Logan graphical analysis (Logan et al, 1990) should be suitable to estimate distribution volumes of 2-[18F]fluoro-A-85380.
The rapid pseudo Scatchard equilibrium at nontracer doses is also favorable for the design of simplified protocols to estimate the density of binding sites without blood sampling, if a robust method to separate the free and bound ligand without kinetic analysis can be found for this ligand.
Conclusion
This study shows that it is possible to estimate in vivo nicotinic receptors binding site density, B'max, and ligand affinity, KdVR, using 2-[18F]fluoro-A-85380 and the multiinjection approach, in a single experiment. Precise estimates could be obtained in the thalamus, and, for the first time in vivo, in some cortices (frontal and temporal), cerebellum, and brain stem and putamen. In the regions with the lowest specific binding (parietal and occipital cortices, caudate nucleus), the estimates were less precise. The low-specific binding may be attributed to high KdVR values (caudate nucleus) or low receptor density (parietal and occipital cortices).
The kinetic properties of 2-fluoro-A-85380 required the use of two protocols to identify all the parameters. Indeed, the association and dissociation rate constants, kon/VR and koff, could not be estimated with the first experimental protocol, although their ratio, KdVR, could. This is mainly due to the relative high koff values, compared with the values of the efflux rate from the free compartment to the plasma (k2) that made the identification of koff, and subsequently kon/VR, more challenging. The koff estimates obtained using the two experimental protocols were close to in vitro values. Moreover, koff can be set to an a priori value with only a moderate impact on the others parameters, kon/VR excepted. Thus, the first protocol may be used alone in future studies in which precise koff or kon/VR estimates are not required.
This study also shows that 2-fluoro-A-85380 slow kinetics is mainly due to the slow efflux from the free compartment to the plasma (low k2 values). It is likely because an important fraction of the ligand in the free compartment is actually nonspecifically bound. As a consequence, the free compartment represents most of the signal measured by PET, excepted in the thalamus at tracer dose. Additionally, at the pseudo-equilibrium achieved after a (bolus) tracer dose injection, the concentration in the free compartment is higher than the true equilibrium value. Therefore, methods using late tissue-to-plasma ratio values as an index of total distribution volume are expected to be biased.
Conversely, methods relying on the achievement of the pseudo-equilibrium between the bound and free compartments, such as Logan graphical analysis, are expected to provide accurate distribution volume values.
Footnotes
Acknowledgements
This research was supported by grant from ‘Canceropole, Ile-de-France, projet PL026′.