
Abstract
The selectivity of [18F]MPPF (fluorine-18-labeled 4-(2' -methoxyphenyl)-1-[2' -(N-2“-pirydynyl)-p-fluorobenzamido]ethylpiperazine) for serotonergic 5-hydroxytryptamine(1A) (5-HT1A) receptors has been established in animals and humans. The authors quantified the parameters of ligand-receptor exchanges using a double-injection protocol. After injection of a tracer and a coinjection dose of [18F]MPPF, dynamic positron emission tomography (PET) data were acquired during a 160-minute session in five healthy males. These PET and magnetic resonance imaging data were coregistered for anatomical identification. A three-compartment model was used to determine six parameters: Fv (vascular fraction), K1, k2 (plasma/free compartment exchange rate), koff, kon/Vr (association and dissociation rate), Bmax (receptor concentration), and to deduce Kd (apparent equilibrium dissociation rate). The model was fitted with regional PET kinetics and arterial input function corrected for metabolites. Analytical distribution volume and binding potential were compared with indices generated by Logan-Patlak graphical analysis. The 5HT1A specificity for MPPF was evidenced. A Bmax of 2.9 pmol/mL and a Kd of 2.8 nmol/L were found in hippocampal regions, Kd and distribution volume in the free compartment were regionally stable, and the Logan binding potential was linearly correlated to Bmax. This study confirms the value of MPPF in the investigation of normal and pathologic systems involving the limbic network and 5-HT1A receptors. Standard values can be used for the simulation of simplified protocols.
Serotonin is involved in the neuromodulation and neurotransmission of the mammalian nervous system and can modify a large variety of physiologic responses through multiple subtypes of receptors. Among the 17 subtypes of receptors identified to date, 5-hydroxytryptamine(1A) (5-HT1A) is currently the most studied (Peroutka, 1995).
The involvement of 5-HT1A serotonergic receptors in neurophysiologic and psychiatric disorders has been revealed in both the animal and human brain by autoradiographic postmortem studies. Abnormalities in 5-HT1A receptor densities were found in the brains of patients with depression, dementia, and schizophrenia (Cowen, 2000). In addition, serotonin implication in epileptic seizure control via the 5-HT1A receptors has been evidenced in rats (Statnick et al., 1996; Wada et al., 1997). Moreover, abnormal serotonin concentrations were found ex vivo in resected samples of cortex in epileptic patients (Louw et al., 1989; Pintor et al., 1990), and a decrease of 5-HT synthesis in epileptic areas was evidenced in vivo by PET using [18F]AMT (Chugani et al., 1998).
Using positron emission tomography (PET), several carbonyl and fluoryl radioligands have been developed recently that allow for the in vivo quantification of 5-HT1A receptors (Cliffe, 2000). [11C]N(2-(4-(2-methoxyphenyl)-1-piperazinyl)ethyl)-N-(2-pirydynyl) cyclohexanecarboxamide ([11C]WAY 100635) is an antagonist of the 5-HT1A receptors. Delineation (Pike et al., 1995; Pike et al., 1996) and quantification (Farde et al., 1998; Gunn et al., 1998) studies showed a specificity and high affinity of [11C]WAY 100635 for 5-HT1A receptors. These studies confirmed that 5-HT1A receptors are located mainly in the limbic system, but are also present in the entorhinal and cingular cortex. However, WAY 100635 presents a much higher affinity (0.8 nmol/L) than serotonin to its own 5-HT1A receptors (Ki = 4.7 nmol/L). Consequently, recent studies suggest that this ligand may not be the most suitable tool to study endogenous variations of serotonin concentration (Hume et al., 2001). The radiosynthesis of another PET tracer antagonist to the 5-HT1A, 4-(2'-methoxyphenyl)-1-[2'-(N-2'-pirydynyl)-p-fluorobenzamido]ethylpiperazine (MPPF), was recently optimized and simplified (Le Bars et al., 1998). This tracer is an analogue of WAY 100635, labeled with fluorine-18 ([18F]MPPF). In vivo and ex vivo distribution studies in the rat (Plenevaux et al., 2000b) and cat brain (Ginovart et al., 2000; Le Bars et al., 1998) confirmed a selective binding of the molecule in cerebral regions rich in 5-HT1A receptors such as the dorsal raphe nuclei, hippocampus, cingular gyrus, or septum, and with less intensity in the neocortex (Plenevaux et al., 2000a). An initial examination of [18F]MPPF in healthy human volunteers showed a similar distribution (Passchier et al., 2000a). A recent analysis performed with a simplified method (quantification of binding relative to a reference tissue region) showed a good cerebellum-to-target-region ratio. This magnitude decreased by 40% after a blocking dose of pindolol, a competitive antagonist of 5-HT1A receptors (Passchier et al., 2000b). These preliminary results, together with the longer half-life of F compared with [11C] WAY 100635 and the lower affinity of MPPF for 5-HT1A receptors (Ki = 3.3 nmol/L; Zhuang et al., 1994), emphasize the potential use of this ligand as a radiopharmaceutical for quantitative studies of the serotonergic 5-HT1A system in vivo.
The aim of the present study was to perform a complete modeling of the in vivo kinetics of [18F]MPPF, including parameter estimation of (1) the transport from plasma to tissue, and (2) the specific binding of the ligand to the 5-HT1A receptors. We used a multiple-injection protocol (Delforge et al., 1990) to estimate six parameters (vascular fraction, exchange rates, and receptor density) that in return were used to validate simplified quantitative methods.
MATERIALS AND METHODS
[18F]MPPF synthesis
[18F]MPPF was obtained by nucleophilic fluoration on a nitro precursor with a radiochemical yield of 20% to 25% EOS and a specific activity of 37 to 111 GBq/μmol. (Le Bars et al., 1998; Le Bars et al., 2001).
Experimental protocol
Subjects
Five healthy male volunteers (21-30 years) participated in the study. A medical interview and the inspection of the anatomical T1 magnetic resonance (MR) image revealed that none of subjects had psychiatric or neurological illnesses. Subjects gave their informed consent to the protocol approved by the local ethical committee in accordance with the declaration of Helsinki. Subject's participation involved an MR imaging and a PET session.
Magnetic resonance imaging session
The MR imaging acquisition consisted of a three-dimensional anatomical T1-weighted sequence on a 1.5-T Siemens Magnetom scanner (Siemens AG, Erlangen, Germany). The anatomical volume covered the whole brain with millimeter cubic voxels.
Positron emission tomography session
The PET session was performed on a CTI-Siemens HR+ (Knoxville, TN, U.S.A.) during the afternoon. Before the session, subjects received 330 mL water and a standardized meal (prepared by a dietetics unit) to normalize dietary input before the PET examination, and then were laid supine on the bed of the PET scanner. For blood sampling, a catheter was placed in the radial artery of the right arm using local anesthesia. For tracer injections, a second intravenous catheter was placed in radial vein of the left arm. For each subject a thermoformable head holder was molded to limit head movements during acquisition. Subjects were positioned in the PET scanner so that the crossed laser beam delimiting the axial field of view (15.2 cm) covered the brain. Before emission acquisition, a 10-minute transmission scan was performed using three 68Ge rod sources for the measurement of tissue and head support attenuation.
Multiinjection protocol consisted of two [18F]MPPF bolus injections of 185 ± 9 MBq. The injections were performed at a mean interval of 88.5 ± 4.2 minutes. At time zero, the synthesis of [18F]MPPF was calibrated to a mean specific activity of 37 GBq/μmol. The first syringe contained a tracer dose of [18F]MPPF, whereas the second syringe was prepared by dilution with unlabeled MPPF to obtain a 10-times lower specific activity 80 minutes later (see Table 1 for details regarding concentrations and timing).
Numerical value of the experimental positron emission tomography multiinjection protocol parameters
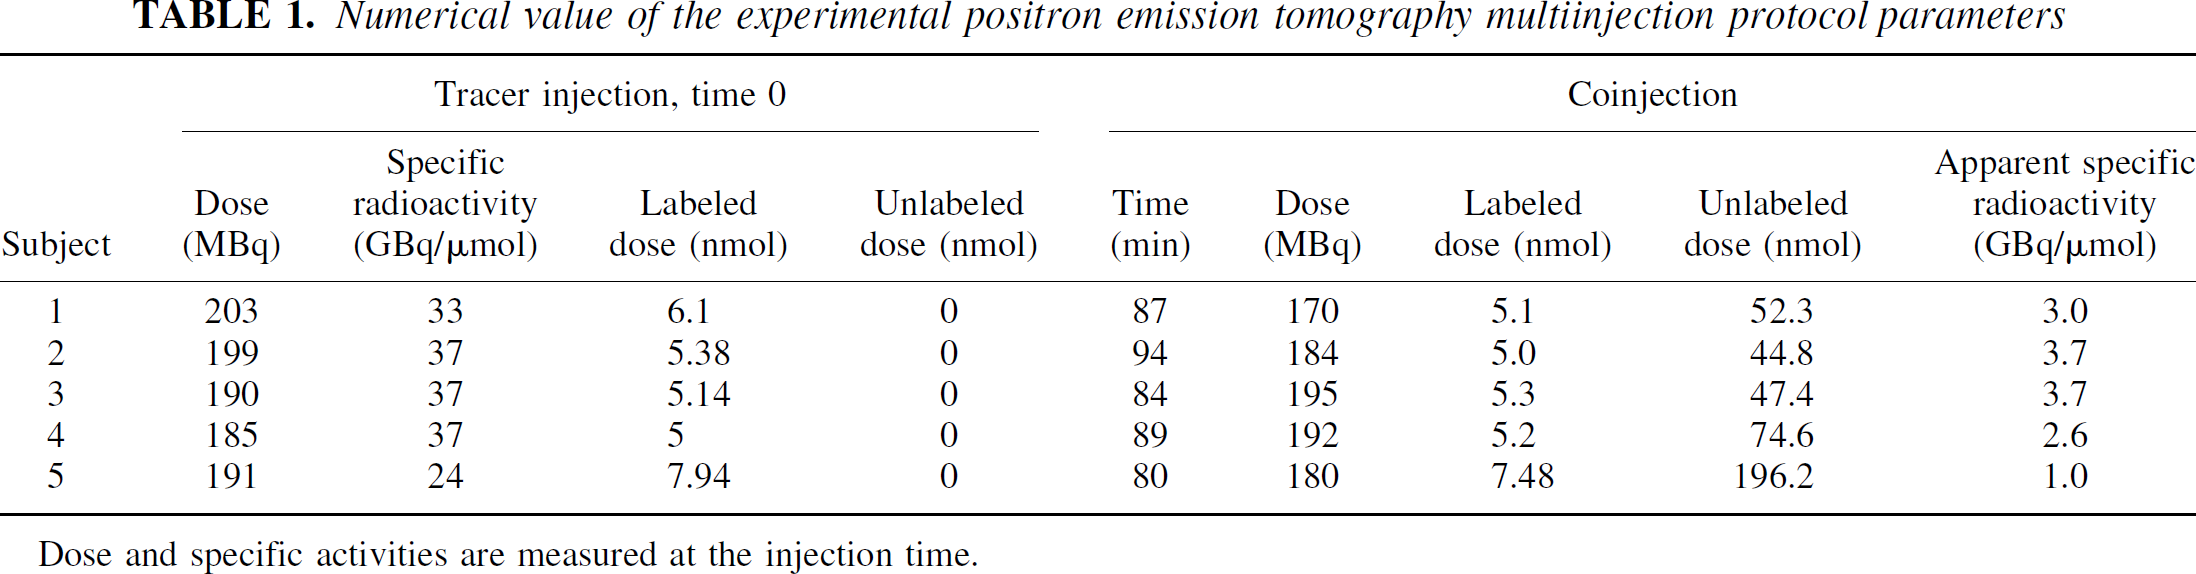
Dose and specific activities are measured at the injection time.
Two dynamic PET scans of emission were acquired to evaluate the local radiotracer concentration during the 70-minute period after each injection. Dynamic scans comprised 37 frames of increasing duration (20 seconds to 5 minutes), and a total of 74 frames were analyzed. The PET scanner was operating in three-dimensional mode. Images were corrected for scatter and attenuation and were reconstructed using a filtered back projection (Hamming filter of cut-off 0.5 cycles/pixels) to provide a three-dimensional volume comprising 63 slices (2.42-mm thickness), with 128 × 128 voxels in plane (2.06 × 2.06 mm). In the center of the field of view, National Electrical Manufacturers Association protocol measured an nominal axial resolution of 4.1 mm and a nominal transverse resolution of 4.4 mm for a point source reconstruct with ramp filter (Brix et al., 1997).
Throughout the experiment, arterial blood samples were collected at different intervals after injection (12 × 15, 3 × 30, and 6 × 60 seconds, and 6 × 5 minutes). In general, 0.7 mL blood was withdrawn except at 2, 5 10, 15, 20, 30, 40, 60, or 70 minutes after injection, at which time 2.5 mL blood was collected to measure metabolite concentration. Blood samples were rapidly centrifuged, and the plasma was separated and assessed for radioactivity with an automated γ counter. In parallel, a plasma aliquot was denatured by acetonitrile containing a carrier amount of cold MPPF. Analytical high-pressure liquid chromatography was then performed on samples with radioactivity counting of the collected fractions.
Data analysis
Arterial function analysis
After correction for the decay of 18F, time-activity curves of total blood and plasma were extracted and converted to time-concentration curves indicating the specific radioactivity of [18F]MPPF. We evaluated the fraction in the plasma curve of nonmetabolized MPPF at different sampling times. The mean curve of the data regarding our five subjects was fitted in a least-square sense to a biexponential function (Levenberg-Marquardt method). For each subject we obtained the input function of the ligand in the vascular network by multiplying the time-concentration curves of plasma by the fitted unmetabolized fraction of [18F]MPPF.
Image processing
From two dynamic acquisitions of 37 frames, we computed a static image of equilibrium from 20 to 70 minutes after injection. To correct for possible head movements, these static images were taken as reference for an automatic linear spatial alignment (Automated Image Registration package; Woods et al., 1992) of the two dynamic acquisitions. Subsequently, the bihippocampal plane was defined on the mean image of the aligned dynamics to reslice acquisitions in hippocampal orientation. The same transformation matrix was applied to the dynamic data set. Similarly, transverse MR images were reoriented in the hippocampal plane coregistered with the mean PET by means of AIR (Woods et al., 1993) and resliced with same sampling as the PET data. This image preprocessing resulted in a complete data set (anatomic MR imaging, and dynamic PET) with common orientation and size.
After registering these MR imaging data, we drew 27 volumes of interest using a contour tool (CAPP; CTI-Siemens). For each region the time-activity mean curves were extracted and converted into time-concentration curves. Volumes of interest were drawn in the cerebellum, pons, in the left and right cortical regions (occipital, temporal, prefrontal, inferior parietal, anterior cingulum, insula, temporal pole, and entorhinal), in the left and right amygdala, hippocampus, parahippocampus, and in the raphe nuclei, longitudinal sinus, and in a intensely labeled region in the posterior part of scalp. For the raphe nuclei, which are difficult to delineate on MR images, the contours were first drawn on the averaged PET image and then displayed on the subject's MR image to verify their proper location in the periaqueducal gray matter of the cerebral trunk. Volumes of interest ranged from 0.37 cm3 for the raphe nuclei to 15 cm3 for the volume of interest traced in the temporal neocortex.
Compartmental model and tracer kinetics analysis
A three-compartment model was applied to quantify the exchanges of MPPF between vascular networks, tissues, and 5-HT1 receptors (Fig. 1; Appendix A).
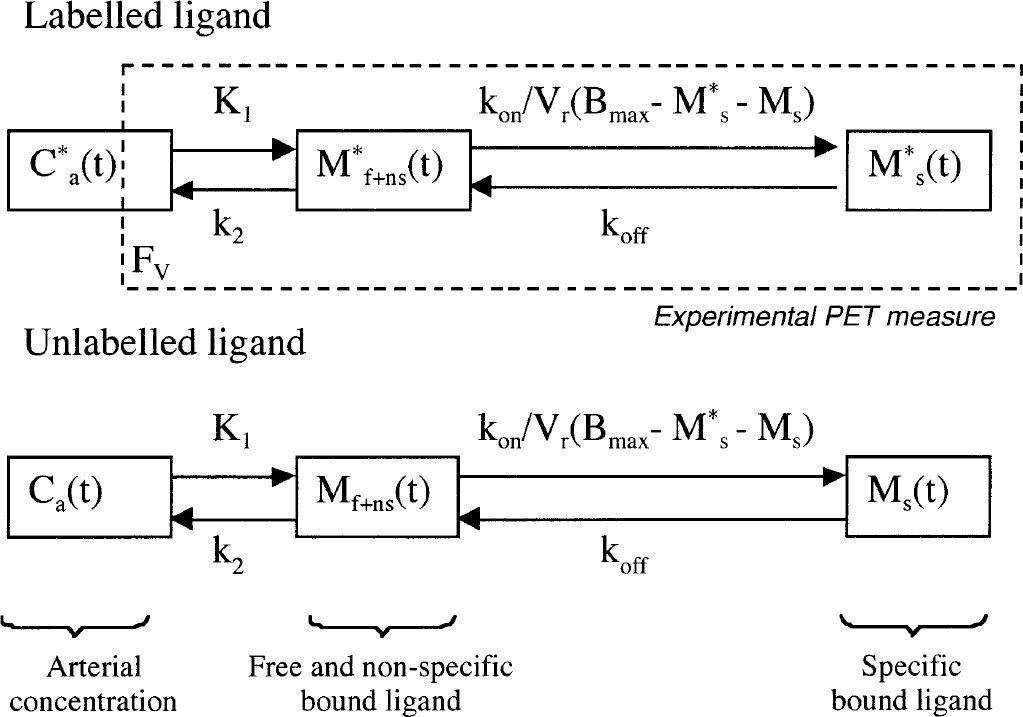
Three-compartment ligand-receptor model adapted from Delforge et al., (1990). Exchange rates are linear, except for the specific binding rate, which is related to the bimolecular association constant kon and to the available receptor site concentration (Bmax minus labeled and unlabeled specifically bound ligand). The positron emission tomography experimental measures are the sum of labeled ligand concentration in the free and nonspecific compartment, and in the specific compartment plus the Fv fraction of arterial concentration in labeled MPPF.
From this model we applied two different approaches to estimate the 5-HT1A receptor binding (Appendix B). We performed (1) a complete nonlinear (CNL) resolution of the model with the arterial blood sample as input function and regional PET kinetics, where the six unknown parameters (K1, k2, kon/Vr, koff, Bmax, and Fv) were identified by minimization of a weighted least-square method (CNL method); and (2) a graphical projection of the kinetics based on the Logan-Patlak plot (Logan method; Delforge et al., 1995; Logan et al., 1990), which determines the total distribution volume (DV) in a region (VtL). The relations between solved parameters of the CNL method and graphically estimated parameters of the Logan method are established in Appendix C. From the parametric results of the CNL method, analytical values for V2, V3, Vt, BP, and BPLanalytic were computed and compared with the graphical values obtained from plot of the Logan method (VtL and BPL). The differences in regional distribution of model parameters and indices were evaluated with an analysis of variance. A significant threshold was set at 0.001. A Bonferroni correction was applied in case of multiple comparisons of nonindependent data.
RESULTS
Arterial concentration
The analysis of arterial concentrations of [18F]MPPF and its metabolites revealed a rapid metabolization of the ligand (Fig. 2); within 10 minutes, 86% of the arterial MPPF was converted to one principal polar metabolite as measured by high-pressure liquid chromatography. The experimental arterial function was reproducible between subjects and between injections. The percentage of metabolized [18 F]MPPF over time followed the equation Pmetab(tmin < 2) = 1, and Pmetab(tmin > 2) = 1.79e−0.40 t+0.13e−0.03 t with a standard error fit of 8%.
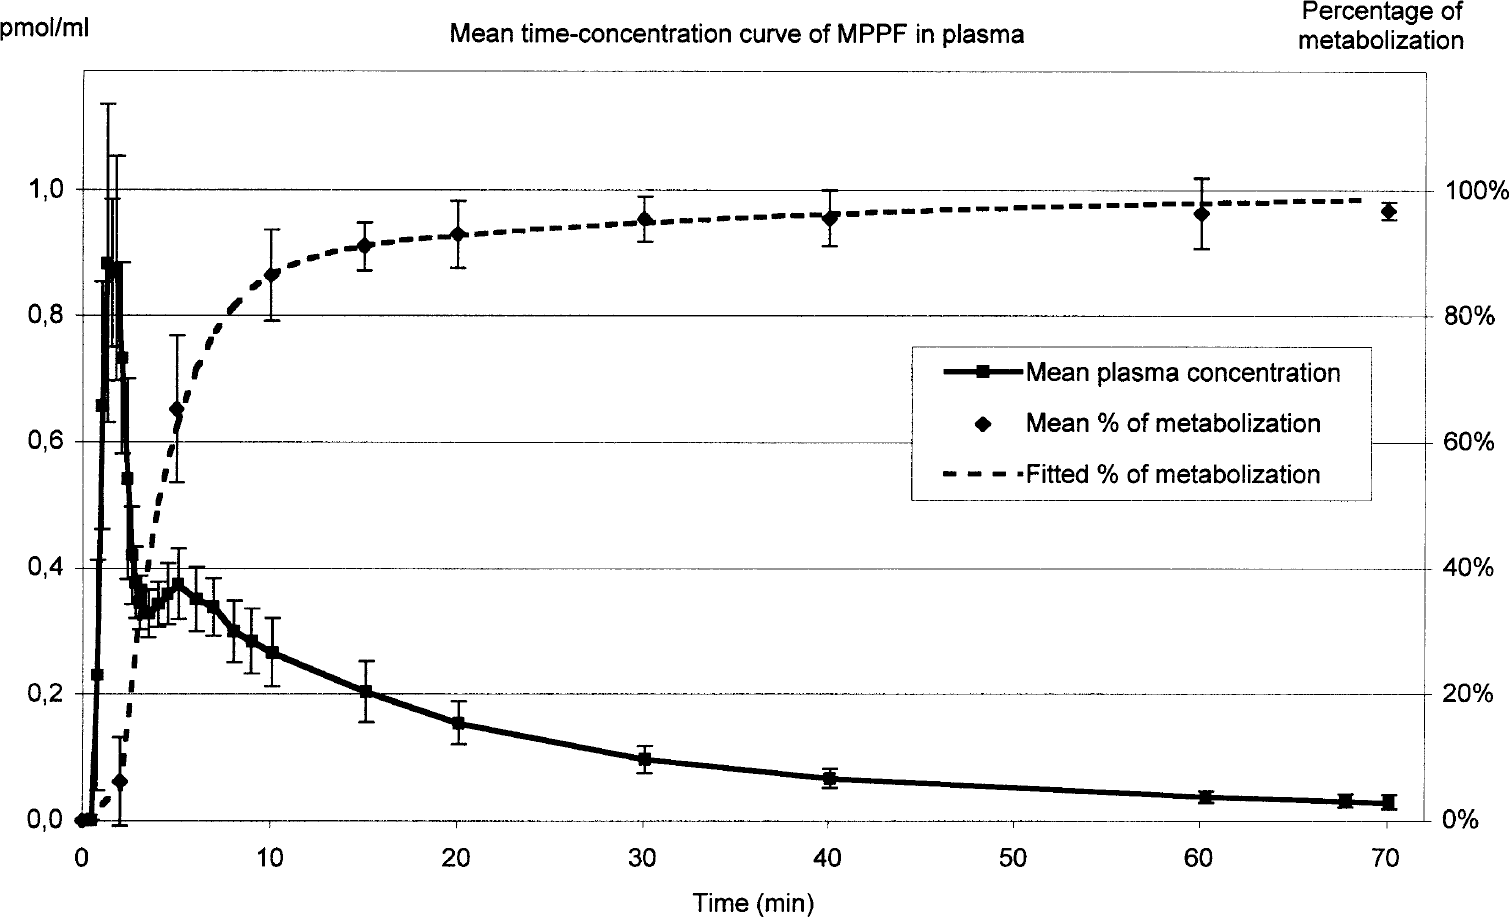
Left scale: time-concentration curve of the MPPF in plasma in picomoles per milliliter. Right scale: percentage of metabolized [18F]MPPF in plasma. Data are mean values ± SD for five subjects.
Positron emission tomography images
The PET static images (sum of images between 20 and 70 minutes after injection) showed a high uptake of the tracer in the hippocampi, parahippocampal gyri, and amygdala, and a less intense concentration in neocortical regions. The radioactivity in cerebellum, pons, and striatum was largely under the mean. On the contrary, the concentration of the tracer was high in the veins, sagittal sinus and carotids, and in the posterior aspect of the scalp. Raphe nuclei were identified in the cerebral trunk, in a region apparently devoid of tracer accumulation (Fig. 3).
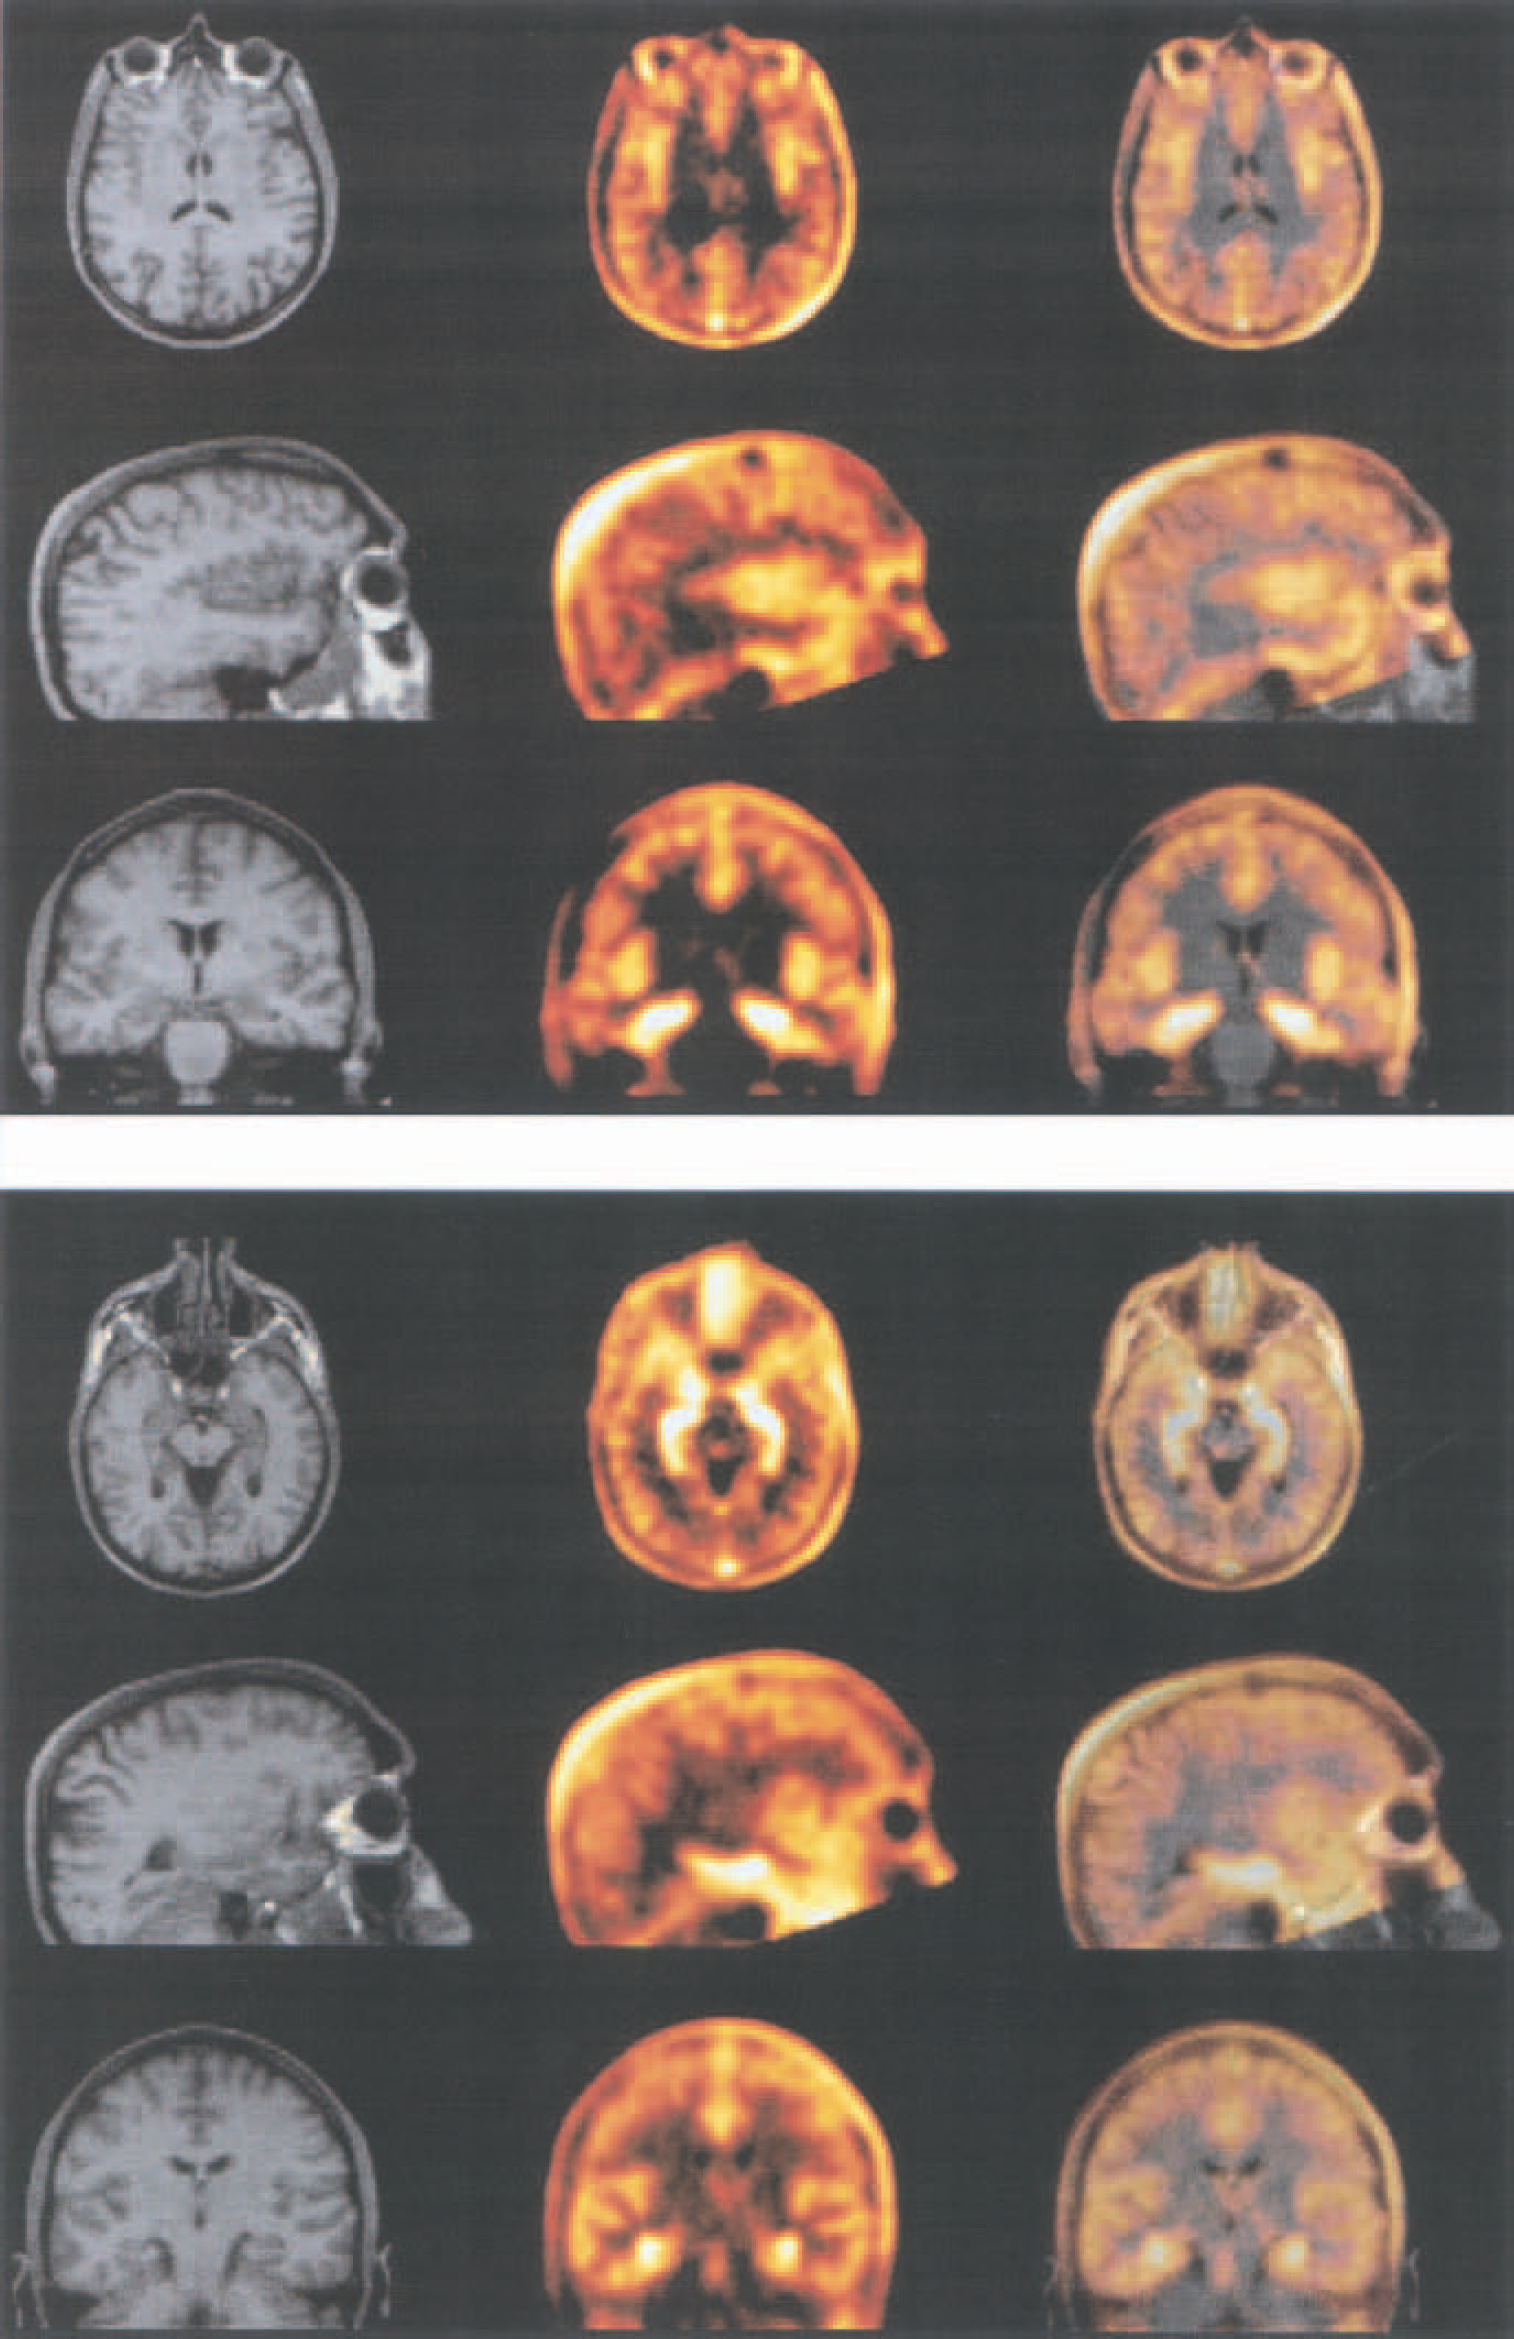
Images of anatomical magnetic resonance (MR) images and [18F]MPPF positron emission tomography (PET). Top: view of the insula. Bottom: view of the hippocampic and raphe nuclei binding. MR (left row), [18F]MPPF PET (middle row), and fusion (right row) images for subject 1.
Positron emission tomography kinetics
Time-concentration curves revealed a rapid inflow and washout in the cerebellum and the pons. On the contrary, in target regions, the time-concentration curves were delayed by an apparent fixation. The late accumulation in the region of the scalp has a delayed kinetic. The time-activity curve in raphe nuclei was very noisy. The variance of these regions revealed that noise in the raphe was the same magnitude as that in other randomly tested cortical regions of similar size. Examples of individual kinetic curves are presented in Fig. 4.
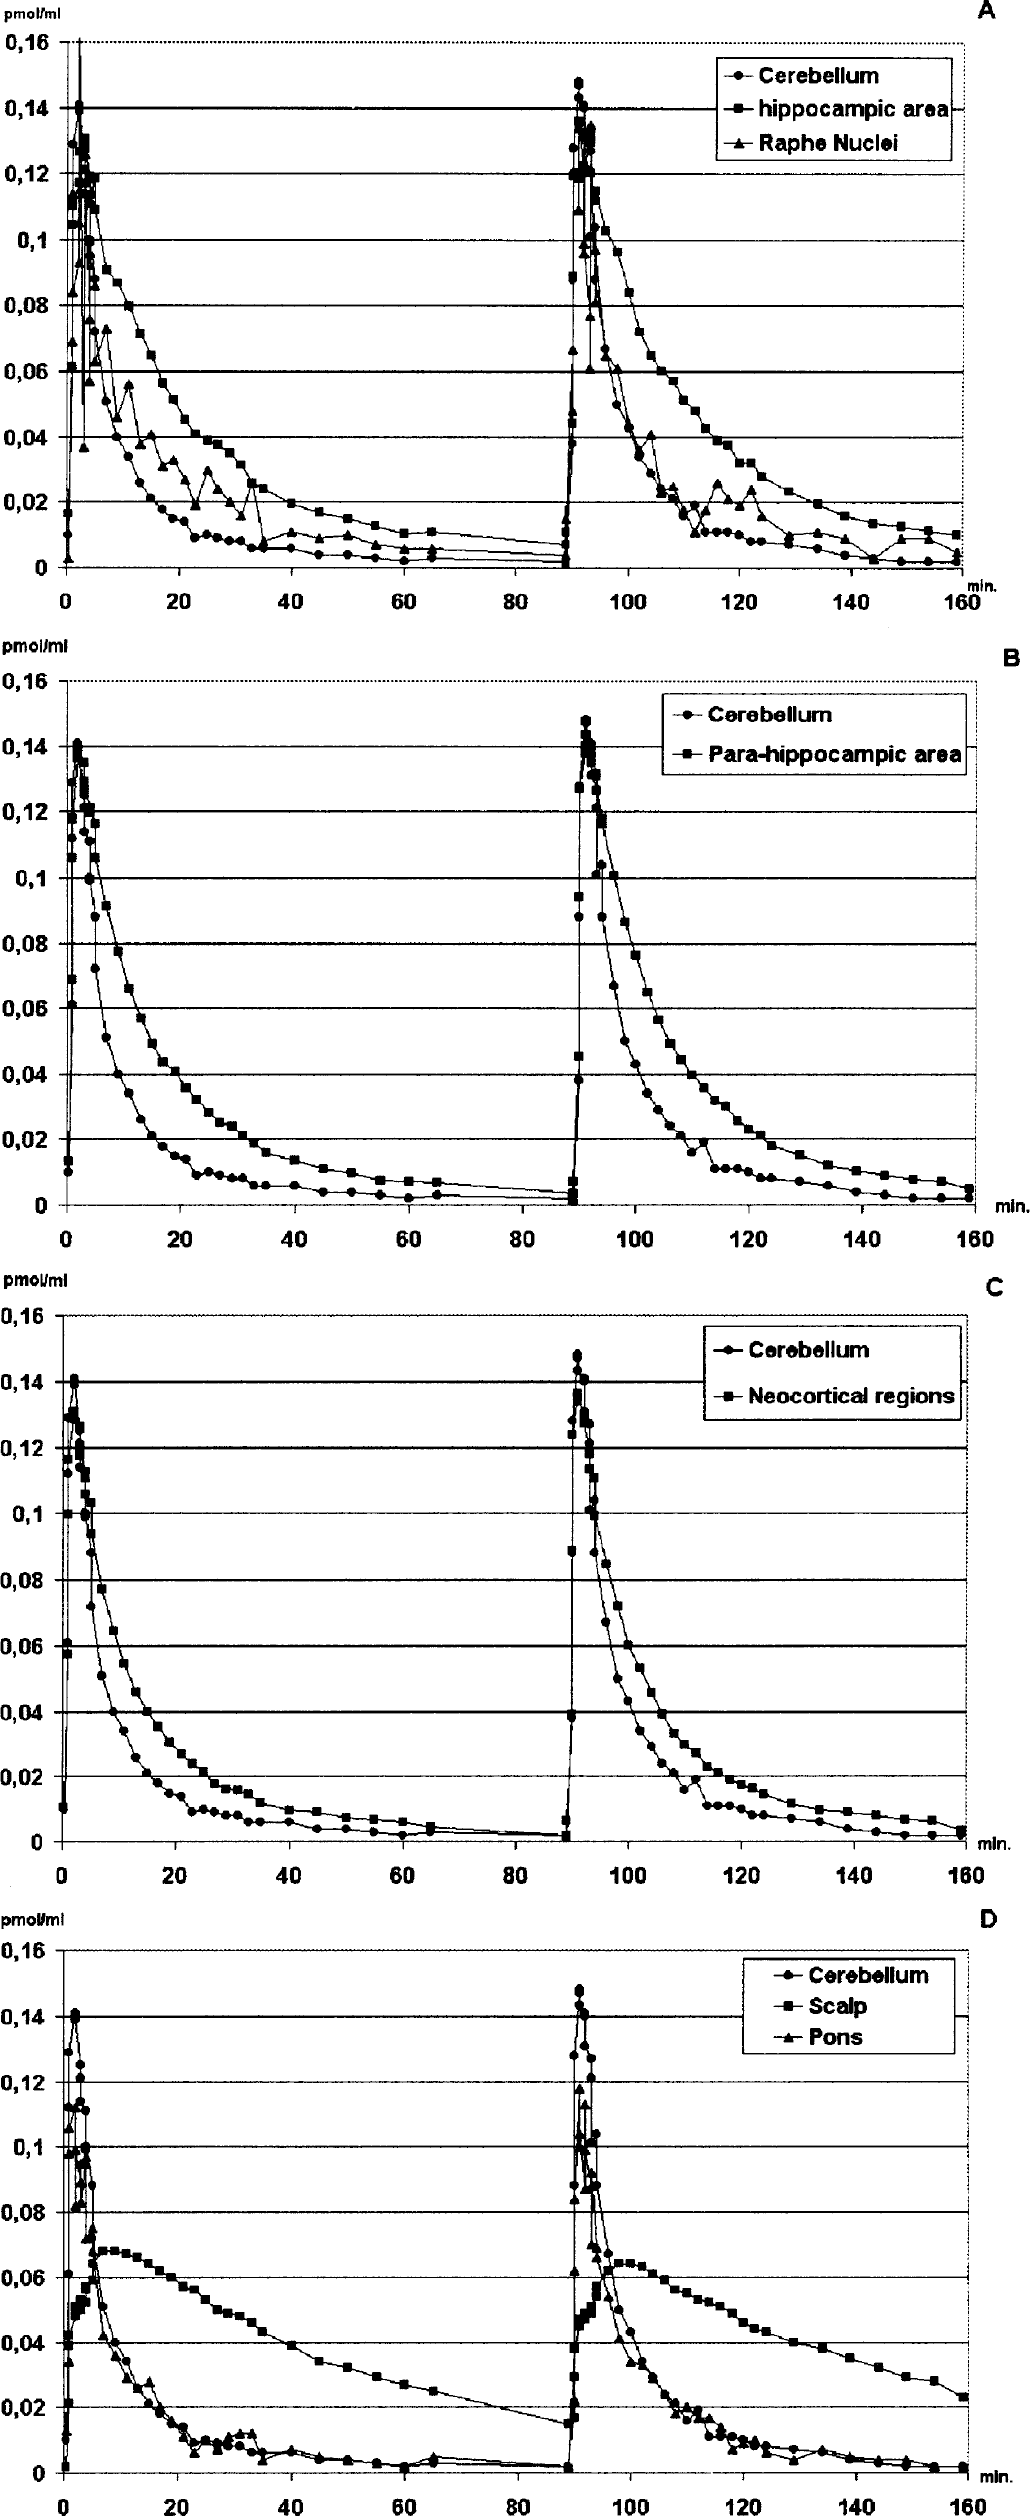
Typical time-concentration curves in one subject after bolus injection at time zero and at time 89 minutes. Plots are corrected for decay of radioactivity.
Model parameter estimation
Table 2 reports the estimation of the model parameters after fitting for the right hippocampus region and the right prefrontal cortex. Table 3 describes the average over five subjects of the model parameters after fitting.
Values of the model parameters estimated on five subjects with nonlinear fitting method in two typical regions
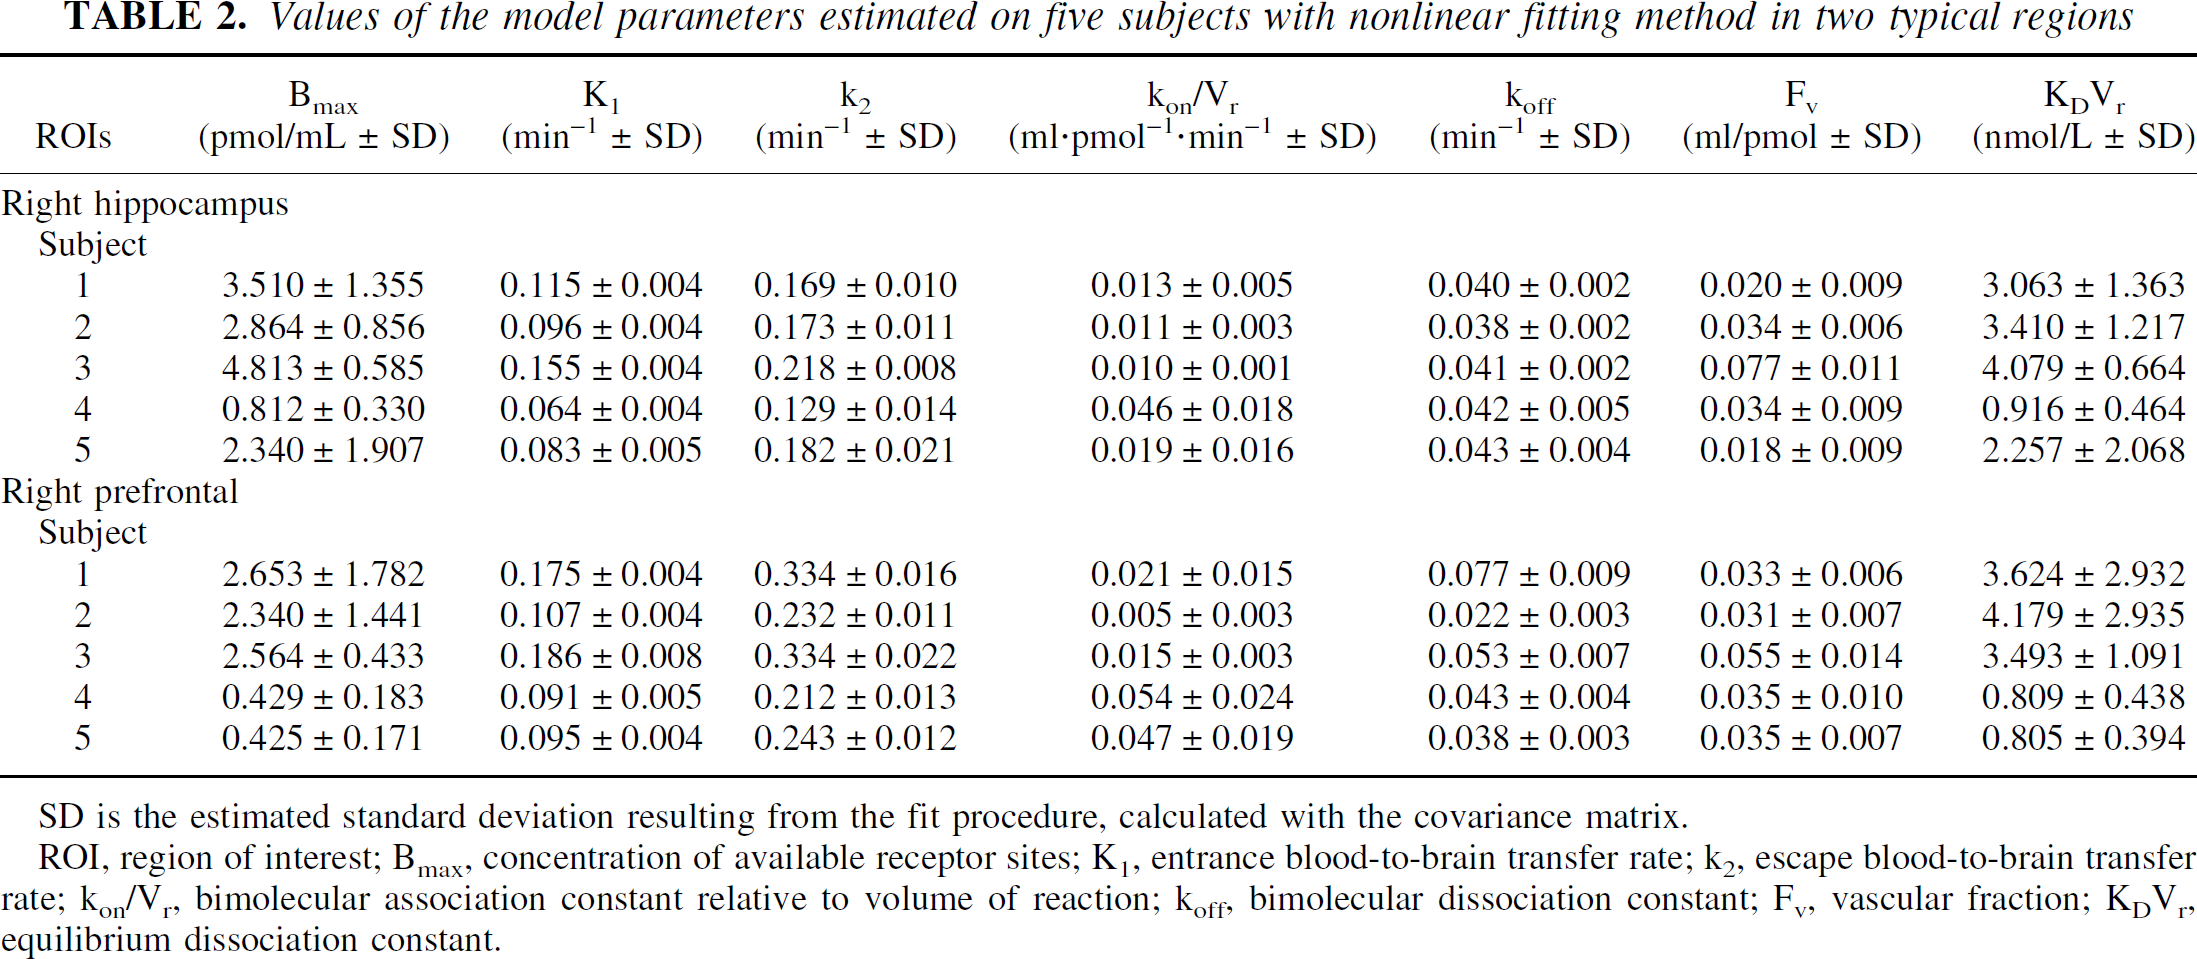
SD is the estimated standard deviation resulting from the fit procedure, calculated with the covariance matrix.
ROI, region of interest; Bmax, concentration of available receptor sites; K1, entrance blood-to-brain transfer rate; k2, escape blood-to-brain transfer rate; kon/Vr, bimolecular association constant relative to volume of reaction; koff, bimolecular dissociation constant; Fv, vascular fraction; KDVr, equilibrium dissociation constant.
Mean values (left/right averaged) of the model parameters estimated on five subjects with nonlinear fitting method
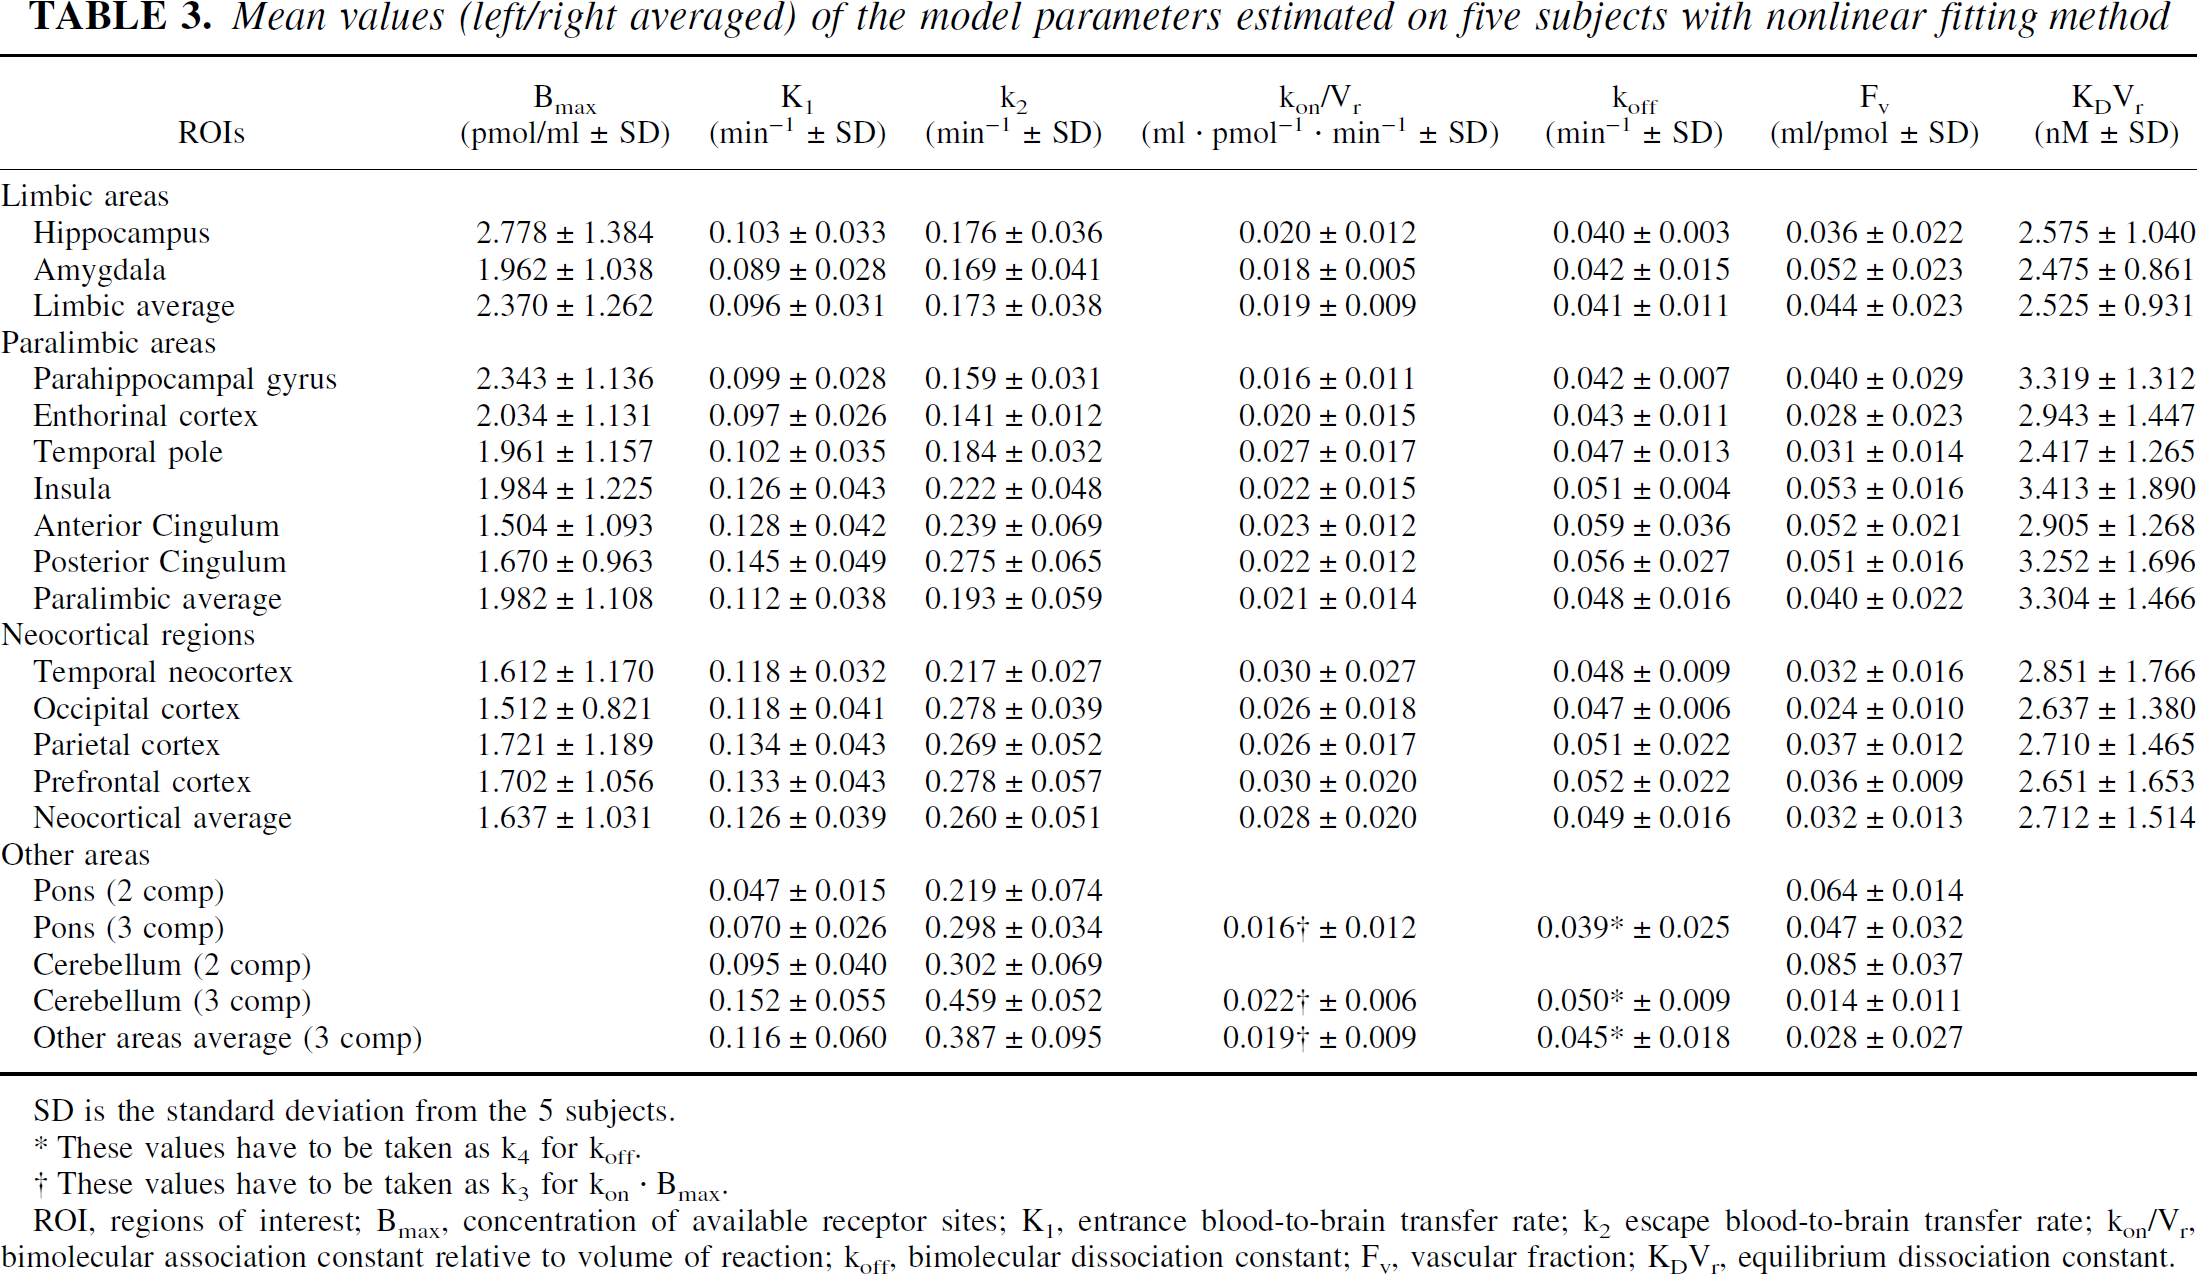
SD is the standard deviation from the 5 subjects.
These values have to be taken as k4 for koff.
These values have to be taken as k3 for kon · Bmax.
ROI, regions of interest; Bmax, concentration of available receptor sites; K1, entrance blood-to-brain transfer rate; k2 escape blood-to-brain transfer rate; kon/Vr, bimolecular association constant relative to volume of reaction; koff, bimolecular dissociation constant; Fv, vascular fraction; KDVr, equilibrium dissociation constant.
To assess the interregional variability, we grouped regions in four categories: (1) the limbic areas (hippocampus and amygdala), (2) the paralimbic area (parahippocampal gyrus, entorhinal cortex, insula, cingulum, and temporal pole), (3) the neocortical regions (temporal, occipital, parietal, and prefrontal neocortex), and (4) other regions (cerebellum and pons).
Blood-brain barrier rate
The relative error of fit for the K1 and k2 parameters was small (2% to 6% error for K1, and 4% to 10% for k2). K1 was close to 0.100/min in limbic regions, superior to 0.110/min in neocortical areas, and approximately 0.095 in the cerebellum. A SD and a relative difference close to 20% were found between subjects. In the pons, the influx rate in the tissue compartment was smaller, with a value of 0.047/min. The k2 values were regrouped the same way, and ranged from 0.135/min to 0.179/min in limbic regions, and from 0.220/min to 0.270/min in neocortical regions and in the pons. The value in temporal poles was intermediate (k2 = 0.180/min). Finally, the cerebellum showed the biggest washout, with a k2 of 0.302/min.
Vascular fraction
The vascular fraction (Fv) was close to the standard value of 0.04 (the mean over regions and subjects was 0.041 ± 0.023). The blood-tissue partition was much higher in the cerebellum and in the pons, with values of 0.08 and 0.06, respectively. A variance analysis of Fv revealed that the differences between pons and cerebellum and all the other regions was significant (P < 0.0002), whereas the Fv values between limbic, paralimbic, and neocortical regions was not significant.
Binding parameters
The average density of 5-HT1A receptors ranged from 1.5 to 1.8 pmol/mL in the occipital, temporal, prefrontal, and parietal cortices. Densities ranged from 1.5 to 2.3 in the paralimbic regions group, with the lowest value in the anterior cingulate cortex. In limbic regions, the mean density ranged from 1.9 pmol/mL in the amygdala to 2.9 pmol/mL in the hippocampus. This density was significantly different in limbic areas and in neocortical regions (P < 0.018, Bonferroni corrected). The temporal pole density was 2 pmol/mL. Among all regions, there was no significant difference between left and right values (P > 0.17), and left and right results are averaged in Tables 3 and 4. A mean receptor density of 1.77 pmol/mL (0.59 SD for a mean over the five subjects) was calculated for the raphe nuclei. We failed to identify a value of receptor density in the cerebellum and the pons using the three-compartment model because the standard error for Bmax exceeded the tolerance threshold. Therefore, we had to test two different models: a first model considering two compartments, and another introducing a third compartment to test for specific or nonspecific binding (Table 3). For the cerebellum, the best fit was found for the three-compartment model, whereas for the pons there was no significant difference in quality of fit between the two-compartment and three-compartment models.
Indices derived from the multicompartmental model and the Logan methods
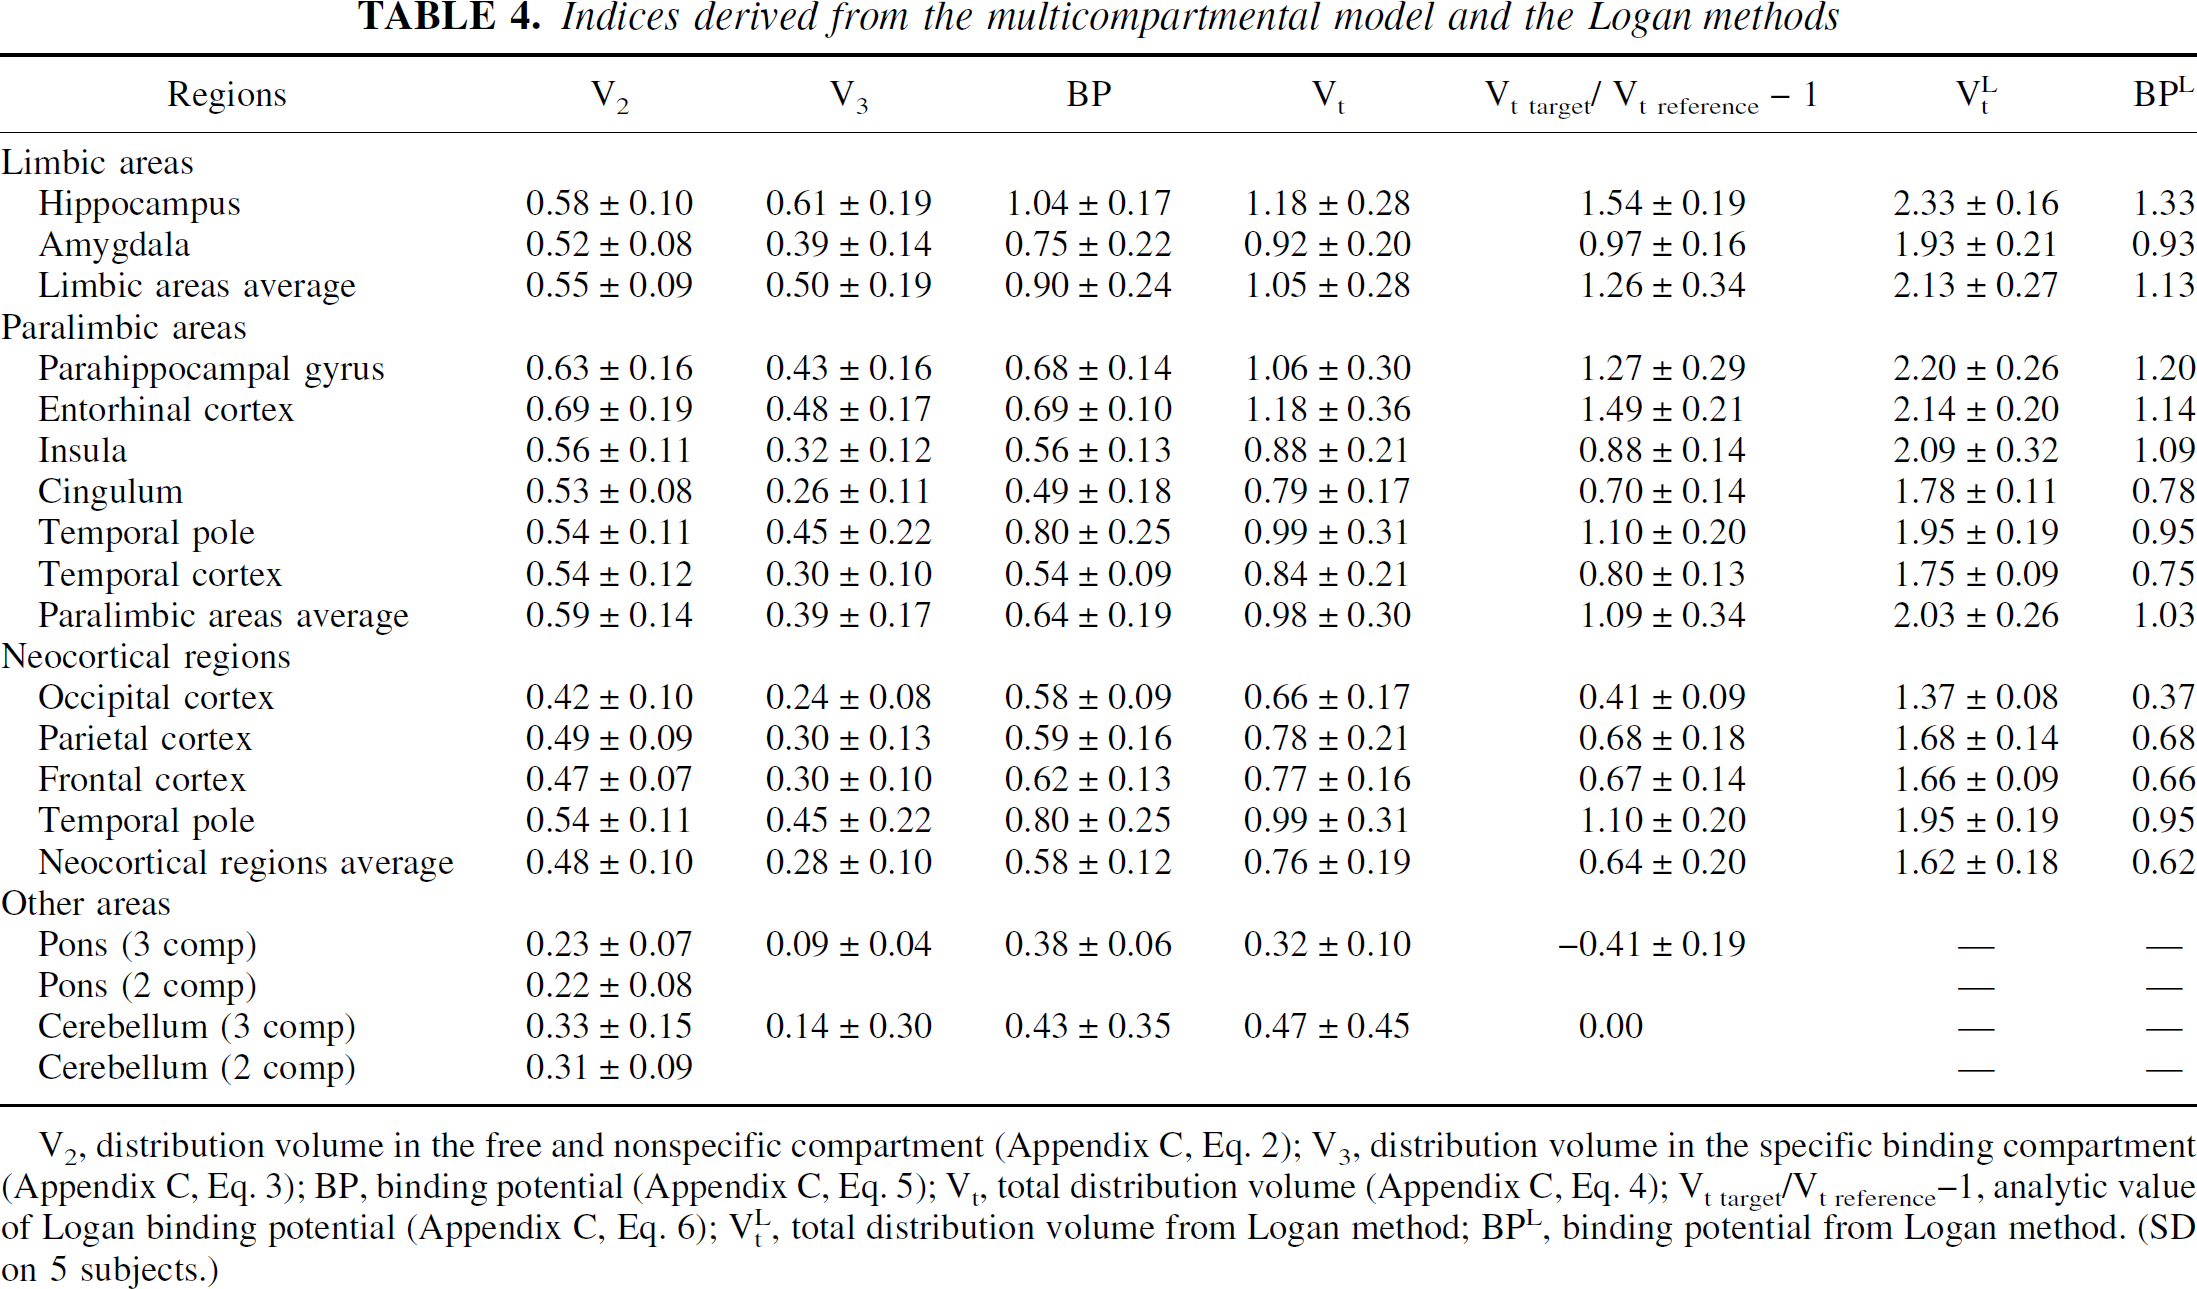
V2, distribution volume in the free and nonspecific compartment (Appendix C, Eq. 2); V3, distribution volume in the specific binding compartment (Appendix C, Eq. 3); BP, binding potential (Appendix C, Eq. 5); Vt, total distribution volume (Appendix C, Eq. 4); Vt target/Vt reference −1, analytic value of Logan binding potential (Appendix C, Eq. 6); VtL, total distribution volume from Logan method; BPL, binding potential from Logan method. (SD on 5 subjects.)
Dissociation rate
The ratio between koff and kon/Vr was relatively constant over the regions. The mean value was 0.023/min ± 0.016/min for kon/Vr, and 0.047/min ± 0.015/min for koff. All regional values for these parameters were included in the mean ± 2 SD range. No significant difference was found between regions or between groups of regions. Consequently, the apparent dissociation constant (Kd) was stable over regions, with a mean value of 2.8 ± 1.41 nmol/L.
Simplified method correlation
Analytical values of DVs and binding potential (BP) were computed from the model parameters and averaged over subjects on the data set of 23 regions (Eqs. 2, 3, 4, 5, and 6 in Appendix C). From the Logan-Patlak graphic, we evaluated the asymptote slope (VtL) and computed the binding potential (BPL; Eq. 1, Appendix B) using the cerebellum VtL as tissue reference. Results are reported in Table 4.
Distribution volume
The analytical nonspecific and free DV (V2, Eq. 2) had a mean value of 0.53 ± 0.08. The highest values were found in paralimbic regions (0.59 ± 0.14), then in limbic areas (0.55 ± 0.09) and in neocortical regions (0.48 ± 0.10). The lowest values were calculated in the cerebellum (0.33 ± 0.1). A variance analysis performed on V2 using region groups as a factor showed a significant regional variability (P < 0.0001). A post hoc analysis also revealed a significant difference between (1) the cerebellum and the other region groups (P < 0.0001) and (2) neocortical regions and paralimbic regions (P < 0.0001), but no significant difference between (3) paralimbic and limbic regions and (4) limbic and neocortical regions. The DV issued from the Logan method (VtL) ranged from 1.02 in cerebellum to 2.3 in hippocampus. The linear regression analysis of DVs computed on compartmental model parameters Vt versus VtL, was significant: VtL = 1.60 Vt + 0.43 (R2 = 0.86, P < 0.001).
Binding potential
Analytical values of BP (Eq. 5) ranged from 0.43 in the cerebellum to 1.18 in the hippocampus, with approximate values of 1.0 in other limbic regions, 0.7 in the entorhinal cortex and amygdala, and 0.55 in neocortical regions. The temporal pole reached a value of 0.8. The analytical value V3 (Eq. 3) was distributed the same way as BP over regions, but with a lower magnitude. The BP evaluated with the graphical analysis of the Logan method (BPL), using cerebellum DVs as reference, ranged from 0 (reference) to 1.3 in the hippocampus. In particular, BP values were approximately 1.0 in paralimbic regions (except in entorhinal cortex, 0.8), and between 0.6 and 0.7 in other cortical regions, whereas the lowest value was found in the occipital cortex (0.37).
A correlation analysis was performed to compare the distribution of BPL with analytical indices computed with the compartment model. These results are presented in Figure 5. The BPL was strongly correlated with BPLanalytic (R2 = 0.88, P < 0.001). Significant correlations were found with V3, Vt, and Bmax. Plots of BPL versus compartmental BP were more scattered and correlation was at the limit of significance (P = 0.011). Kd was not linearly correlated to BPL.
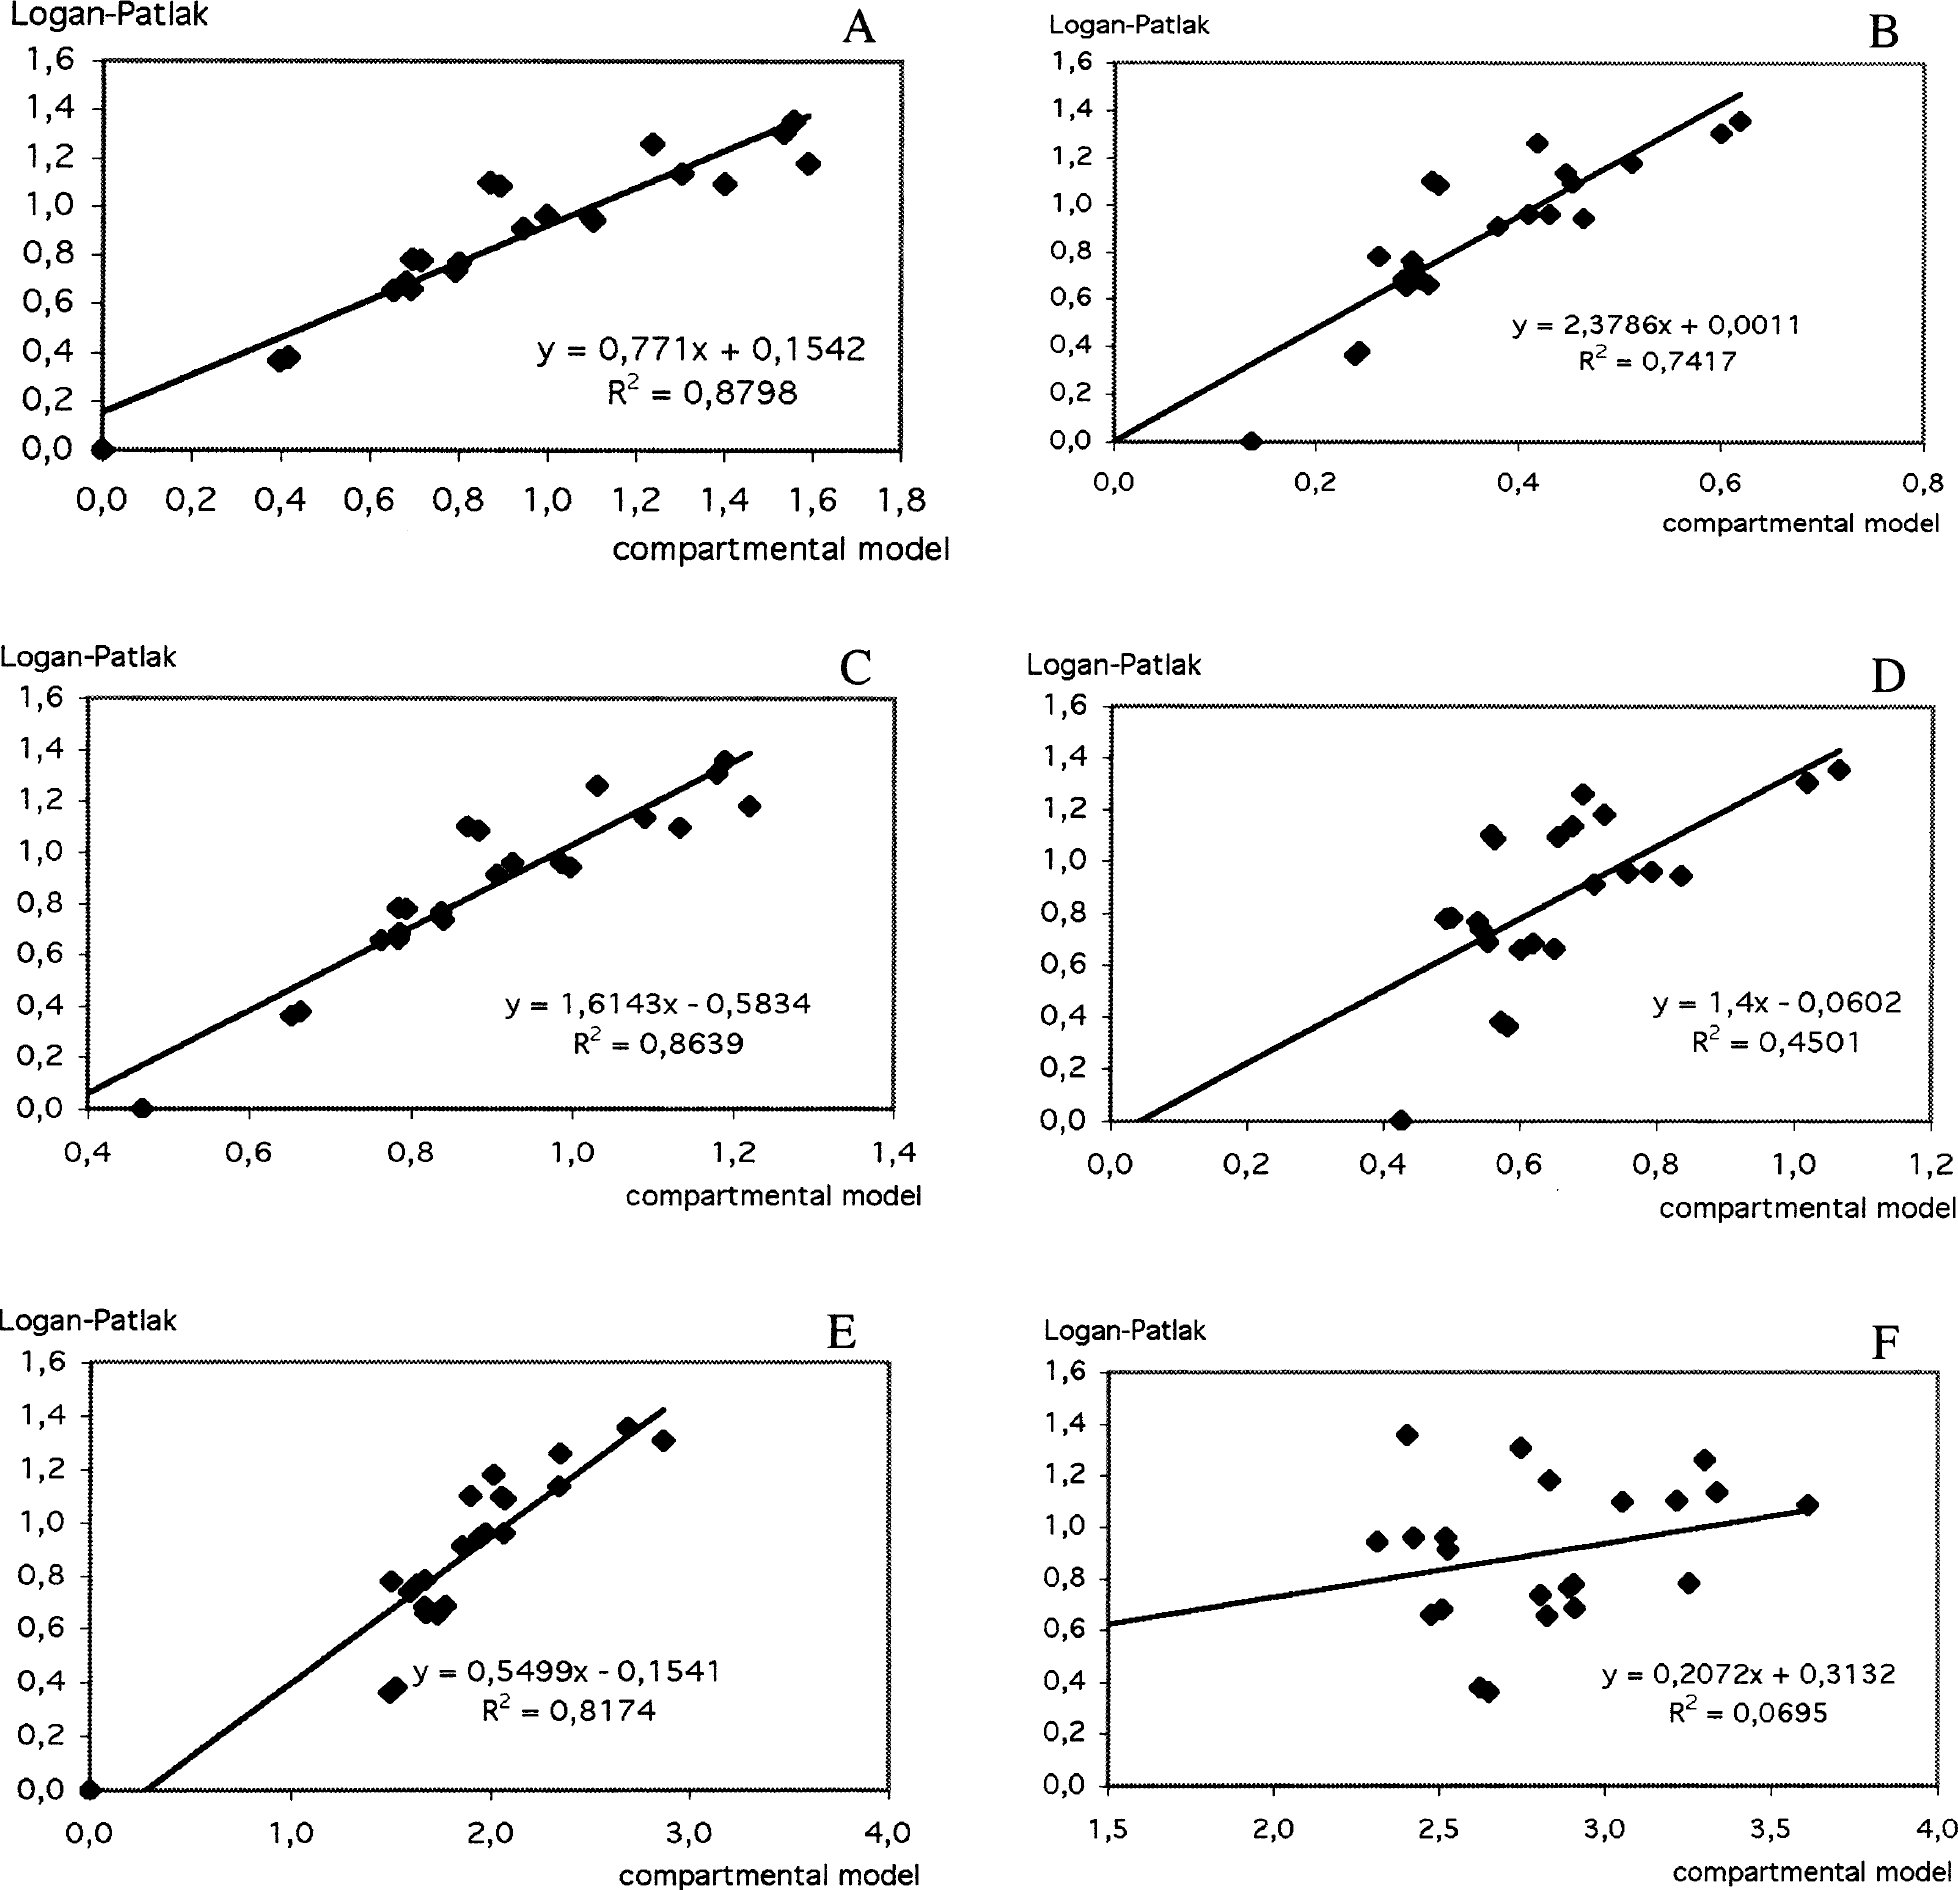
Correlation between binding potential (BP) measured by Logan graphical method (BPL) with a reference tissue input function, and analytical values of distribution volumes (DVs) and binding potential computed from the compartmental model parameters (Appendix C).
DISCUSSION
The aim of this study was to quantify the in vivo exchange of MPPF with the serotonergic 5-HT1A receptors using a compartmental model. An experimental design was defined to achieve the determination of six unknown parameters characterizing the model. The resolution of the system provided a complete quantitative overview of the exchange rates, the density of 5-HT1A receptors, and the affinity of MPPF for receptors over 24 anatomical brain regions.
MPPF distribution in blood and brain
Our data regarding arterial function are concordant with the results of previous [18F]MPPF studies (Passchier et al., 2000a,b), which reported, in two different groups of subjects, that 10% of the original ligand was present in plasma 10 minutes after injection. The metabolization reported in the present study is slightly slower. On average, we found that 14% of unmodified MPPF was present 10 minutes after injection. The dispersion of individual curves was not significant, and the use of a standard biexponential equation for metabolite correction of blood samples might be considered a good approximation.
In agreement with findings of previous [18F]MPPF-PET studies (Passchier et al., 2000a, b ; Passchier et al., 2001), equilibrium static images showed a high tracer uptake in limbic areas and in paralimbic regions. Compared with other limbic and paralimbic areas, cingulum and entorhinal cortices showed less tracer accumulation. The values in these latter regions were more similar to those found in neocortical areas. This particular distribution within paralimbic areas has not been observed with WAY 100635 images (Gunn et al., 1998). However, a direct comparison of raw data between different tracers should be viewed with caution because multiple parameters are involved. Thus, receptor density parametric images should be computed to ensure reliable comparisons. This, however, was outside the scope of our study.
Raphe nuclei were clearly discernable, and the coregistration with MR imaging data allowed us to confirm their anatomical localization in the cerebral trunk, dorsal to the periaqueductal gray matter. In all of our subjects, raphe nuclei were detected on several transverse planes (typically two to five planes, which corresponds to 5 to 12 mm). The extension of this structure in the vertical direction is not well adapted to the transverse acquisition plane imposed by the PET scanner. Moreover, the size of the apparent structure on PET images exceeded the actual size of the anatomic structure, which indicates that a partial volume effect altered the measure. A volumetric three-dimensional correction would be necessary to evaluate the real concentration of tracer in such small structures. This work is currently in progress.
Model parameter identification
Identification of model parameters was possible and relatively accurate despite the low difference between apparent specific activities that were chosen for injections. Theoretically, the optimal protocol for parameter estimation of a multicompartmental model includes a first injection at the tracer dose, a displacement with the unlabeled ligand, and a coinjection of labeled and unlabeled ligands to saturate the receptor sites (Delforge et al., 1989; Delforge et al., 1990). Using such a protocol, the resolution of the equation system leads to a unique solution. However, in our case a displacement injection would have implied a massive injection of unlabeled MPPF. Because behavioral effects of a large dose of MPPF have not been tested in humans, we limited, for pharmacologic safety reasons, the amount of coinjected unlabeled MPPF to achieve a tenfold-lower specific activity for the second injection. Therefore, in our protocol, the resolution of the equation system might lead to a nonunique solution. The reliability of the solution has to be tested, possibly using two different techniques. First, the definition of constraints regarding some of the parameters allows the achievement of pharmacologically realistic solutions. For example, we excluded mathematical solutions for which the Kd value exceeded an interval of ± 10 times the in vitro value of Ki (3.3 nmol/L; Zhuang et al., 1994). The use of such constraints usually leads to a solution in which the value of the parameters fell within an acceptable SD. Second, the stability of the solution can be tested to rule out local minima. To test the stability, we changed the initial values defined before the fit procedure and checked that the algorithm converged toward the same final parameters.
The distribution of receptor density in target regions reflected the visual inspection of raw static images. To assess the validity of our results, we plotted the distribution of receptor density measured by PET with [18F]MPPF against results of autoradiographic binding on resected human tissues with [3H]WAY-100635 (Burnet et al., 1997; Hall et al., 1997). Despite the disproportion of absolute values for the density between ex vivo radiographic data and in vivo PET measurements, we found an excellent correlation between these two approaches (see Figure 6). Regarding the density of 5-HT1A receptors in the cingulate cortex, the Bmax for this region closely matched that of other neocortical regions. This profile was also observed in the study of Hall et al. (1997), whereas Burnet et al. (1997) found a ratio of 1.5 between the cingulum and temporal cortex. Concerning the raphe nuclei, our modeling provided a value for the density of 5-HT1A. However, the statistical noise for these data and the partial volume effect due to the small size (close to the resolution) of the structure gave a relative poor value of Bmax and a high uncertainty regarding the quality of fit because the relative error was two or three times larger than the parameter value itself. For these reasons, these results were not reported in Table 3.
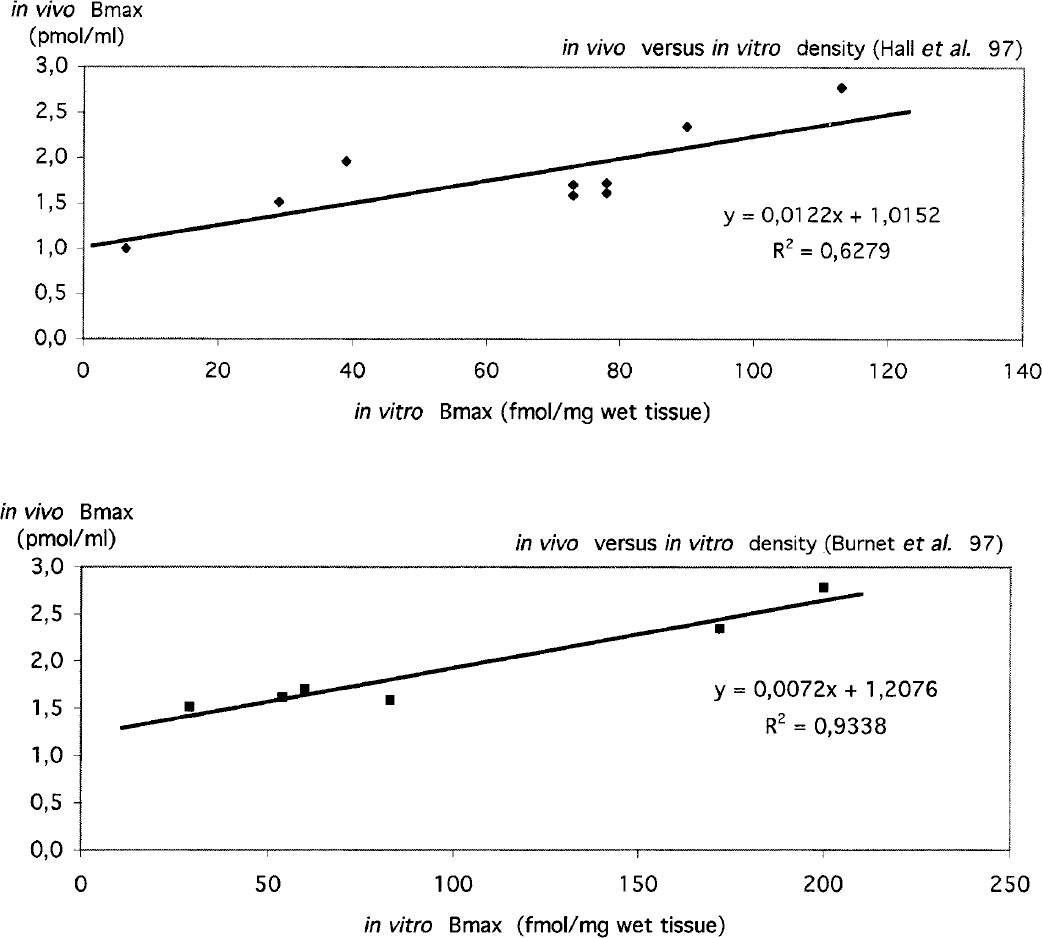
Correlation between the density measured in vitro by [3H]WAY-100635 autoradiography (Burnet et al., 1997; Hall et al., 1997) and measured in vivo by [18F]MPPF positron emission tomography.
Because a pharmacologic displacement with unlabeled MPPF was not possible in this study, the free and nonspecific compartments could not be assessed individually. Therefore, in regions for which the identification of three compartments was not possible, we considered only two compartments (i.e., a vascular compartment and a single tissular compartment). However, in this case, we introduced an auxiliary compartment to test for the binding of ligand in the cerebellum and pons with no separate identification of Bmax and kon (k3 = konBmax). For the cerebellum, the two-compartment model (a common compartment for free and nonspecific binding) provided K1 and k2 values of 0.095/min and 0.302/min, respectively. Besides in the three-compartment model, values for K1 and k2 were 0.152 and 0.459, and values for k3 and k4 were 0.022/min and 0.050/min. We could verify that k2/(1 + k3/k4) equals 0.318, which was close to the apparent k2 found in the two-compartment model. Because the dissociation rate found for this supplementary compartment in cerebellum (k4) was close to the mean dissociation rate of target region (koff = 0.047), and because the fit was better if we considered three rather than two compartments, we assumed that this auxiliary compartment, because of its kinetic parameters, represented a specific association to 5-HT1A receptor. Because metabolites are polar and do not cross the brain-blood barrier, this interpretation suggests that 5-HT1A receptors may be present in the cerebellum, but with such a small density that our method cannot dissociate Bmax and kon/Vr. The same analysis (two-compartment and three-compartment separate fit) performed in the pons gave values of 0.047 and 0.219 for K1 and k2' and 0.070, 0.298, 0.016, and 0.039 for K1, k2, k3 and k4, respectively. Once again, the k2/(1 + k3/k4) ratio equals 0.211/min, which was close to the k2' value computed by the two-compartment model. In this case, k4 was significantly different from the mean koff, suggesting no specific binding in the pons.
Simplified reference tissue model
Using knowledge of the local exchange parameters, we were able to analytically compute classical indexes usually used in the quantification of PET images without arterial blood function. The analysis over all cerebral regions revealed that the DV was fairly constant in the limbic, paralimbic, and neocortical regions. We showed that the cerebellum has a different DV (considering two or three compartments). In the simplified method, which needs a reference tissue to compute a BP, one of the underlying hypotheses is that target and reference regions have an equivalent DV. This hypothesis was not confirmed in our study because we found different DV values in the cerebellum and in target regions.
Consequently, the cerebellum, known to have a poor concentration of 5-HT1A receptors, should not be taken as a reference region for the evaluation of Bmax/Kd without any correction. The correlation of the BP, computed from the graphical Logan method (BPL), and analytic parameters issued from the CNL method, confirms this inadequacy (Fig. 5): there is poor linear correlation between the BPL and BP (CNL method). This point suggests that the index measured by Logan method is not strictly linked to Bmax and Kd. However, we found that Logan BPL was closer to V3, the BP multiplied by the DV of the nonspecific nondisplaceable compartment (V3 = V2·Bmax). Furthermore, we verified that the analytic formula Vt target/Vt reference−1 (Eq. 6) computed with model parameters was well correlated with BPL. This finding confirms that the Logan method provides a good estimation of regional DV Vt target and Vt reference. An interesting finding of this analysis was that BPL was well correlated with Bmax. This finding can be explained by the fact that even if Kd and k2 are stable over regions, the ratio V2/Kd also stays relatively constant over regions. This hypothesis was statistically verified by unpaired t-test on V2/Kd. It can thus be concluded that even if BPL was not a good index of Bmax/Kd, it was nevertheless a reliable index of receptor density in healthy subjects. Further investigations should assess if another region than cerebellum may provide a better reference for the quantification of receptor density.
CONCLUSIONS
A double-injection protocol was performed on healthy subjects to quantify the parameters of a compartmental model describing in vivo brain distribution of MPPF with PET. Compared with previously published results of ex vivo tissular receptor concentration, our results confirm the specificity of MPPF for 5-HT1A receptors. A measurement of regional affinity indicates a mean in vivo Kd.Vr value of 2.8 nmol/L for MPPF, which suggests that this ligand is a good candidate for determining the in vivo concentration variations for endogenous serotonin. Moreover this study confirms that, in the absence of blood arterial sampling, the BP estimated by the Logan method is a good index of local receptor concentration in healthy subjects, which allows for the calculation of MPPF parametric images.
Footnotes
APPENDIX A
APPENDIX B
APPENDIX C
Acknowledgements
The authors thank V. Berthier, M. Lionnet, and C. Vighi, for excellent medical assistance during the PET experiment, G. Bonmarchand for [18F] MPPF syntheses, S. Guillouet and F. Bonnefoi for chemical assistance and blood sample analyses, and Dr. Marc Hermier for providing access to the MR image acquisition and for taking medical responsibility of the MR imaging session.