
Abstract
Pronounced hyperglycemia provoked by extradural compression (EC) of the sensorimotor cortex was recently described in the non-insulin dependent Goto—Kakizaki (GK) diabetic rat. Compared with control Wistar rats, GK rats exhibited more extensive brain damage after cortical ischemia at 48 h of reperfusion (Moreira et al, 2007). We hypothesized that the enhanced brain injury in GK rats could be caused by differential regulation of the heme degrading enzyme heme oxygenase (HO)-1, known to interact with the expression of other target genes implicated in antioxidant defense, inflammation and neurodegeneration, such as superoxide dismutase (SOD)-1, −2, inducible nitric oxide synthase (iNOS), and tumor necrosis factor-α (TNFα). At 48 h after ischemia, relative mRNA expression of such target genes was compared between ipsilateral (compressed) and contralateral (uncompressed) hemispheres of GK rats, along with baseline comparison of sham, uncompressed GK and Wistar rats. Immunohistochemistry was performed to detect cellular and regional localization of HO-1 at this time point. Baseline expression of HO-1, iNOS, and TNFα mRNA was increased in the cortex of sham GK rats. GK rats showed pronounced hyperglycemia during EC and transient attenuation of regional cerebral blood flow recovery. At 48 h after reperfusion, HO-1 mRNA expression was 7- to 8-fold higher in the ischemic cortex of both strains, being the most upregulated gene under study. Heme oxygenase-1 protein expression was significantly reduced in diabetic rats and was found in perilesional astrocytes and rare microglial cells, in both strains.
Keywords
The reduced HO-1 protein expression in GK rats at 48 h after reperfusion combined with more extensive neurodegeneration induced by EC, provides further in vivo evidence for a neuroprotective role of HO after brain ischemia.
Introduction
A higher incidence of stroke has been reported among diabetic patients, usually associated with poor clinical outcomes (for a recent review see Idris et al, 2006). Reperfusion and reoxygenation after cerebral ischemia provides oxygen as a substrate for enzymatic oxidation, and in this regard, diabetes was shown to worsen recovery from brain injury through, among other mechanisms, increased generation of reactive oxygen species (Baynes and Thorpe 1999). Thus, oxidative stress is likely to play a major role in the recovery of cerebral ischemia under hyperglycemic conditions through the regulation of cell survival.
In situations of brain ischemia/hemorrhage or trauma, heme is released during breakdown of blood hemoglobin and other hemoproteins in the cytoplasm, or from mitochondrial cytochromes of neurons and glia (Wagner et al, 2003). Heme degradation is catalyzed by the two major isozymes of the HO system, heme oxygenase 1 and 2 (HO-1, HO-2), producing equimolar amounts of carbon monoxide (CO), Fe2+, and biliverdin. Biliverdin is then converted into bilirubin by biliverdin reductase-α (BVR), a zinc metalloprotein (Maines and Trakshel 1993).
In recent years, several findings have suggested a neuroprotective action for the heme oxygenases. For instance, HO-1 overexpression in transgenic mice was suggested to protect neurons after permanent middle cerebral artery occlusion (MCA-O) (Panahian et al, 1999b). In addition, HO-2 knockout mice exhibited reduced motor recovery on the rotarod and beam-walking tests after traumatic brain injury, indicating that this enzyme also has a protective role against cellular damage (Chang et al, 2003). Heme oxygenase-1 was also described to affect several enzymes involved in free radical scavenging in a neuroprotective manner. For instance, HO-1 induction was found to stimulate superoxide dismutase-1 (SOD-1) (Turkseven et al, 2005) and to induce superoxide dismutase-2 (SOD-2) expression in the mitochondria of astrocytes (Son et al, 2005), decreasing cellular concentrations of the superoxide anion O2•−. Moreover, SOD-1 and −2 inductions were found to exert cytoprotective effects against increased O2•− and nitric oxide (NO) production (Keller et al, 1998). Superoxide excess is associated with the development of brain edema and apoptotic neuronal cell death after focal brain ischemia (Kondo et al, 1997). However, although evidence for neuroprotective actions of heme oxygenases exist in the literature, contradictory results indicate otherwise. For example, HO-1 overexpression in rat astroglia was reported to induce oxidative mitochondrial damage and to increase astroglial death (Song et al, 2006). Heme oxygenase-1 was also reported to have a proapoptotic effect and to chaperone-damaged neurons to the apoptotic cell-death pathway (Panahian and Maines, 2001). Neurons destined to die from apoptosis show upregulation and translocation of the Bax protein to the nucleus (Krajewski et al, 1995). Accordingly, neuronal Bax mRNA and protein levels were found to increase after brain ischemia (Krajewski et al, 1995). The proapoptotic proteins Bax and Bak were recently shown to initiate apoptosis by translocating to the endoplasmic reticulum (Zong et al, 2003), which may be of relevance since HO-1 is also located in the endoplasmic reticulum and a possible interaction may occur.
Inducible NO synthase (iNOS) is a heme-containing enzyme producing NO, with increased expression between 12 and 24 h after cerebral ischemia (Iadecola et al, 1996). Although NO is beneficial as a vasodilator, in excess it can be neurotoxic through reaction with O2•− to form peroxynitrite anion (ONOO−), which rapidly degrades to the very toxic hydroxyl radical (OH•) (Beckman et al, 1990). Overproduction of NO can also stimulate apoptosis-like cell death in astrocytes by p53- and Baxdependent mechanisms (Yung et al, 2004) and was recently shown to induce glial HO-1 activity and SOD-2 upregulation in a sequential fashion (Son et al, 2005).
Tumor necrosis factor-α (TNFα) is a proinflammatory and proapoptotic cytokine known to be upregulated in neurons and inflammatory cells (microglia and migrated neutrophils) after focal brain ischemia (Liu et al, 1994). In particular, TNFα was reported to induce SOD-2 mRNA expression via mitochondria-to-nucleus signaling (Rogers et al, 2001) and to induce HO-1 expression in vascular endothelial cells (Terry et al, 1999).
In our laboratory, we have developed a model of experimental focal brain ischemia in the rat produced by transient, short-lasting (30 min) unilateral extradural compression (EC) of the sensorimotor cortex, which produces neurological manifestations (contralateral fore- and hind limb paresis) and selective neuronal death in the cortex, hippocampus, and thalamus (Moreira et al, 2005, 2006). Clinically, this model is thought to mimic focal cerebral ischemia resulting from decreased blood flow supply to the cortex owing to stroke (Watanabe et al, 2001). The major advantage of using EC is that this procedure elicits a less extensive and reproducible primary damage while showing the typical functional impairments (limb hemiparesis) as opposed to other previously described models of focal brain ischemia in animals (Andersson et al, 2006; Kundrotiene et al, 2004; Moreira et al, 2005; Watanabe et al, 2001). Subtle improvements in function or histomorphology after ischemia can be better identified and compared between strains if the primary damage is not a major infarction and if the secondary damage is clearly distinguishable from the initial ischemic lesion. In this study, partially published in abstract form (Moreira, 2006; http://diss.kib.ki.se/2006/91-7140-722-7), we wanted to investigate whether neurochemical or gene expression differences exist between non-diabetic Wistar and diabetic Goto—Kakizaki (GK) rats after focal cortical ischemia induced by EC, and if these differences may explain the detrimental outcome of brain injury associated with diabetes mellitus. The GK rat is a non-obese, spontaneously diabetic rat produced by selective breeding of Wistar rats displaying high glucose levels in the oral glucose tolerance test. Goto—Kakizaki rats exhibit several features of diabetes mellitus type 2 such as moderate but stable fasting hyperglycemia, impaired secretion of insulin in response to glucose, and peripheral insulin resistance (Ling et al, 2001). In line with the above findings, we thus hypothesized that (1) HO-1, HO–2, and BVR gene expression and/or secretion would be higher in the GK rat strain after EC, (2) expression of other antioxidant genes involved in O•−2 scavenging (SOD-1 and −2) would be increased in diabetic rats due to hyperglycemia, (3) expression of proinflammatory genes such as TNFα and iNOS would also be higher in GK rats after EC, and (4) increased neurodegeneration induced by EC in GK rats could be associated with a higher degree of HO-1 and Bax gene expression. To test the hypotheses above, cortical and hippocampal tissue was collected 48 h after EC and from uncompressed animals of both strains. Relative mRNA expression in the compressed hemisphere was compared with relative mRNA expression in the contralateral, uncompressed hemisphere using real-time reverse transcriptase-polymerase chain reaction (RT-PCR). A comparison of relative mRNA expression of sham, uncompressed brains from both strains was performed to establish baseline gene expression. At 48 h after EC, Western blotting was employed to detect protein expression of HO-1 and double immunohistochemistry in neurons, astrocytes, and microglia was performed to detect cellular and regional localization of HO-1.
Materials and methods
Subjects
A total of 61 (27 Wistar and 34 GK) male rats weighing 274 ± 6.6 and 308.2 ± 12.3g, respectively and matched regarding age (10 to 12 weeks old) were used. Wistar rats were purchased from B&K Universal (Sollentuna, Sweden). Goto—Kakizaki rats were bred in our local colony (Stockholm, Karolinska Institutet). After delivery, both rat strains were housed in the same temperature-, humidity- and light-controlled animal facility (24°C, 50% humidity, 12/12(light/dark) to adapt to the same novel environment. A 3-day handling and habituation to the experimenter started after approximately 1 week of room acclimatization. The weight gain and food intake was daily measured both before and after surgery. Food and water were available ad libitum. All experiments were approved by the Ethical Committee at the Karolinska Institutet (Swedish Animal Welfare Act SFS 1998:56 and EU Directive 86/609/EEC).
Extradural Compression Protocol and Blood Glucose Sampling
Animals were weighed and anesthetized with a mixture of 1mL of Hypnorm® (fluanisone 10 mg/mL and fentanyl citrate 0.315 mg/mL; Janssen, Beerse, Belgium), 2mL of sterile water and 1 mL of midazolam (5 mg/mL; AstraZeneca, Södertälje, Sweden). The administered dose of the mixture was 2.7 mL/kg intraperitoneally. Anaesthesia was maintained by injecting 0.1 mL of the Hypnorm® mixture intraperitoneally every 30 to 40 mins (′). For soft tissue analgesia, Marcain® (5 mg/mL, AstraZeneca, Södertälje, Sweden) was injected subcutaneously in the soft tissues of the skull and tail vein (1 mL/rat). The rats were placed in a stereotaxic apparatus (David Kopf Instruments, Tujunga, CA, USA). The flat skull position was achieved by lowering the incisor bar to 3.3 ± 0.4 mm. A Plexiglas piston (8 × 6 mm with the rostral part shortened by 2 mm) was positioned at an angle of 20° over the right sensorimotor cortex. The defined area of the skull was cut out using a fine drill and gently removed from the dura mater. The compression piston was lowered to touch the surface of the dura mater, and then slowly lowered another 3 mm, at the rate of 1 mm/min (0.25 mm every 15 secs). Cortical regional cerebral blood flow (rCBF) was measured with a Laser-Doppler probe (PeriFlux 4001 Master, Perimed®, Järfälla, Sweden) inserted in the Plexiglas piston. After 30′ of compression, the piston was removed at the same speed rate (0.25 mm/15 secs). The skull bone was repositioned and the cranial skin sutured with polyethylene filament (Ethilon® 3/0, Johnson & Johnson, Dilbeek, Belgium). To avoid increased intracranial pressure and contracoup contusive effects, a space of 1 mm was allowed between the drilled bone edges and the surface of the piston to allow the brain to adjust smoothly to the compression. Body temperature was monitored using a rectal probe (Temperature Control Unit HB 101/2, Letica® Scientific Instruments, Barcelona, Spain) and maintained constant using a digitally controlled heating pad throughout the compression protocol. Brain temperature was measured with a probe connected to a thermometric device (Physitemp® Instruments Inc., Clifton, NJ, USA) by inserting the probe 1 cm deep between the muscle temporalis and the skull anteriorly and laterally to the bregma suture. Sham operations were conducted as described previously (Moreira et al, 2005). Glucose was sampled from the tail vein every 10′ and measured with a glucose-monitoring device (HaeMedic, Munka Ljungby, Sweden). Blood glucose values in control, non-fasted 3-month-old naïve rats from both strains have been characterized previously in our colony and used as reference baseline values (Ling et al, 1998).
Real-Time Reverse Transcriptase-Polymerase Chain Reaction
Isolation of total RNA: Rats were rapidly decapitated 48 h after sham operation or EC, the brains were removed and the two hemispheres sectioned. The ipsilateral and contralateral cortices and hippocampii were dissected and homogenized in TRIzol® Reagent (Invitrogen™ Life Technologies, Carlsbad, CA, USA) and stored at −80°C until extraction. Two separate experimenters performed mRNA extraction and real-time RT-PCR masked to the testing groups. Sample mRNA extraction was performed in a randomized fashion regarding strain and brain structures within 1 week after freezing to normalize the time of freezing between samples. All real-time RT-PCR runs were performed within 2 months after cDNA synthesis, also in a randomized fashion (brain structure/strain). Total RNA was extracted according to the manufacturer's protocol. To remove residual genomic DNA from the samples, a DNase I treatment (Ambion Inc., Austin TX, USA) was performed using the manufacturer's instructions. The concentration of RNA in each sample was measured with a spectrophotometer (Ultrospec III, Pharmacia LKB, Sweden) at 260 nm. The samples from each hemisphere were used for cDNA synthesis.
First strand cDNA synthesis: Reverse transcription of 2 μg of RNA from each sample was allowed for 1 h at 37°C using random hexamer primers (pd(N)6; Pharmacia Biotech, Uppsala, Sweden) and 200 U Moloney murine leukemia virus reverse transcriptase (Promega, Madison, WI, USA) in a 25 μL reaction volume in the presence of RNase inhibitor (Promega) and equimolar (2.5 mmol/L) nucleotide triphosphates. Resulting cDNA samples were brought to 50 μL using Rnase-free water.
Real-time reverse transcriptase-polymerase chain reaction: The first samples (cortex or hippocampus) of the contralateral hemispheres of compressed Wistar (Wis + EC, n = 5), compressed GK (GK + EC, n = 5), and sham uncompressed Wistar (U-Wis, n =4) were designated for the standard curves in each PCR experiment. These samples were serially diluted (1:1, 1:4, and 1:16), whereas all the other samples were diluted 1:4 so their values would distribute within the range of the standard curve. For the PCR assay, 2 μL of the standard curve cDNA dilutions and the target samples were mixed with 2 μL of nucleotide triphosphates (dNTPs), Hot-start Taq polymerase, reaction buffer, and SYBR Green I dye (LightCycler DNA Master SYBR Green® I kit, Roche, Mannheim, Germany) and placed into individual LightCycler glass capillaries. The reactions were supplemented with 3 or 4 mmol/L Mg2+ (depending on the primer specifications) and 0.5 μmol/L of each gene-specific primer (forward and reverse). Selected gene-specific primers were HO-1, HO-2, BVR, iNOS, SOD-1, SOD-2, TNFα, and Bax (see Table 1). Sequences were confirmed using a basic local alignment search tool (BLAST) in the GenBank database (NCBI, Bethesda, MD, USA). Reaction mixtures were brought to 20 μL with sterile water and capillaries were sealed.
Forward and reverse oligonucleotide sequences of target gene primers
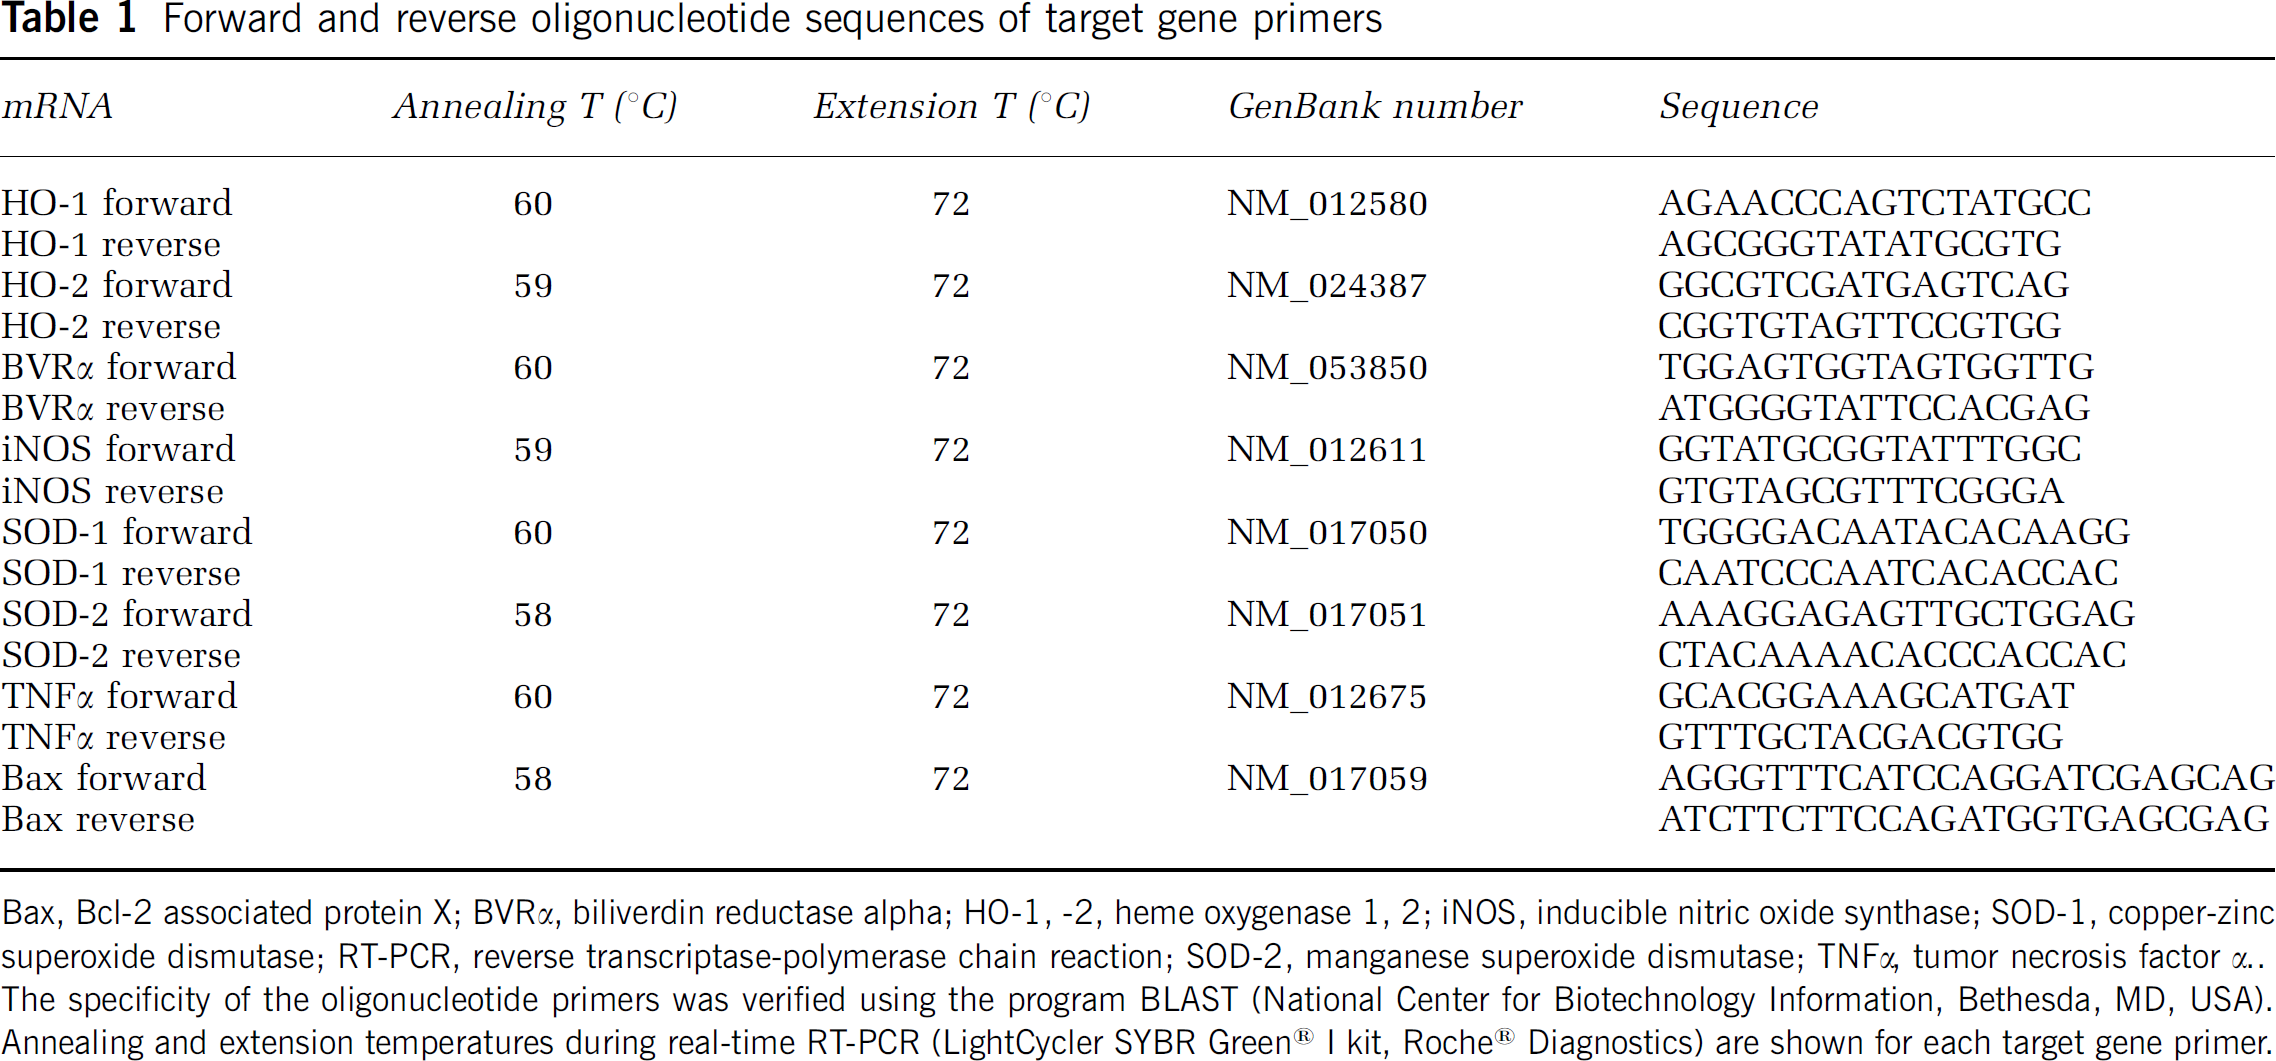
Bax, Bcl-2 associated protein X; BVRα, biliverdin reductase α HO-1, −2, heme oxygenase 1, 2; iNOS, inducible nitric oxide synthase; SOD-1, copper-zinc superoxide dismutase; RT-PCR, reverse transcriptase-polymerase chain reaction; SOD-2, manganese superoxide dismutase; TNFα, tumor necrosis factor α. The specificity of the oligonucleotide primers was verified using the program BLAST (National Center for Biotechnology Information, Bethesda, MD, USA). Annealing and extension temperatures during real-time RT-PCR (LightCycler SYBR Green® I kit, Roche® Diagnostics) are shown for each target gene primer.
Baseline gene expression: Samples of ipsilateral uncompressed Wistar and GK rat brains (cortex or hippocampus) were run with one designated uncompressed, sham Wistar rat as standard curve for strain comparison (comparison of changes in gene expression of uncompressed, sham animals).
Compression-induced gene expression: Samples of ipsilateral, compressed hemispheres (cortex or hippocampus) were run with the designated contralateral hemisphere as standard curve for compressed rats, in each strain (comparison of changes in gene expression between the two hemispheres of compressed animals). The cycles of PCR reaction were run with automatic fluorescence emission after each PCR cycle (see Table 1 for details). Melting curve analyses were performed after the completion of cycling to control for the specificity of the PCR products obtained (data not shown).
Primer sequences and LightCycler parameters: Sequences and LightCycler parameters for the RT-PCR primers are shown in Table 1. Primers were custom-synthesized by TAG Copenhagen AS (Copenhagen, Denmark). The primer pair for the QuantumRNA™ Universal 18S reference gene (315 bp) was purchased from Ambion.
Western Blotting
Protein isolation: Cortex and hippocampus, ipsi, and contralateral to the lesioned hemisphere were dissected from uncompressed, sham Wistar (n = 4), and sham GK rats (n = 4) and from Wistar + EC (n = 5) and GK + EC rats (n = 5) at 48 h of reperfusion. Tissues of the respective brain areas were pooled and samples were homogenized in ice-cold lysis buffer A, (0.01 mol/L Tris—HCl, 0.320 mol/L sucrose, and 0.005 mol/L ethylenediaminetetraacetic acid, 0.1 mmol/L phenylmethylsulfonyl fluoride, 1 μg/mL proteinase inhibitors (aprotinin, leupeptin, and pepstatin A), pH 7.4) using a Polytron™ homogenizer (15 secs at setting 5). After centrifugation at 3,000 r.p.m. for 20′ (4°C), the supernatant was collected and centrifuged at 20,000 r.p.m. for 20′ (4°C). The supernatant was discarded and the pellet was washed twice with 10 mL of ice-cold lysis buffer B (0.01 mol/L Tris—HCl, 0.005 mol/L ethylenediaminetetraacetic acid, 0.1 mmol/L phenylmethylsulfonyl fluoride, and 1 μg/mL proteinase inhibitors (aprotinin, leupeptin, pepstatin A, pH 7.4) by resuspension and centrifugation. An aliquot (5 μL) from each sample was used for protein concentration measurement using the Bio-Rad kit (Bio-Rad Laboratories, Hercules, CA, USA). A specific volume of loading buffer (4% sodium dodecyl sulfate, 20% glycerol, 10% β-mercaptoethanol, 0.01% Bromophenol Blue, 10 mmol/L Tris—HCl, pH 6.8) was added to the final pellet to obtain 5 μg of protein per microliters. The samples were then re-homogenized and stored at −80°C.
Immunoblot analysis: The protein samples were heated at 80°C for 5′ and loaded (25 μg/lane) together with Precision plus® protein standard (Bio-Rad Laboratories) on 10% Ready Gel Tris—HCl Gel (Bio-Rad Laboratories) submerged in running buffer (0.1 mol/L Tris-HCl pH 8.3, 0.1 mol/L glycine, 0.02 mol/L sodium dodecyl sulfate). Electrophoresis was allowed at 100 V for 2 h. Proteins were then transferred to PolyScreen polyvinylidene difluoride membranes (DuMedical Scandinavia, Stockholm, Sweden) washed (2 × 10′) in Tris-buffered saline/Tween 20 (TBS-T; 20 mmol/L Tris; 150 mmol/L NaCl; 0.1% Tween 20, pH 7.4) and incubated for 1 h in Blotto containing 5% dry milk in TBS-T. The membranes were then incubated for 2 h in a Blotto solution of mouse purified monoclonal antibody against the HO-1 protein (1:250, mouse anti-rat HO-1/Hsp32, OSA-111, Stressgen Laboratories, Nordic Biosite, Täby, Sweden) washed (3 × 10′) in TBS-T and incubated for 1 h in Blotto solution of anti-mouse horseradish peroxidase-conjugated secondary antibody (1:20,000; Santa Cruz Biotechnology, Santa Cruz, CA, USA). Finally, the membranes were washed (3 × 10′) in TBS-T, incubated in substrate solution (ECL plus Western Blotting detection system; Amersham Biosciences, Piscataway, NJ, USA) for 5′, and exposed to Hyperfilm® ECL (Amersham Biosciences). The membranes were subsequently incubated in stripping buffer (62.5 mmol/L Tris—HCl, 2% sodium dodecyl sulfate, 100 mmol/L β-mercaptoethanol, pH 6.8), washed (3 × 10′) in TBS-T and reprobed with β-actin antibody (1:5,000, BD Biosciences, San Diego, CA, USA). Heme oxygenase-1 protein and β-actin had the expected size (~33 and 40 kDa, respectively). The levels of immunoreactivity for HO-1 and β-actin were quantified densitometrically.
Histochemistry
Two separate groups of GK and Wistar rats were subjected either to EC or sham operation for histological studies at 48 h of reperfusion (five GK and five Wistar) and 48 h after sham operation (three GK and four Wistar). Briefly, animals were anesthetized with sodium pentobarbital and perfused via the ascending aorta with phosphate-buffered saline (PBS), followed by 4% paraformaldehyde. Brains were cryoprotected by transferring them from 10% to 20% to 30% sucrose in PBS solutions. Brain weight (in gram) was measured in both strains with a high precision scale (Mettler AE 260 Delta Range, Mettler-Toledo, Greifensee, Switzerland). Both cerebral hemispheres were cut in sagittal sections on a freezing microtome at −24°C (Zeiss® Microm, Germany), starting 1,200 μm from the lateral surface of the brain. All slices were cut 12 μm thick. Distance between the collected sections was 100 μm. Sections were mounted onto Superfrost® Plus glass slides (Fisher Scientific, Pittsburgh, PA, USA).
Immunohistochemistry
The sagittal brain sections from GK and Wistar rats 2 days post-EC or -sham operation were selected for immunohistochemistry. Sections were immunostained with monoclonal HO-1 antibody (mouse anti-rat HO-1/Hsp32, OSA-111, Stressgen Laboratories, Nordic Biosite, Täby, Sweden) to detect and localize HO-1 expression, in combination with either (1) red fluorescent Nissl staining (NeuroTrace®, Molecular Probes, Eugenen, OR, USA) to detect neuronal cells; or (2) monoclonal glial-fibrillary acid protein antibody (mouse anti-rat GFAP; Sigma®, St. Louis, MI, USA) to detect intermediate cytoskeleton filaments of astrocytes; or (3) monoclonal antibody OX42 (mouse anti-rat CD11b #MCA275R, Serotec, Oxford, UK) to detect the complement receptor 3 (CR3; CD11b) expressed by activated microglia. After rehydration in PBS solution for 40′ at room temperature (RT), sections were incubated in blocking and permeabilizing solution (PBS, 5% normal goat serum, 1% bovine serum albumin and 0.1% Triton X-100, pH 7.4 for 1 h at RT. Primary antibodies were diluted in PBS, 0.1% Tween, 1% bovine serum albumin, pH 7.4 (HO-1: 1/400, GFAP: 1/500, OX-42: 1/100) and the preparations were incubated overnight at 4° C.
Double fluorescence immunolabelling: Secondary antibodies were diluted in PBS, 0.1% Tween, 1% bovine serum albumin, pH 7.4 (Alexa 488 goat anti-mouse IgG 1/500 for HO-1, Alexa 546 goat anti-mouse IgG 1/500 for GFAP and OX-42, Molecular Probes). After rinsing in PBS (3 × 5′), sections were incubated with the secondary antibodies for 2 h at RT in the dark.
Fluorescent Red Nissl staining: After rinsing in PBS (3 × 5′), the brain slices were incubated with NeuroTrace® (× 50 dilution in PBS) for 20′ at RT in the dark. After incubation, the preparations were immersed in PBS + 0.1% Triton X-100, pH 7.4 for 10′, rinsed in PBS (3 × 5′), and kept in PBS for 2 h at RT.
Mounting medium and counterstaining: After rinsing with PBS (3 × 5′) and distilled water for 5′, sections were mounted in Vecta-Shield® mounting medium (Vector Lab, Burlingame, CA, USA) with 4′,6-diamidino-2-phenylindole nucleic acid stain (dihydrochloride) to detect cellular nuclei. Immunocytochemical controls in all cases consisted of one section per slide treated as described above except for the incubation with primary antibodies where controls were incubated with buffer only.
Microscopy
Sections were examined using an Olympus BX61TRF microscope (Olympus Optical AB, Solna, Sweden) equipped with epifluorescence single band filter sets and F-view monochrome CCD camera. Both image acquisition and analysis were performed by Analysis Auto software (Soft Imaging System, Munster, Germany).
Data Analysis
Two-way analysis of variance (repeated measures) was employed to compare weight gain, blood glucose levels, and rCBF (strain × time) followed by Bonferroni's test for multiple comparisons. A two-tailed unpaired t-test, 95% (confidence interval) CI, was used to compare average brain and body temperature during EC, optical density ratios of protein immunoblots, and brain weight.
Real-time RT-PCR analysis: For each brain area, expression levels of the housekeeping gene ribosomal 18S were determined in each contralateral area of the EC-Wis, EC-GK and U-Wis groups to establish a baseline expression level for each sample. Values for the target genes under study were then normalized to the 18S expression value (ratio target gene/18S) for each hemisphere. Differences between ipsilateral and contralateral hemispheres in both strains were analyzed with two-way analysis of variance followed by Bonferroni's test by comparing ipsi versus contralateral target gene/18S ratios for each specific primer. The target gene/18S ratio of the contralateral hemisphere of each rat was set to 1 and the correspondent ipsilateral value was then calculated as a fold variation of the contralateral ratio, for each rat and each target gene. Statistical calculations were performed using GraphPad-Prism® 4.0 (GraphPad Software Inc., San Diego, CA, USA). Data are presented as mean ± s.e.m.
Results
General Characterization of Goto—Kakizaki and Wistar Rats
Weight gain and extradural compression: Age-matched GK rats weighed significantly less than Wistar rats before EC, on the day of compression and thereafter (F(1,9) = 5.54, P = 0.046, Table 2). There was significant weight loss in both strains on D2 after EC (F(3,27) = 28.48, P < 0.0001), which was approximately 3.8% in GK and 4.3% in Wistar rats.
Weight gain (in gram) in diabetic GK and healthy Wistar rats before and after extradural compression
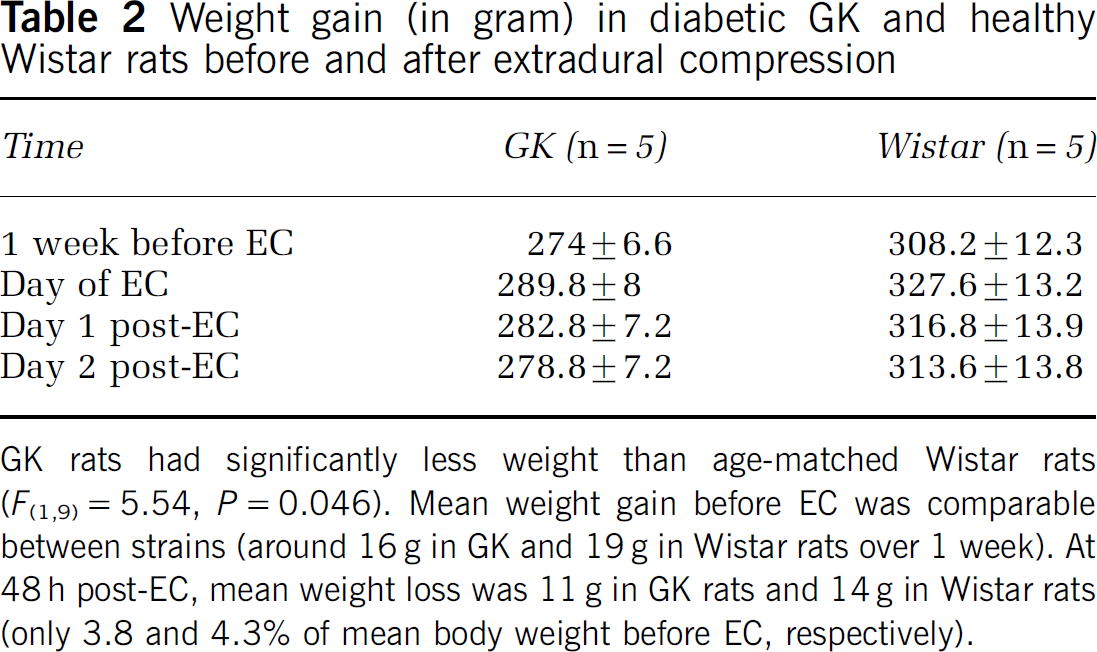
GK rats had significantly less weight than age-matched Wistar rats (F(1,9) = 5.54, P = 0.046). Mean weight gain before EC was comparable between strains (around 16 g in GK and 19 g in Wistar rats over 1 week). At 48 h post-EC, mean weight loss was 11 g in GK rats and 14 g in Wistar rats (only 3.8 and 4.3% of mean body weight before EC, respectively).
Blood glucose levels after anesthesia (baseline) and during compression: GK + EC rats displayed increased blood glucose concentrations during EC compared with Wis + EC rats (strain: F(1,17) = 64.83, P < 0.0001, time: F(5,85) = 20.19, P < 0.0001), which were significantly higher at 20′ of EC (28.24 ± 1.29 versus 7.36 ± 0.29 mmol/L, respectively, P < 0.05), 30′ of EC (35.84 ± 3.95 versus 7.08 ± 0.38, respectively, P < 0.001) and at 10′ after reperfusion (35.8 ± 3.93 versus 7.26 ± 0.38, respectively, P̼ 0.001, Table 3).
Blood glucose levels (in mmol/L) during anesthesia and extradural compression
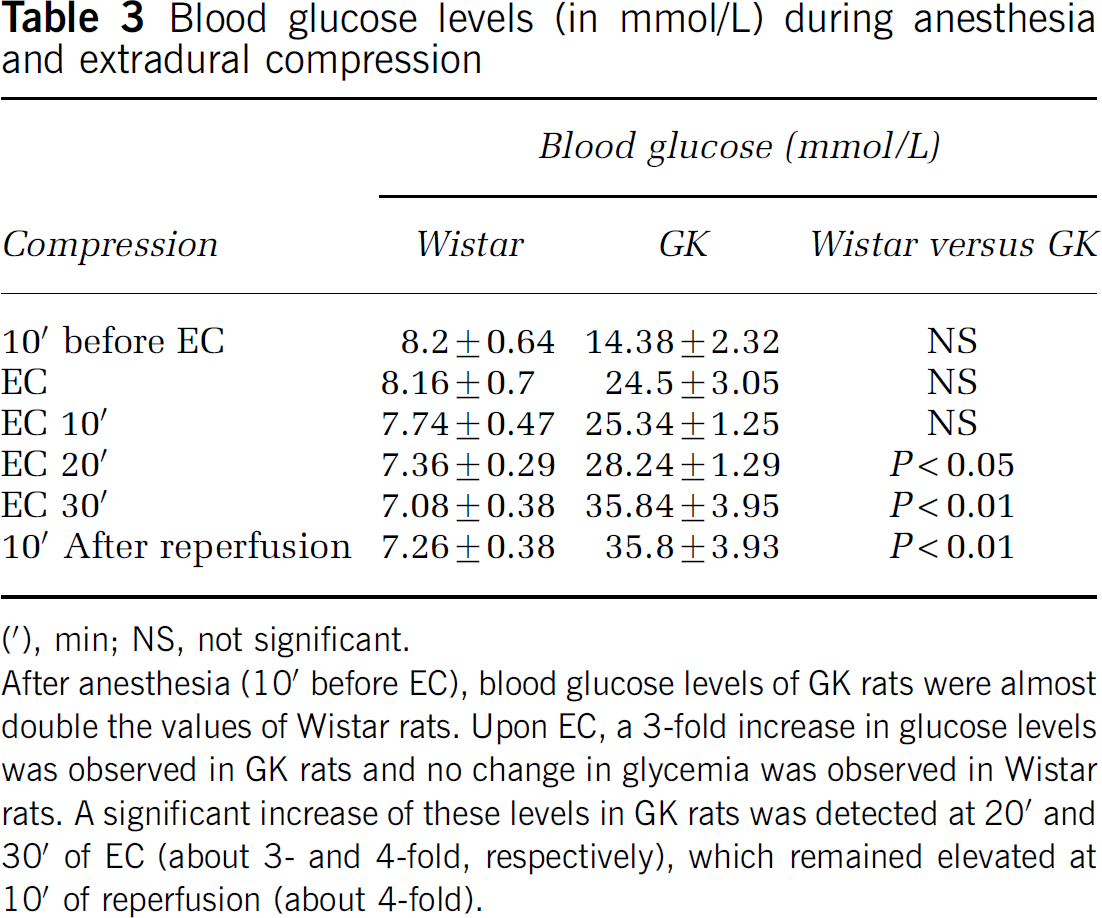
(′), min; NS, not significant.
After anesthesia (10′ before EC), blood glucose levels of GK rats were almost double the values of Wistar rats. Upon EC, a 3-fold increase in glucose levels was observed in GK rats and no change in glycemia was observed in Wistar rats. A significant increase of these levels in GK rats was detected at 20′ and 30′ of EC (about 3- and 4-fold, respectively), which remained elevated at 10′ of reperfusion (about 4-fold).
Body and brain temperature duringsurgery: Average mean ± s.e.m. body temperature was 37.7 ± 0.04°Cin GK rats and 37.3 ± 0.16°C in Wistar rats during EC. Brain temperatures in both strains varied from 34.5 to 34.6°C. Both body and brain temperatures did not differ significantly between GK and Wistar rats during compression (unpaired, two-tailed, t-test α = 0.05, t = 2.16, P = 0.063).
Regional cerebral blood flow in the cortex: Cortical blood flow was significantly reduced in both strains during EC (Figure 1). Cortical rCBF decreased to 4.7 ± 0.5% and 7.2 ± 1.1% in Wistar and GK rats, respectively, when the compression piston was lowered 3 mm into the cortical surface. During compression, rCBF remained decreased in both strains but gradually increased to 10.7 ± 2% in Wistar rats and 17.2 ± 4% in GK rats after 30′ of EC. No significant differences in rCBF during compression (0 to 30′) were detected between strains (Bonferroni's post-hoc test, NS). On reperfusion, Wistar rats displayed a significantly higher increase in rCBF than GK rats (158.9 ± 23.3% versus 81.1 ± 5.3%, respectively, F(1,9) = 5.21, P = 0.024, P < 0.01 at −0.5 mm and P < 0.001 at 0 mm). After 5′ of reperfusion, rCBF values were still lower in the GK strain (120.1 ± 9.8% in Wistar and 94.4 ± 3.7% in GK rats).
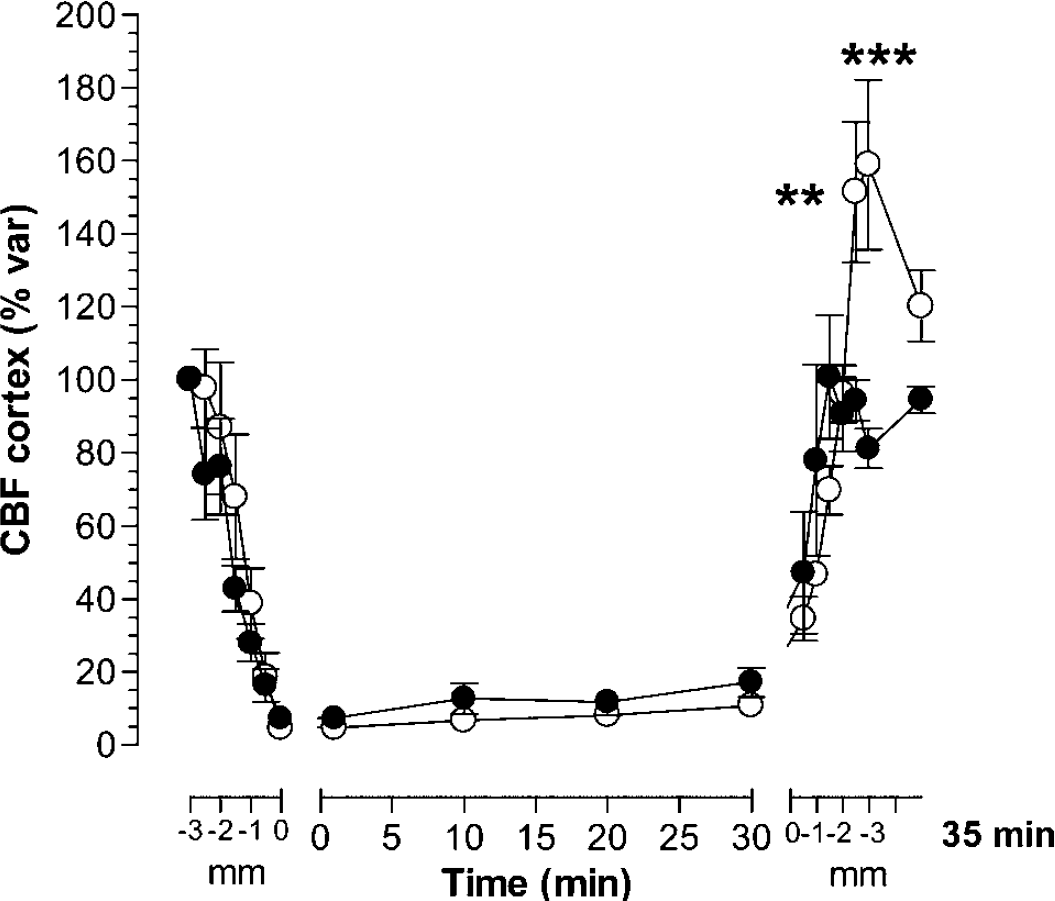
Changes in regional cerebral blood flow (rCBF) during EC. • K, GK (n = 5); ○, Wistar (n = 5) rats. Cortical rCBF consistently decreased in both strains on EC (4.7 ± 0.5% in Wistar and 7.2 ± 1.1% in GK rats). At 30 mins of compression, rCBF was 10.7 ± 2.0% in Wistar and 17.2 ± 4.0% in GK rats. No significant differences in rCBF during compression were detected between strains. During piston removal, Wistar rats displayed a significantly higher increase in rCBF than GK rats at −0.5 and 0 mm of compression depth (151.4 ± 19.1% versus 94.2 ± 5.6% and 158.9 ± 23.3% versus 81.1 ± 5.3%, **P < 0.01 and ***P < 0.001, respectively). After 5 mins of reperfusion, rCBF returned to baseline values in GK rats (94.4 ± 3.7%) but remained slightly elevated in Wistar rats (120.1 ± 9.8%).
Real-Time Reverse Transcriptase-Polymerase Chain Reaction
Baseline gene expression: Cortex. Target gene/18S ratios in the ipsilateral cortices were significantly different between strains (F(1,7) = 10.56, P = 0.0021). Sham GK rats showed higher expression of a subset of target genes such as HO-1, iNOS, and TNFα (F(7,1) = 6.775, P < 0.0001, Figure 2A).
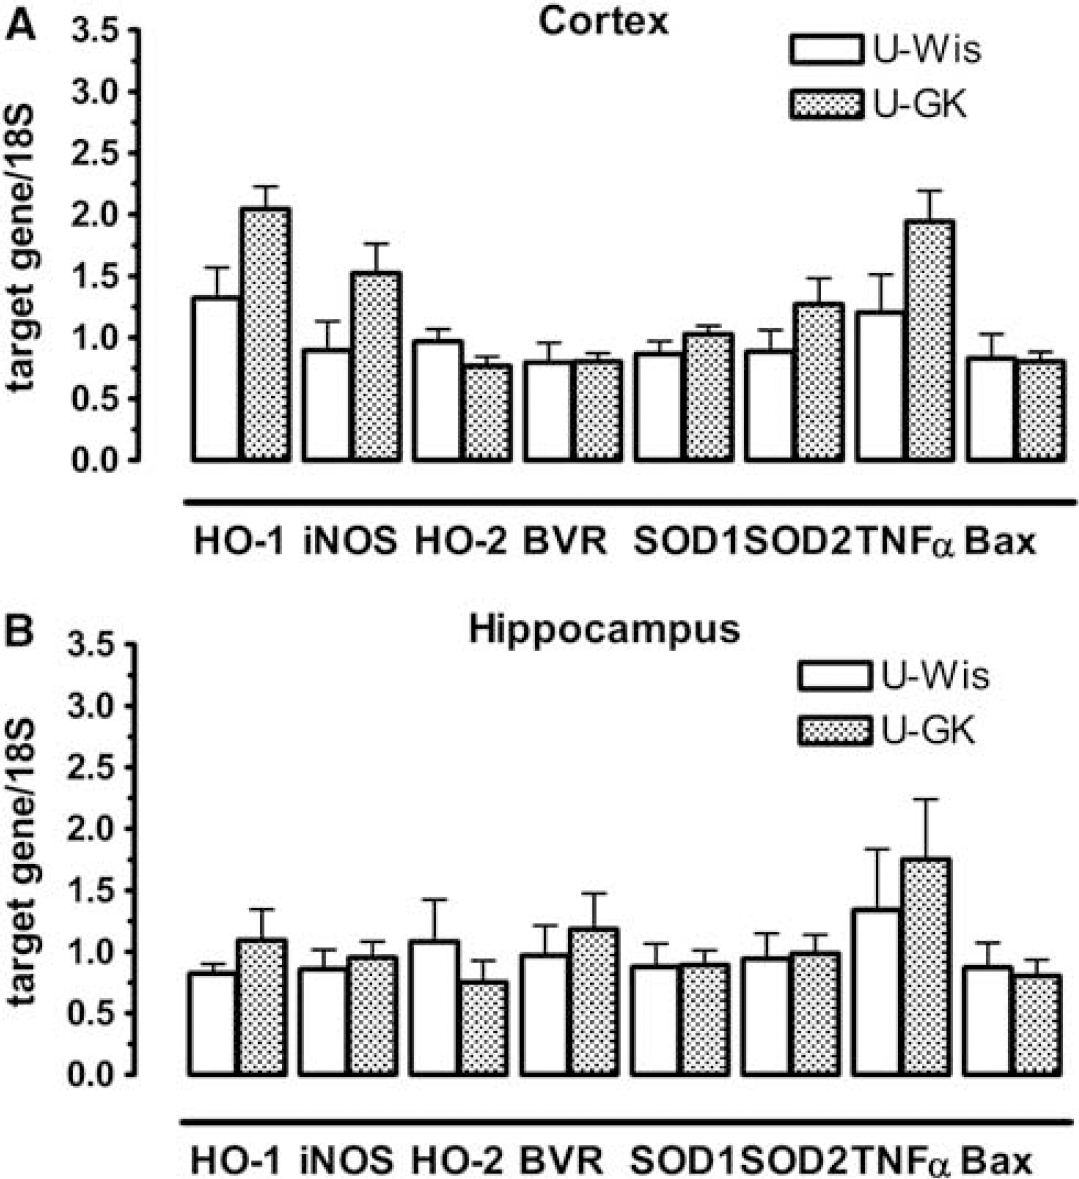
Baseline gene expression in uncompressed Wistar and GK rats. U-Wis, uncompressed Wistar rats (n = 4); U-GK, uncompressed GK rats (n = 4); target gene/18S (***Y axis), ratio between target gene mRNA expression and reference gene 18S ribosomal mRNA expression in the ipsilateral cortex (i.e., relative mRNA expression). (
Hippocampus: No significant differences in the expression of the investigated genes were detected between strains (F(1,7) = 0.398, P = 0.531, Figure 2B). The variation in target gene expression was not significantly affected by the strain type (F(7,1) = 1.548, P = 0.174).
Compression-induced gene expression: Cortex. The HO-1/18S ipsi versus contralateral expression ratios were significantly increased to approximately seven to eightfold in the ipsilateral, compressed cortex of both strains (F(7,3) = 61.54, P < 0.0001) when compared with the contralateral, uncompressed hemisphere. The degree of increase in ipsilateral HO-1 expression was significantly higher compared with a1ll target genes in Wistar and GK rats (HO-2, BVR, iNOS, SOD-1 and −2, TNFα, and Bax, ### and ***,P < 0.001, respectively, Figure 3A). The increases in ipsilateral gene expression did not significantly differ between strains (F(1,9) = 0.067, P = 0.796). Compression-induced TNFα and Bax expression was comparable between strains.
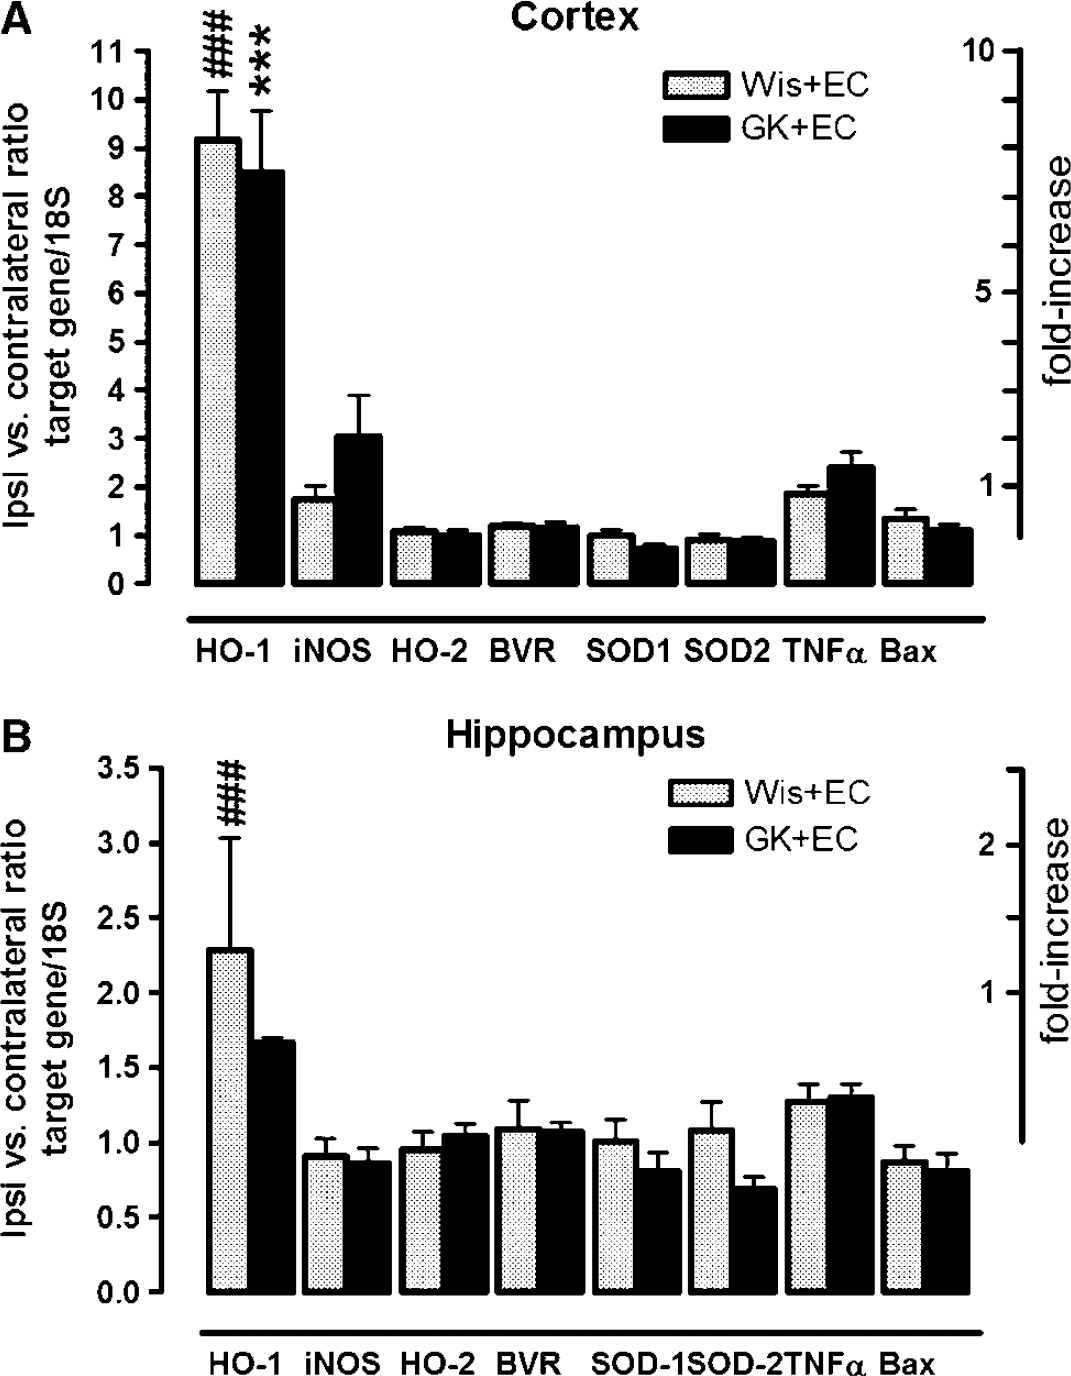
Compression-induced gene expression in Wistar and GK rats at 48 h of reperfusion from EC. Wis +EC, compressed Wistar rats (n =5) and GK+EC, compressed GK rats (n = 5). Ipsi versus contralateral ratio target gene/18S (left Y axis), ratio between ipsilateral target gene/18S ratios and contralateral target gene/18S ratios (variation between compressed and uncompressed hemipsheres). (
Hippocampus: The HO-1/18S ipsi versus contralateral expression ratios in the hippocampus were significantly increased to approximately 1.5- to 2.5-fold in both strains (###P < 0.001, F(7,3) = 6.001, P < 0.0001; Figure 3B) relative to the contralateral hippocampus. The increases in ipsilateral gene expression did not significantly vary between strains (F(1,9) = 1.941, P = 0.168). Compression-induced iNOS, TNFα, and Bax expression levels were comparable between strains.
Western Blotting
Immunoblotting at 48 h after reperfusion revealed induction of HO-1 protein expression in the ipsilateral cortices of both GK and Wistar rats and absence of HO-1 protein expression in the contralateral cortices of both rat strains. Expression of β-actin protein was detected in both cortical hemispheres of both strains (Figure 4, left panel). No induction of HO-1 protein was detected in the ipsi and contralateral hippocampii of both strains (not shown). Densitometric analysis at 48 h after reperfusion revealed a significant reduction of the HO-1/β-actin optical density ratios in the ipsilateral cortices of GK + EC rats compared with Wistar + EC rats (Figure 4, right panel; 0.86 ± 0.24 versus 0.15 ± 0.07 mm, P = 0.03).
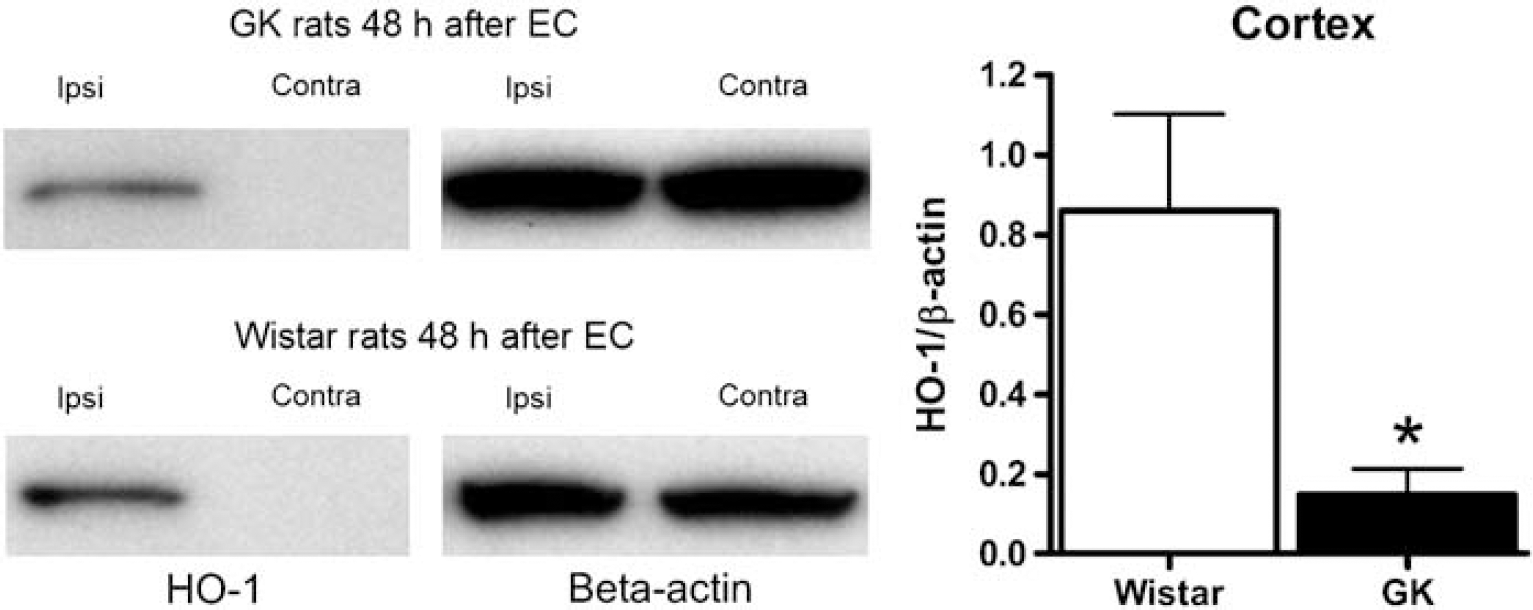
Heme oxygenase-1 protein expression in the cortex at 48 h of reperfusion from EC. Left panel: HO-1 protein expression was only detected in the ipsilateral cortices of rats subjected to EC from both diabetic (n = 5) and non-diabetic (n = 5) strains. Control expression of β-actin protein was observed in both cortical hemispheres of both strains. Right panel: HO-1/ β-actin ratios were significantly reduced in GK rats (P < 0.05), indicating lower HO-1 protein expression in the cortex of diabetic animals after reperfusion. The lack of HO-1 protein expression in the uncompressed, contralateral hemisphere is in line with previous studies where HO-1 expression was undetectable in control and sham animals, or in unlesioned brain structures (Lu and Ong, 2001).
Immunohistochemistry
Mean brain weights of Wistar and GK rats were 1.814 ± 0.067 and 1.887 ± 0.028g, respectively. No significant differences in brain weight were detected between strains (unpaired, two-tailed, t-test, α = 0.05, t = 1.181, P = 0.282).
Heme oxygenase-1 and fluorescent red Nissl double labeling: A rim of HO-1 staining was distributed around the primary lesion border in the cortex of both strains on D2 after EC (e.g., in Figure 5A). Heme oxygenase-1 expression appeared to be localized in non-neuronal, stellate structures, and no co-localization with Nissl staining was detected (Figure 5B). Sham-operated animals did not display cortical HO-1 immunolabeling (not shown). In the hippocampus, however, co-localization of HO-1 with a few interneurons in the hilus was observed in both hemispheres of compressed and sham-operated GK and Wistar rats (e.g., in Figure 5C).
Heme oxygenase-1 and glial-fibrillary acid protein double labeling: A similar pattern of HO-1 staining adjacent to the lesion border was observed in both strains (e.g., in Figure 5D). Heme oxygenase-1 expression was detected in stellate, ramified cells, and co-localized with GFAP-labeled astrocytes in the vicinity of the lesion (Figure 5E). Consistent HO-1/GFAP co-localization was also detected in reactive astrocytes in the lower cortical layers V (e.g., in Figure 5F), and less often, in cortical layer VI and pericallosal junction of both strains. No HO-1/GFAP co-localization was detected in the hippocampus or thalamus.
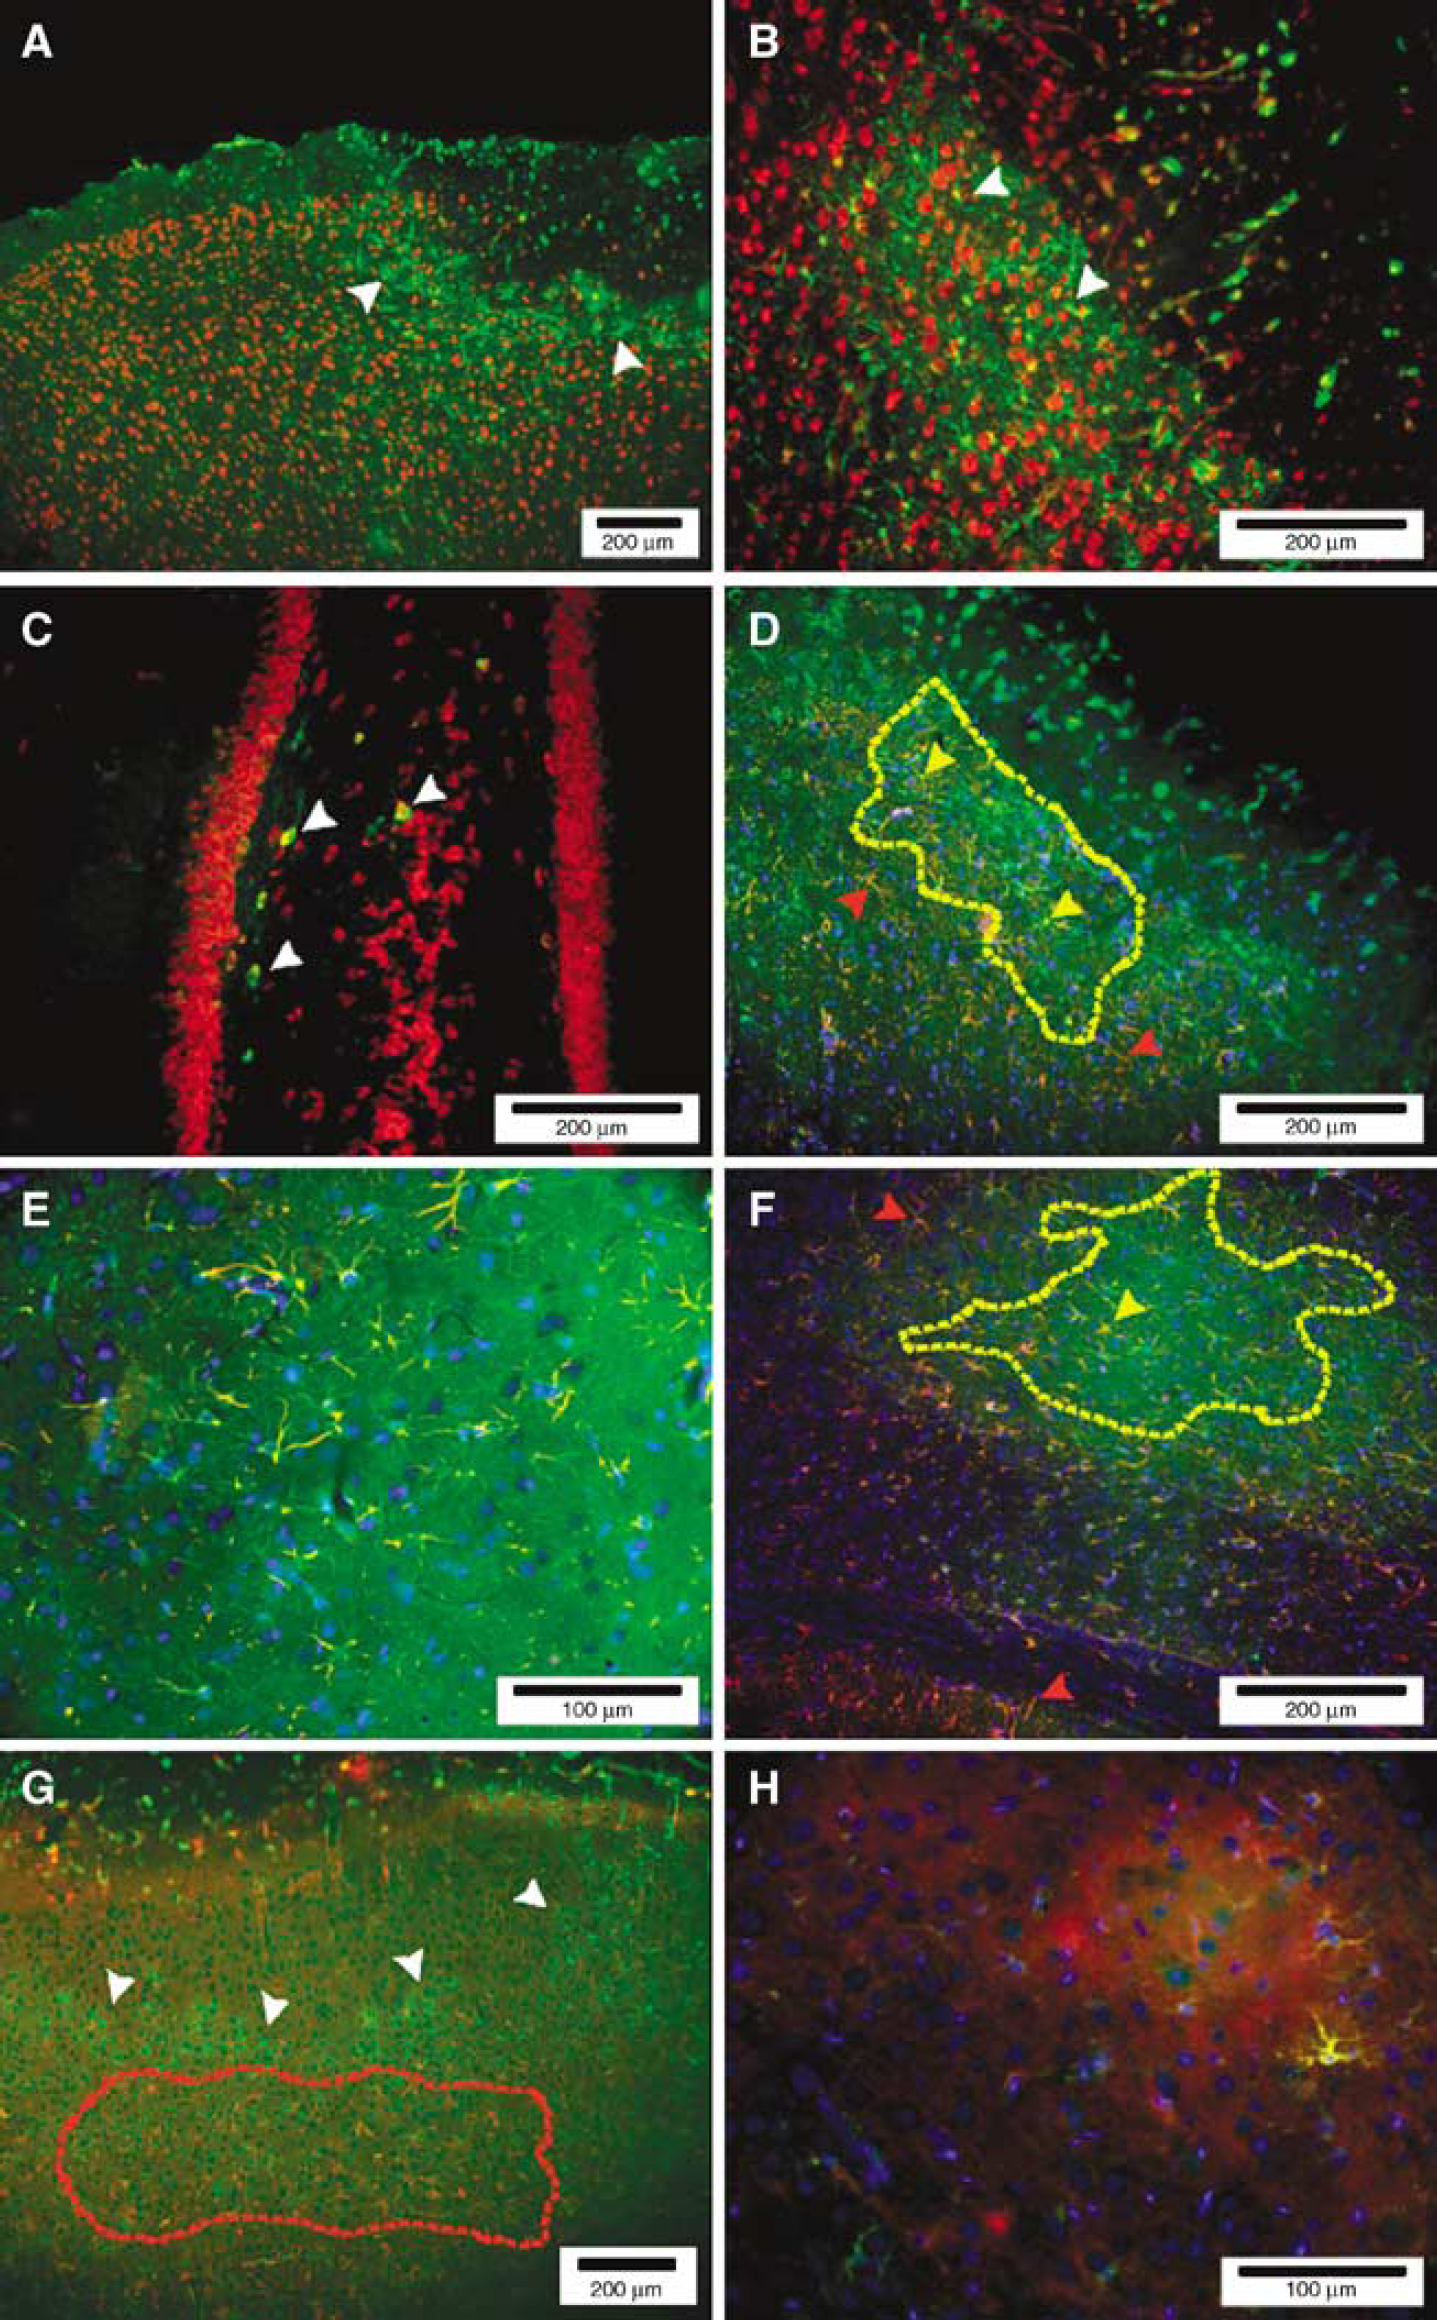
Heme oxygenase-1 double immunohistochemistry with fluorescent Nissl staining, GFAP and OX-42 at 48 h of reperfusion from EC. (
Heme oxygenase-1 and OX-42 double labeling: Microglial cells labelled by OX-42 were present in the surrounding borders of the lesion but did not overlap with HO-1 staining (Figure 5G). OX-42 + cells were organized in a more scattered, diffuse pattern below the rim of perilesional HO-1 staining. However, a few perilesional OX-42+ microglial cells were shown to co-localize with HO-1 labeling of microglia near the lesion borders (Figure 5H), showing ramified and round morphology.
No HO-1/OX-42 co-localization was observed in the hippocampus or thalamus.
Discussion
The main findings of this study can be summarized as follows: (1) GK rats displayed a hyperglycemic response during EC and after reperfusion, (2) cortical rCBF during reperfusion was significantly lower in GK rats, (3) cortical baseline expression of antioxidant and proinflammatory genes was significantly higher in uncompressed GK rats, (4) at 48 h after reperfusion, HO-1 was the main upregulated gene under study, whereas HO-1 protein was only upregulated in the ipsilateral cortex of non-diabetic Wistar rats, (5) the degree of ipsi versus contralateral upregulation of HO-1 gene expression induced by EC was comparable between GK and Wistar rats, and (6) the relative expression of Bax mRNA remained unchanged and was similar in both strains.
Blood Glucose Levels During Extradural Compression
Blood glucose levels were significantly higher in GK rats by the end of the compression period and after 10 mins of reperfusion (approximately 36 mmol/L). In contrast, blood glucose levels tended to decrease in Wistar rats, remaining at approximately 7 mmol/L during reperfusion. In our colony, baseline glucose levels vary around 9 ± 0.6 mmol/L in 3-month-old GK rats and 5.6 ± 0.2 mmol/L in age-matched Wistar rats (Ling et al, 1998). Thus, EC-induced brain injury was accompanied by a hyperglycemic response only in diabetic rats.
Cortical Reperfusion after Extradural Compression
Reperfusion of EC proved to be time limited (5 mins) in both strains, with a lower degree of mean rCBF recovery observed in GK rats (from approximately 81% to 95%) when compared with Wistar rats (159 to 120%), in agreement with a previous study from our laboratory (Moreira et al, 2007). This is in contrast with a large body of studies showing extended hypoperfusion periods after brain ischemia. For instance, in a similar study of compression-induced ischemia of the somatosensory cortex, rCBF was decreased for 2 h after reperfusion (Watanabe et al, 2001). Reductions of rCBF to approximately 60% of pre-ischemic values for 2 h were also reported after reperfusion of MCA-O (Lerouet et al, 2002). The degree of rCBF reduction during brain injury was shown to correlate with the numbers of damaged neurons (Hotta et al, 2002) and with brain infarction size (Chen and Cheung 2002). The short-lasting period of reperfusion in our study thus supports our previous observations of a selective pattern of cortical neurodegeneration after EC when compared with other models of focal brain ischemia. It is unlikely that the lower degree of rCBF recovery in GK rats has influenced HO-1 expression in this strain since (1) mean rCBF only decreases to approximately 80% during reperfusion, and oxygen extraction from the blood can, in principle, be compensated by collateral circulation (Lipton 1999), (2) the time of reduced blood flow is short (less than 5 mins), and (3) HO-1 expression was measured later, at 48 h of reperfusion. Instead, microvessel disease and impaired blood flow regulation are known to occur in diabetes (Duckrow et al, 1987) and cannot be excluded as contributors to EC-induced injury in GK rats. Further experiments are required to compare absolute rCBF values under basal, physiological conditions between non-diabetic and diabetic rats, and to verify if decreased reperfusion in diabetic rats is also observed in other brain ischemia models, regardless of strain origin.
Baseline and Compression-Induced Heme Oxygenase-1 Gene/Protein Expression at 48 h of Reperfusion
Cortex: Relative mRNA expression of antioxidant enzymes was significantly higher in the cortex of sham, uncompressed GK rats, with HO-1 being the most upregulated gene in these animals. In a previous study of sham, uncompressed GK rats, with HO-1 being the most upregulated gene in these animals. In a previous study of permanent MCA-O in the mouse, increased BVR mRNA and protein immunoreactivity was demonstrated within the peri-ischemic surviving neurons at 6 h after occlusion, which decreased to approximately 50% in the following 12 to 24 h owing to neuronal loss (Panahian et al, 1999a). In our study, the absence of BVR mRNA upregulation after EC may reside on the later time point at which we studied gene expression. Another possibility might reside on the fact that this enzyme exists in excess in virtually all tissues, including the brain. The excess availability of BVR balances the tissue concentrations of bilirubin and biliverdin via redox cycling, which prevents biliverdin to accumulate at detectable levels (Baranano et al, 2002). The high levels of BVR may immediately reduce biliverdin to bilirubin and oxidate bilirubin back to biliverdin by redox cycling, balancing the availability of both bile pigments (Baranano et al, 2002). Recently, BVR was shown to be a tyrosine kinase and a substrate for the insulin receptor (Lerner-Marmarosh et al, 2005). In this regard, exogenous administration of insulin to human primary embryonic kidney cells was found to increase BVR activity, whereas BVR silencing with small interfering RNA increased insulin-mediated glucose uptake by these cells. This is of interest since BVR was formerly viewed as a reductase for the conversion of biliverdin, whereas it now seems to be a component of the insulin-signaling pathway. One can hypothesize that increased basal activity of BVR may exist in the intact brain of GK rats owing to the hyperinsulinemia characteristic of type 2 diabetes in the young GK rat, contributing to insulin resistance and reduced glucose uptake. In this study BVR activity was not measured, but at the mRNA level no differences in BVR gene expression were found between diabetic and non-diabetic strains both at baseline and at 48 h of reperfusion. It is not known at present if this is related to excess availability of BVR or to an adaptation to hyperinsulinemia. The young GK rat is thus a good candidate to test the modulation of BVR and glucose use in the presence of genetically determined hyperglycemia and hyperinsulinemia (Murakawa et al, 2002). On another note, the lack of significant changes in the mRNA expression of SODs in our experimental conditions are in agreement with a recent study of hyperglycemic focal brain ischemia in the rat where increased SOD-1 and −2 protein expression was observed early after ischemia, whereas mRNA expression of these genes remained unchanged (Bemeur et al, 2004). Overall, the present findings thus suggest that (1) constitutive hyperglycemia may induce HO-1 mRNA expression, (2) HO-1 upregulation may be an endogenous response to an increased pro-oxidant state, and (3) HO-1 could reflect an overall increase in heme degradation which may be caused by microvessel abnormalities characteristic of diabetes (Duckrow et al, 1987), however, such an increase of heme degradation in relation to alterations in the cerebral microvasculature of the GK rat has not yet been studied.
At 48 h of reperfusion, HO-1 was also the most upregulated gene in the cortex of both strains. The degree of HO-1 upregulation in the compressed hemisphere was similar for healthy Wistar and diabetic GK rats, that is 7.5- to 8.2-fold increase relative to the contralateral, uncompressed hemisphere. Among the heme oxygenases, HO-2 was postulated to be the primary source of defense against free radicals in the injured brain (Chang et al, 2003) due to its more extensive distribution in the brain and expression in neurons (Ewing and Maines, 1997). Heme oxygenase-2 expression levels, however, were not shown to vary after brain injury in contrast to robust HO-1 expression in astrocytes and microglia after brain trauma, ischemia, or hemorrhage (Beschorner et al, 2000; Geddes et al, 1996). Here, we provide further evidence that HO-1 is in fact the major HO enzyme to be induced in the after ischemic brain. On the basis of our current findings, a cytoprotective effect of HO-1 induction during the early phase of recovery of EC cannot be ascertained, but results obtained in other in vivo and in vitro models of brain injury and neuroinflammation are supportive of this notion (Min et al, 2006; Panahian et al, 1999b). In addition, we have previously reported that GK rats exhibit more severe neuronal death in the ipsilateral cortex at 48 h of reperfusion compared to Wistar rats (Moreira et al, 2007). This might constitute supplementary evidence for a neuroprotective action of HO-1 since we found reduced protein expression of this enzyme in the cortex of GK rats at 48 h of reperfusion which suggests a differential post-transcriptional regulation of HO-1 in the reperfused brains of diabetic rats. Interestingly, the apparent contradiction between increased HO-1 gene expression and low HO-1 protein levels in GK rats was described in other experimental models of diabetes. For instance, on endotoxin-induced uveitis in rats rendered diabetic with streptozocin, expression of HO-1 protein in ciliary bodies was dampened when compared with non-diabetic rats (Rossi et al, 2006). Another study of myocardial ischemia showed a similar discrepancy in HO-1 protein expression between non-diabetic and diabetic rats (Di Filippo et al, 2005). In these studies, streptozocin-diabetic rats had high HO-1 expression at baseline, which did not increase after an inflammatory or ischemic challenge. It was then suggested that if inflammation was superimposed on preexisting hyperglycemiamediated oxidative stress, the burst of HO-1 expression would be impaired in diabetic animals because diabetes per se already upregulates HO-1 expression. Furthermore, the lack of HO-1 protein overexpression may be attributed to the higher production of reactive oxygen species and reduced NO availability via peroxynitrite formation occurring in diabetes, as shown with myocardial ischemia in mice (Marfella et al, 2004). A modicum of caution is, however, necessary when proposing a neuroprotective role for HO-1 since detrimental, cytotoxic effects of HO-1 owing to increased sequestration of iron and oxidative stress were reported (e.g., Song et al, 2006). In this regard, HO-1 upregulation has been shown to promote apoptotic rather than necrotic cell death in neurons (Panahian and Maines, 2001). In this study, no significant variation in Bax mRNA expression in the compressed hemisphere was detected, indicating that, at least in our model, apoptotic cell death is not promoted by the Bax protein (Wolter et al, 1997). In support of this notion, HO-1 expression induced by spinal cord injury was shown to co-localize with the expression of the proapoptotic p53, Fas-associated protein containing death domain and TNF-related apoptosis-inducing ligand, suggesting that HO-1 induction may activate receptor-mediated, and not mitochondrial-mediated, apoptotic cell death (Panahian and Maines, 2001).
The levels of iNOS and TNFα mRNA expression after ischemia were not significantly different between strains, despite a tendency for higher mRNA expression of iNOS observed in ischemic GK rats (2-fold in GK versus 0.7-fold in Wistar rats, respectively). An explanation for this finding would be an earlier upregulation of both iNOS and TNFα mRNA (Iadecola et al, 1996; Liu et al, 1994), which could be already undetectable at 48 h of reperfusion. However, conflicting results of iNOS expression after cerebral ischemia in the adult rat exist in the literature. Increased iNOS mRNA levels after MCA-O were reported to occur from 12 to 48 h after ischemia in infiltrating neutrophils and vascular endothelial cells (Iadecola et al, 1996), whereas no iNOS activity was detected at 48 h in another study using the same ischemia protocol (Yoshida et al, 1995). One proposed explanation was that the differential levels of basal iNOS expression at the time of MCA-O induction resulted in different levels of iNOS synthesis (van den Tweel et al, 2005). In what concerns TNFα expression, a similar study of MCA-O in the Sprague—Dawley rat showed upregulation of TNFα in the ipsilateral hemisphere as early as 1 h, a peak increase to approximately 5-fold at 6 h, which was still significantly higher compared with the contralateral hemisphere at 24 h but not at 72 h of reperfusion (Berti et al, 2002). These findings may thus explain why in our study no significant differences were detected between compressed hemispheres at 48 h.
Hippocampus: Baseline expression of target genes in the hippocampus did not significantly differ between strains unlike what was observed in the cortex. This may be related to the greater extent of blood—brain barrier interactions in the latter structure, which potentially enhances hyperglycemia effects in brain gene expression.
After cortical ischemia, HO-1, and TNFα were the most upregulated genes in the ipsilateral hippocampii in both strains, but the variation in gene expression relative to the uncompressed hemisphere was of lower magnitude when compared with the variation observed in the compressed cortex. Relative mRNA expression of HO-1 and TNFα in both strains only increased 0.7 to 1.3-fold and 0.3 to 0.4-fold, respectively, in the ipsilateral hippocampii. The lack of HO-1 protein expression in the hippocampii of both strains may thus be related to the lower degree of HO-1 gene expression in this brain area. The lower variation in gene expression can be attributed to (1) bilateral damage to the hippocampus is observed after EC but is predominantly ipsilateral, (2) the EC-induced hippocampal lesions are discrete at 48 h of reperfusion when compared with cortical lesions (Moreira et al, 2005), and (3) neurodegeneration in the hippocampus was shown to increase on D5, D7, and D10 after EC, indicating that the majority of neuronal death occurring in this structure is delayed (Moreira et al, 2007) and may thus not be associated with gene expression changes at 48 h of reperfusion.
Cellular heme oxygenase-1 secretion and localization at 48 h of reperfusion: Heme oxygenase-1 expression was mainly localized in perilesional astrocytes. Heme oxygenase-1 expression in neurons did not seem to occur at this time point, with the exception of constitutive expression in hilar interneurons, a finding previously reported in mice (Maines et al, 1998). This is in agreement with previous studies of brain ischemia in control and transgenic animals, in which a pattern of HO-1 expression was found in astrocytes immediately around the primary lesion (Koistinaho et al, 1996; Matsuoka et al, 1998). The perilesional area was reported to be an area of increased lipid peroxidation and iron deposition, indicating the existence of heme degrading activity and free radical attack on cellular membranes (Panahian et al, 1999a). In this study, an agglomerate of cortical OX-42-labeled microglia was observed, occasionally expressing HO-1. The rare expression of HO-1 by activated microglia was located at the border of the lesion. Even though microglial expression of HO-1 was more commonly reported after brain trauma and subarachnoidal hemorrhage (Turner et al, 1998), microglial HO-1 expression was also described after focal brain ischemia (Koistinaho et al, 1996), which is also in agreement with clinical findings (Beschorner et al, 2000). Activated microglia were also shown to contain high levels of ferritin, which sequester iron released during HO activity degrading engulfed hemoproteins (Matsuoka et al, 1998).
Conclusions
Under basal conditions, 3-month-old diabetic GK rats showed significantly higher mRNA expression of antioxidant and proinflammatory genes, suggesting that oxidative stress and neuroinflammation already developed in these animals. Goto—Kakizaki rats showed a hyperglycemic response when subjected to EC and a lower degree of rCBF recovery in the first 5 mins of reperfusion. At 48 h of reperfusion, HO-1 was the main antioxidant gene upregulated in the ipsilateral cortex both in diabetic and non-diabetic rats subjected to EC. Heme oxygenase-1 secretion was predominantly located in astrocytes surrounding the borders of the lesions induced by EC. This suggests that astrocytes are the most important sources of HO-1 production after 48 h of reperfusion and constitute the first line of defense around lesions produced by focal brain ischemia, whereas microglial HO-1 activity can aid in the breakdown of hemoproteins contained in foreign engulfed material (Beschorner et al, 2000; Geddes et al, 1996). Diabetic GK rats showed significantly reduced HO-1 protein expression at 48 h of reperfusion, which, in association with the more severe neuronal degeneration in diabetic rats reported in our previous studies, provides further evidence for a neuroprotective role of this enzyme.
Footnotes
Acknowledgements
T.M. was a recipient of a fellowship from FCT—Fundação para a Ciência e Tecnologia, Portugal (European Social Fund QCA III, 2000–2006). Dr Sabine Dörhöfer (Roche Diagnostics, Sweden) and Johanna Sandström, MSc for technical support, Elisabeth Norén-Krog for assistance with GK rats.