
Abstract
Although functional magnetic resonance imaging (fMRI) is gaining use as a tool to assess cerebral recovery following various insults, the effects of potential confounders such as hypertension are poorly defined. We hypothesized that after stroke, transient hypertension during an fMRI study could produce a detected activation unrelated to neuronal activity within the infarct. Thus, the effect of norepinephrine induced increases in blood pressure (BP) on the fMRI response to forepaw stimulation were investigated in controls or 1 week after transient middle cerebral artery occlusion in rats. Images were smoothed spatially and voxels correlating to either forepaw stimulation or the change in BP time courses were analyzed. Transient hypertension increased the signal intensity and numbers of voxels correlating to the BP time courses within and adjacent to the ischemic infarct and these exceeded the response in the contralateral hemisphere or in controls. With left paw stimulation at normotension, there was a loss of activation in right sensory—motor cortex—a region with necrosis and disruption of cerebral vessels. As BP increased left paw stimulation also resulted in the detection of activation in the infarcted sensory—motor cortex and peri-infarct regions. Thus, BP changes synchronous with tasks in fMRI studies can result in MR signal changes consistent with a loss of cerebral blood flow (CBF) autoregulation rather than neuronal activation in necrotic brain. After stroke, the use of stressful tasks associated with BP changes in fMRI studies should be limited or the BP change should be considered as a potential source of MR signal changes.
Keywords
Introduction
Functional magnetic resonance imaging (fMRI) is proving to be a major technique for understanding the recovery of brain function after cerebral injury, in part owing to its ability to acquire high-resolution structural and functional activation maps in the same imaging session. Brain activation maps are acquired using fMRI by detecting local increases in MR signal intensity associated with local decreases in the concentration of deoxyhemoglobin—the blood-oxygen level dependent (BOLD)-MR signal intensity. The reductions in deoxyhemoglobin are associated with the increases in cerebral blood flow (CBF) evoked by the alterations in neuronal activity. Although fMRI has been useful in providing insights into brain plasticity and its reorganization during recovery from an injury such as stroke (Baron et al, 2004; Hodics and Cohen, 2005; Ward, 2005), it is possible that after neuronal or vessel injury, alterations in flow-metabolism coupling to increased neuronal activity or other factors can confound the interpretation of the fMRI results.
We demonstrated recently that if substantial alterations in arterial blood pressure (BP) accompany the task being assessed with fMRI, then there would be an enhancement of the activation response and at least a portion of this enhancement was considered to be related to direct effects of BP changes on CBF or the BOLD response (Wang et al, 2006). Although not clear how activation would be influenced by BP changes in injured brain, it is likely that brain recovering from an injury such as an ischemic stroke, will be even more susceptible to hypertension. The efficiency of the CBF autoregulatory response is impaired after tissue injury (Czosnyka et al, 2003; Dawson et al, 2003; Novak et al, 2004; Paulson et al, 1990) and in such a setting, a reduced cardiac baroreceptor sensitivity resulting in a greater increase in BP variability is also possible (Eames et al, 2002; Robinson et al, 1997). Thus, BP variations are likely to accompany fMRI studies in stroke patients, particularly if the tasks are known to be capable of eliciting hypertensive responses (e.g., cold, pain, exercise, or stress associated with mental tasks) (Allen et al, 1992; Carter et al, 2005; Critchley et al, 2000; Williamson et al, 2003). It is therefore imperative to understand in some detail the effect of hypertension on the fMRI activation response, both within infarcted brain and surrounding tissue.
Thus the aim of this study was to investigate systematically the potential effect of an unstable BP during fMRI studies on the activation detected subacutely after stroke. We hypothesized that after stroke, a simultaneous transient hypertension accompanying a task performed in an fMRI study would enhance the pattern of activation in regions both within and adjacent to injured brain. The effect of various magnitudes of transient hypertension on the fMRI response to forepaw stimulation was investigated in rats 1 week after middle cerebral artery (MCA) occlusion. The results show that after stroke, moderate transient BP increases during an fMRI study can result in the detection of an apparent cerebral activation response in damaged brain unrelated to alterations in neuronal activity.
Materials and methods
All care and use of animals was approved in accordance with the Canadian Council for Animal Care Guidelines, and the protocol was reviewed and approved by both National Research Council (NRC) and University of Calgary animal care committees. Male Wistar rats (310 to 335 g, Charles River, Saint-Constant, Quebec, Canada) were randomized to a control group (sham surgery, n = 5) or a stroke group (MCA occlusion, n = 10).
Animal Model of Focal Cerebral Ischemia
Animals were anesthetized by nose cone (3% isoflurane/27% oxygen/70% nitrogen) and prepared for aseptic surgery. The tail artery was cannulated for monitoring BP, heart rate, and obtaining arterial blood samples for blood gas determination during the surgery. Both the left and right common carotid arteries were isolated with loops of 3–0 suture and the MCA was exposed proximal to its crossing of the rhinal fissure. For sham animals, surgery was the same except clip placement was omitted. Rats subjected to transient ischemia, underwent 60 mins of occlusion of the MCA with a microaneurysm clip (No. 1 Codman) along with concurrent tightening of the ligature on both common carotid arteries. After 60 mins, the animal was reanesthetized, the MCA clip was removed and the ligature was removed from around both carotid arteries. Cortical perfusion was measured using laser Doppler flowmetry before and after the clip was placed and removed. Normothermia (rectal temperature near 37.5°C) was maintained throughout the surgery and for at least 1 h after ischemia using a heating lamp. Postsurgical analgesia was provided by administration of butorphenol (2 mg/kg, intramuscular every 4 to 6 h as required).
Standard and Functional MR Imaging
Two days after focal ischemia, animals were anesthetized with isoflurane and scanned using a 9.4T/21 cm bore MR system with a Bruker console. T2-weighted images were acquired using a multislice, 21 multiecho spin echo sequence (TR (repetition time) = 2500 ms, TE (echo time) = 10 ms between echos, field of view = 3 × 3 cm, slice thickness = 1.5 mm) to assess ischemic damage and ensure the presence of a cortical infarct in the right hemisphere. Infarct volume was measured from these T2-weighted images using software (Marevisi) developed locally within the Institute for Biodiagnostics. Data are presented as mean ± s.d.
Animals were allowed to recover for approximately 1 week (6 to 7 days) after ischemia. This time was selected to allow recovery from the acute stroke injury and model some of the earliest times assessed with fMRI after stroke in patients (Binkofski and Seitz, 2004; Jaillard et al, 2005; Tombari et al, 2004). At this time, animals were prepared for functional MR imaging using methods similar to those described previously [check why this format] (Wang et al, 2006). Briefly, under isoflurane anesthesia, the femoral veins and artery were cannulated for administering drugs and fluids, measuring BP and obtaining arterial blood samples. Rats were intubated and then mechanically ventilated to maintain normal PaO2 and PaCO2. Surgical sites were infiltrated with bupivicaine. Rectal body temperature was maintained at 37°C ± 0.5°C with a circulating water blanket. The rat was moved to an MR cradle where the head was immobilized using ear pins and an incisor bar. Anesthesia was then converted to α-chloralose (initial dose of 80 mg/kg intravenous, maintained with 20 mg/kg, intravenous every 45 mins). Electrical stimulation of each forepaw was produced using two subdural silver needle electrodes in either paw and a Grass stimulator. Pancuronium (2 mg/kg, intravenous) was administered to provide muscle relaxation.
Functional MR images were collected using a 24 × 18 mm elliptical surface coil positioned over the head. Five transverse slices (thickness = 1.5 mm) from forebrain containing the sensory-motor cortex were selected from scout images. After shimming, images for fMRI scans were acquired using a gradient echo sequence gated to the ventilation (TR = 85 ms, TE = 10 ms, 20° flip angle, 128 × 128 image matrix, field of view = 3 × 3 cm) with a duration of approximately 11 secs/image. Three types of MR scans consisting of 32 images were acquired during right paw stimulation, left paw stimulation, hypertension, or a combination of stimulation plus hypertension. The electrical stimulation scan consisted of acquiring 32 images during two periods of electrical stimulation of the right or left forepaw during acquisition of images 7 to 13 and 20 to 24, a stimulation paradigm of suitably short duration to elicit repeated and reproducible responses at 9.4 T. Stimulus amplitude was set at 3 to 6 mA according to the strength needed to produce a small twitch of the forepaw. A hypertension scan acquired six images under baseline conditions and, at the end of the sixth image, norepinephrine (NE, 0.15 to 1.2 μg/kg intravenous) was infused to produce a transient BP increase that normally reached a maximum in 10 to 20 secs and then returned to baseline within 40 to 150 secs. The electrical stimulation plus hypertension scan was a combination of the previous two, combining both stimulation of the right or left forepaw and various levels of transient hypertension. The BP increase was initiated after image six to model an increase in BP accompanying the first stimulation. Within each animal, a total of 12 to 16 scans were acquired, which initially involved electrical stimulation of the left or right forepaw. Then there were scans with different ranges of BP increases accompanied by left paw, right paw, or no stimulation. The order of the magnitude of BP changes was varied between animals. The responses were assigned into one of six hypertensive ranges—baseline, 1 to 15, 15 to 30, 31 to 45, 46 to 60, and > 60 mm Hg.
Histology
At the end of functional imaging experiment, animals were deeply anesthetized (pentobarbital, 120 mg/kg, intravenous) and then perfused through the ascending aorta with heparinized saline and 0.1 mol/L ice-cold phosphate-buffered saline. Brains were then removed and fixed overnight in 10% formalin and embedded in paraffin. Coronal sections (7 μm) were cut on a microtome and mounted onto glass slides. Sections were dewaxed, rehydrated, and stained for hematoxylin and eosin or immunohistochemically for glial fibrillary acidic protein (GFAP) or laminin to assess injury responses within the tissue, astrocytes, and vessels, respectively. For GFAP immunostaining, sections were incubated first with blocking solution and then overnight with rabbit anti-rat GFAP antibody (1:5,000), then for 1h with biotin-SP conjugated goat anti-rabbit immunoglobulin G (1:400) and then for 30 min with streptavidin—horseradish peroxidase (1:400). For laminin staining, sections were boiled in 10 mmol/L Tris-HCl for 20 mins, and then incubated with blocking solution for 1 h, rabbit anti-rat laminin antibody (1:50, Dako, Denmark) for 2 h, Cy3-goat-anti-rabbit immunoglobulin G for 30 mins, and fluorescein isothiocyanate-racinus communis agglutinin I (1:20) for 3 mins.
Image Analysis
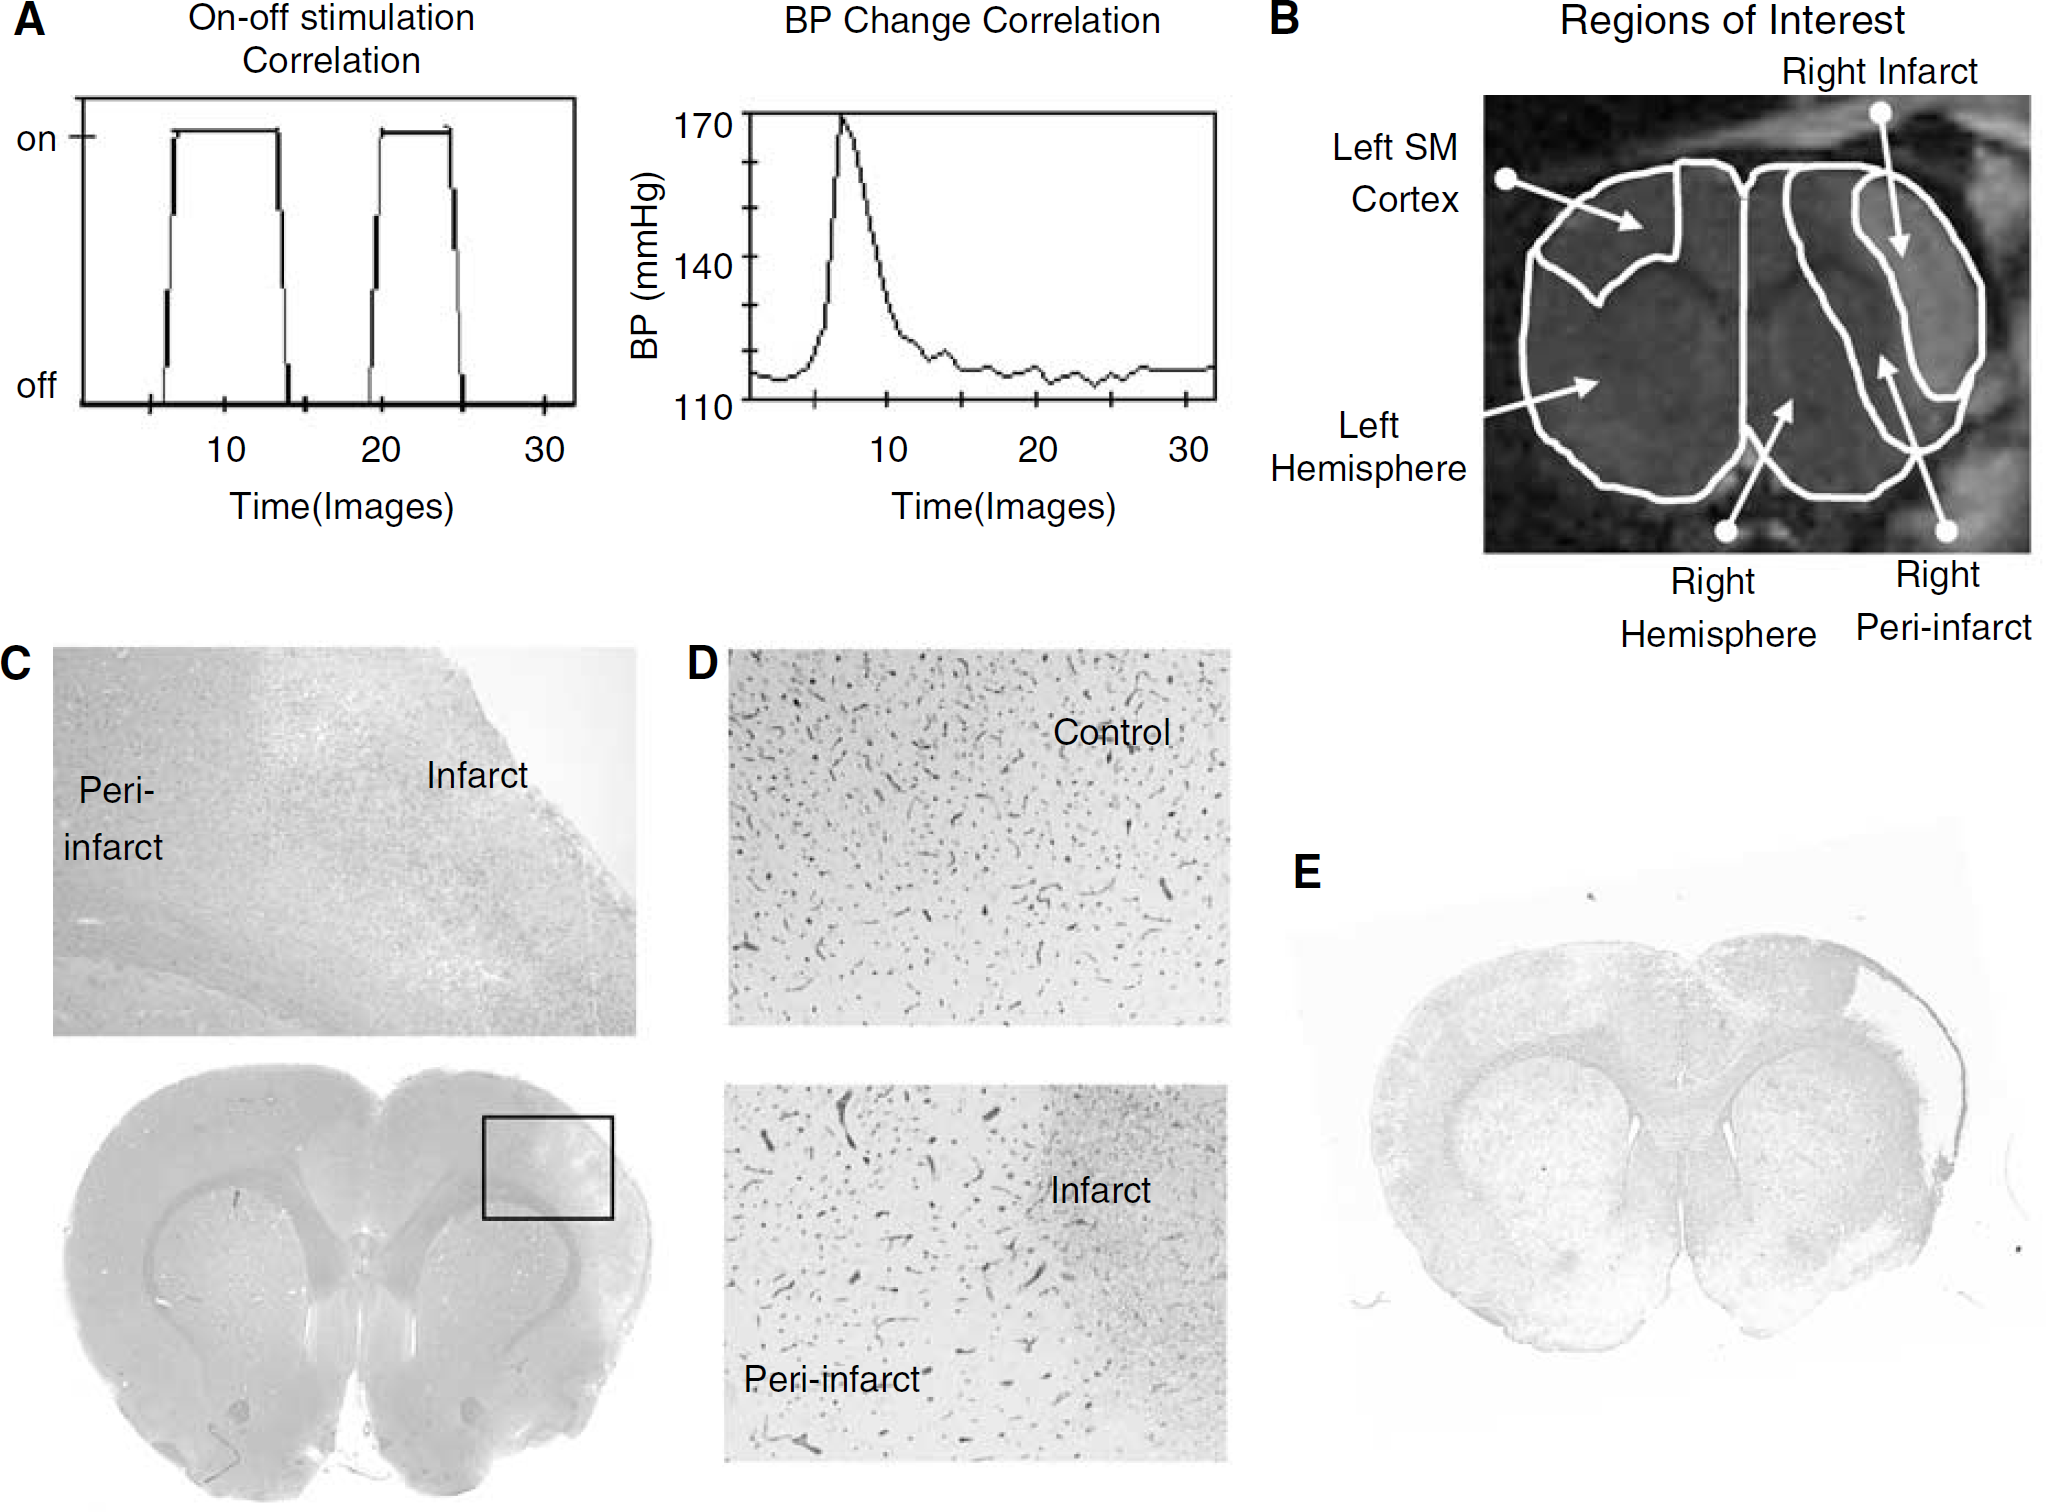
Regions of interest were defined using the T2-weighted images at 2 days after ischemia and a rat brain atlas (Paxinos and Watson, 1986). The infarct region was delineated as the area with increased intensity (values greater than mean ± 1 s.d.) compared with the corresponding region in the contralateral hemisphere (Allegrini and Sauer, 1992; Neumann et al, 2000). The peri-infarct region was delineated as a 1.5 mm wide region surrounding the infarct. Left and right sensory—motor cortex regions were drawn as templates on each of three forebrain slices where the templates were determined from a rat brain atlas and the response to forepaw stimulation observed in normal animals (e.g., Figure 1B). Another region of interest was the remaining left or right hemisphere, which included the hemisphere other than left sensory-motor cortex or right infarct/perinfarct regions, respectively.
Experimental paradigms (
Image analysis for the fMRI scans was performed using local software developed by the Institute for Biodiagnostics (EvIdent) (Jarmasz and Somorjai, 2002). Images were first normalized by subtracting the median intensity value and then smoothed using a spatial median filter (3 × 3 blocks). Motion was minimal owing to restraint of the head. Influence of the hemodynamic response was considered minor compared with the 10 secs needed to acquire each scan. The voxel intensity changes were correlated either to the on—off stimulation time course or the known measured BP time course changes for that scan (e.g., Figure 1A). A Pearson's correlation analysis with a threshold of P < 0.0005 (selected as approximmately 1/number of voxels to correct for multiple tests (Bullmore and Suckling, 2001)) determined the ‘active’ voxels correlating to the time course of interest and these voxels were displayed in orange to red with increasingly stringent P-values. In addition, a model-free analysis of the data was performed using EvIdent that involved an unsupervised fuzzy cluster analysis of the intensity changes and this produced clusters of voxels with self-similar time courses.
The ‘voxel activation’ response was the number of voxels correlating to the time course expressed as a percentage of the number of voxels in each analyzed region of interest. The average time course of the voxels with P < 0.0005 were also displayed for each region and were used to measure the peak signal intensity change within the first 100 secs. The responses for each region were grouped into BP ranges according to the maximum BP change, which occurred during that scan.
Quantitative assessment of the response in scans investigating the response to hypertension focused on the response of voxels correlating to the change in BP time course, whereas scans that involved forepaw stimulation focused on the response of voxels correlating to the stimulation time course. All data are presented as the mean ± s.d. Differences between means in the different BP ranges were compared with baseline using a one-way analysis of variance and a Bonferroni multiple comparison of means or a Mann—Whitney rank sum test for nonnormal data (SigmaStat, Systat Software Inc., San Jose, CA, USA). Differences between the data in the stroke group and that in sham controls were also compared using a Student's t-test. Differences were considered significant at P < 0.05.
Results
During the initial surgery and MCA occlusion there was a reduction in flow in all animals to 5 ± 3% of preocclusion flow with flow returning to baseline on reperfusion (mean of 94 ± 26% of preocclusion flow). All sham-operated rats had normal T2-weighted images acquired 2 days after transient cerebral ischemia. Eight of 10 rats from the stroke group had areas of hyperintensity predominantly in the cerebral cortex of the MCA territory, including the right sensory—motor cortex. These eight animals were subjected to further study and had a mean infarct volume measured from the MR images of 110 ± 30.5 mm3 (or 12.6 ± 3.3% of the forebrain). Staining of neurons, astrocytes, and vessels in the brain of sham controls was similar to that in the left hemisphere of rats with a right focal ischemic lesion. Within the ischemic lesion there was extensive neuronal death visible in hematoxylin and eosinstained sections, reduced GFAP labeling and marked loss in numbers of cerebral vessels staining with laminin (e.g., Figures 1C-1E). In the periinfarct region, there were scattered neuronal changes on hematoxylin and eosin-stained sections, an increased staining of reactive astrocytes with GFAP and some decreased laminin staining of cerebral vessels.
During fMRI studies 1 week after stroke, the average mean arterial BP before NE injection was 98 ± 21 mm Hg for stroke animals and 99 ± 18 mm Hg for control animals. Mean arterial blood gases and blood glucose values were similar before, during, and after NE injection in both animal groups (Table 1).
Responses to Hypertension alone following Stroke
A correlation of the intensity changes to the transient increases in BP in stroke animals resulted in active voxels whose numbers and signal intensity change were related to the change in BP. When the transient hypertension was mild (0 to 15 mm Hg), there was no voxels correlating to either the change in BP or stimulation time courses (Figures 2-I, 2B and 2C). With transient hypertension that was moderate (15 to 30 mm Hg, (not significant) NS and 31 to 45 mm Hg, P < 0.05), voxels correlating to the change in BP were detected in some animals and these voxels were located predominantly in infarct and peri-infarct regions (e.g., Figure 2-I, E). Despite a lack of stimulation, several voxels in the infarct and peri-infarct regions also correlated to the stimulation time course corresponding to the overlap in the BP and stimulation time courses (Figure 2-I, F). With larger increases in BP (> 45 mm Hg), the voxels correlating to the change in BP became even more pronounced in the infarct and peri-infarct regions and extended to other regions distributed throughout the right and left hemisphere (Figure 2-I, H). The responses to transient hypertension in sham animals were generally similar, if somewhat more sensitive, to that in the left (control) hemisphere of the stroke group (images not shown).
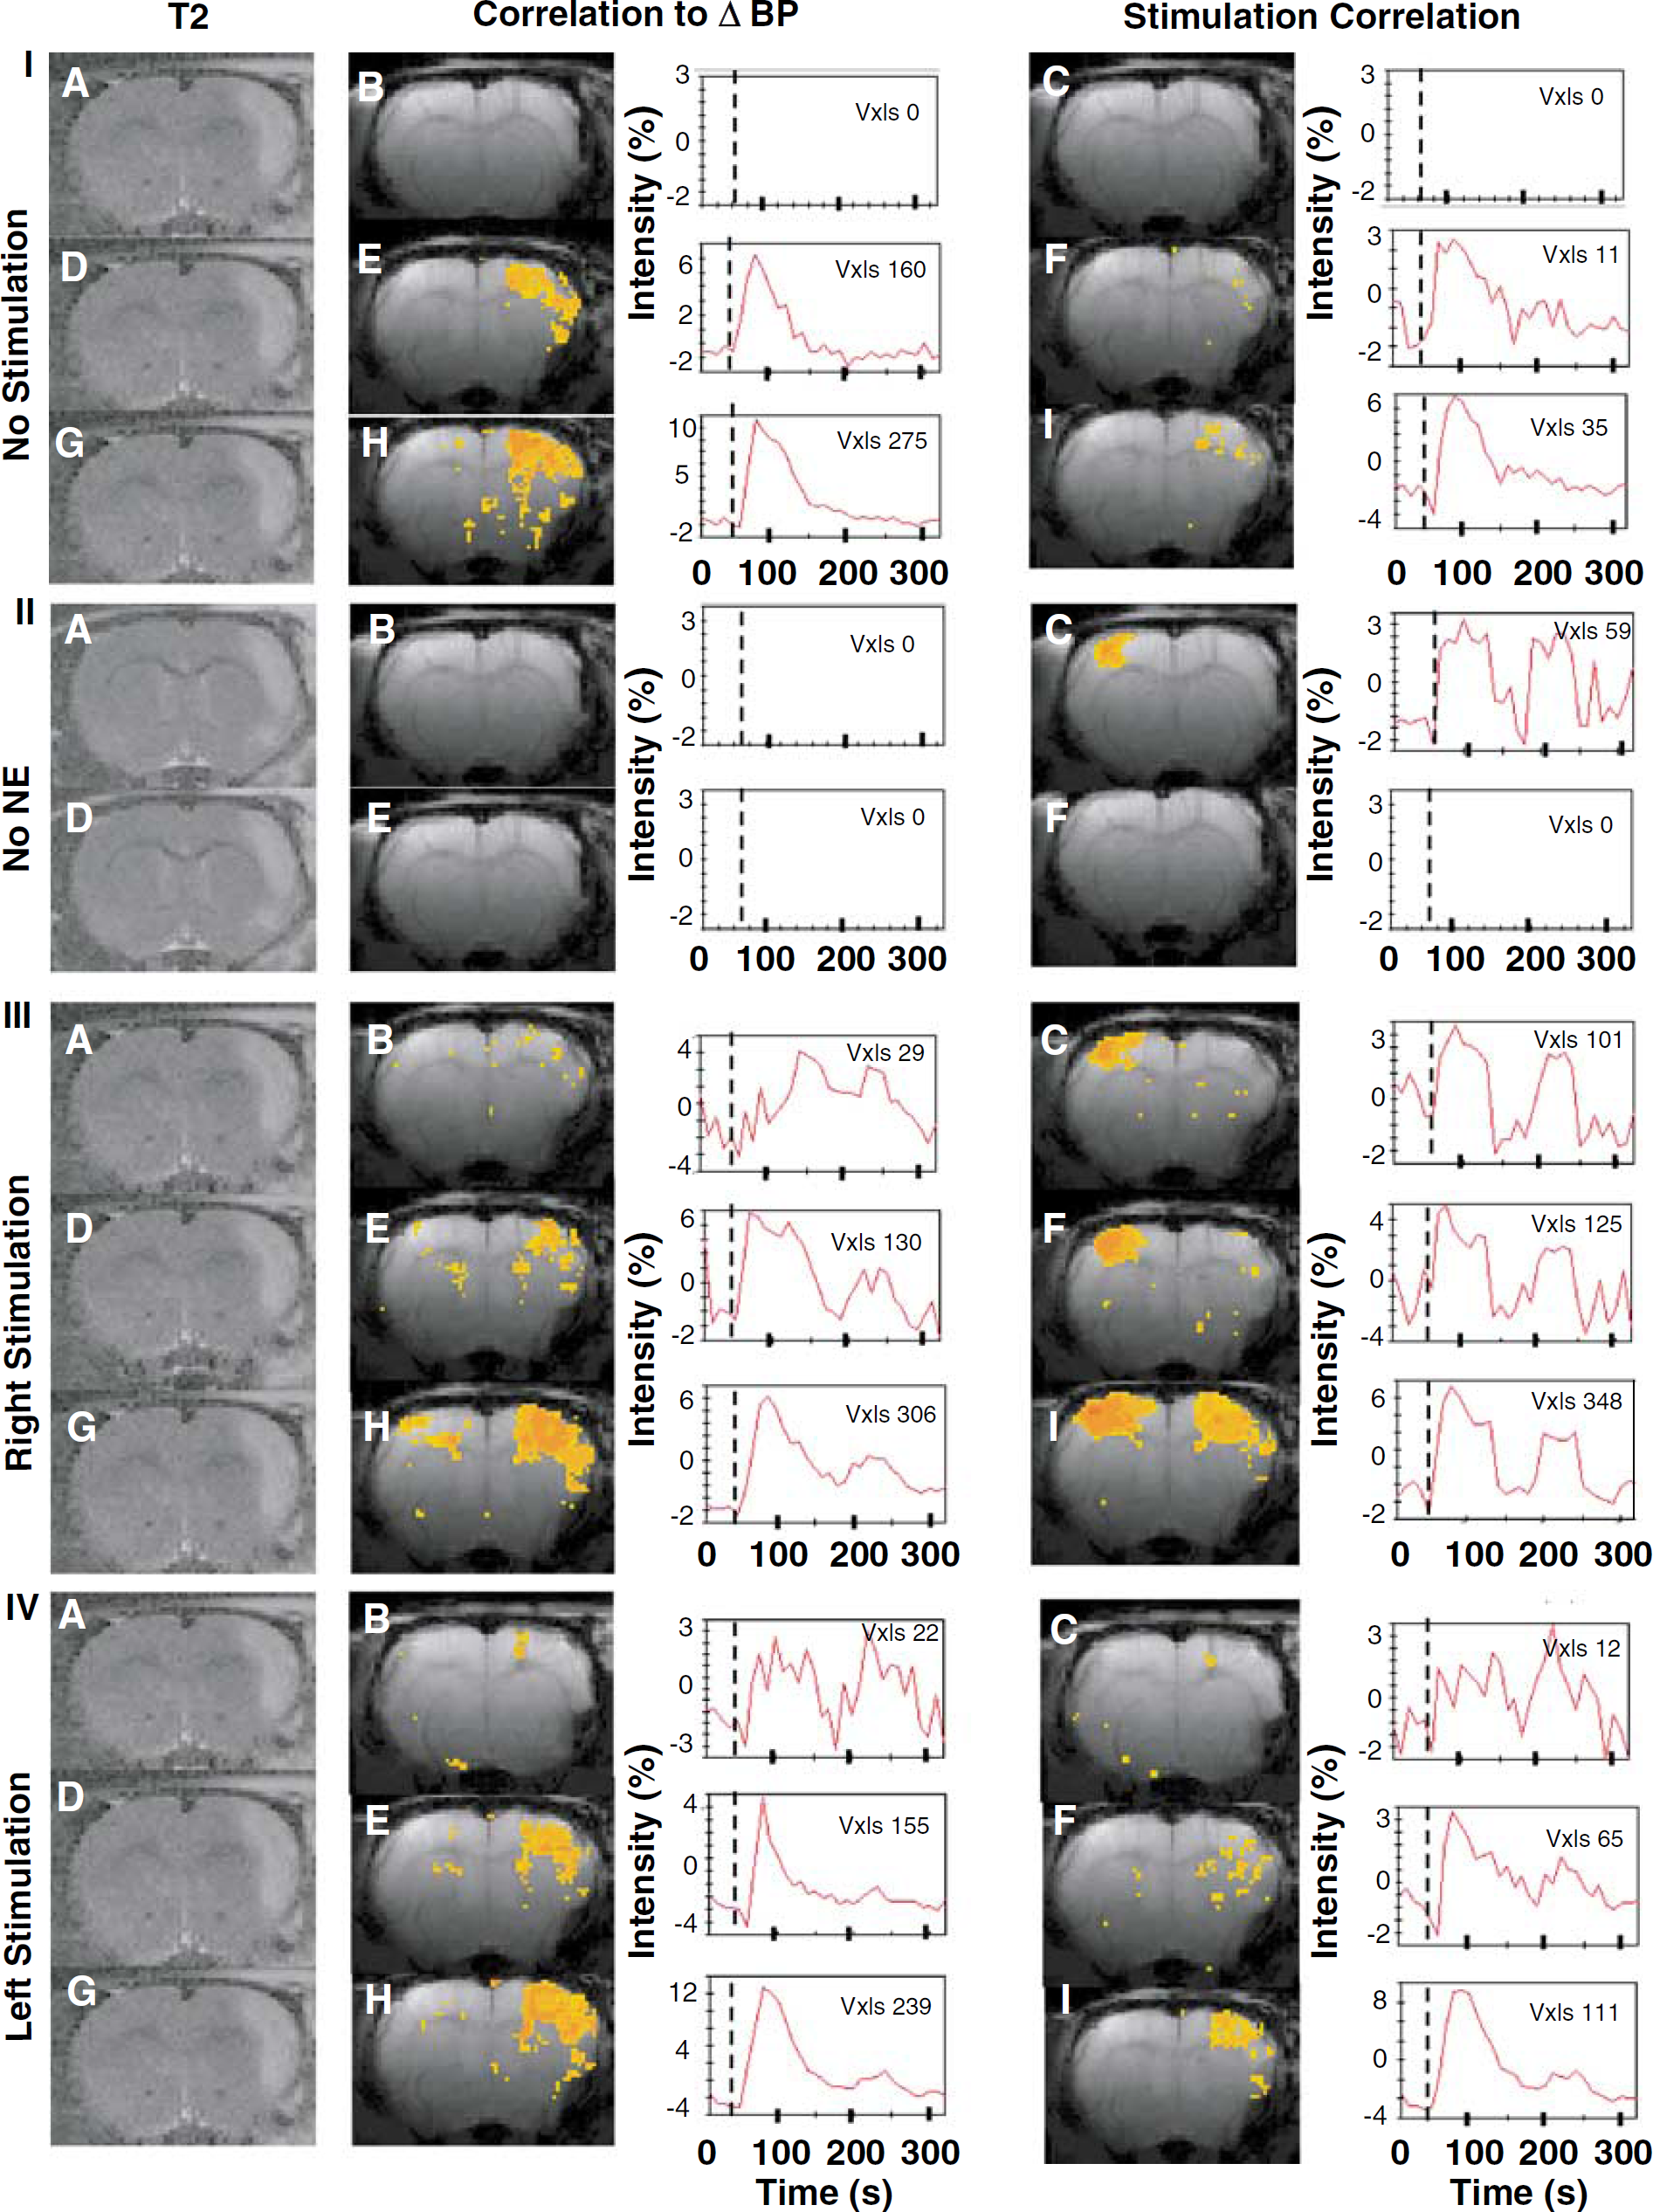
Representative fMRI responses 1 week after transient focal cerebral ischemia. Voxels responding significantly to transient hypertension alone (I), to forepaw stimulation without NE administration (II), to right paw stimulation plus hypertension (III) or to left paw stimulation plus hypertension (IV). Shown in color are the active voxels correlating to the BP or stimulation time course (second and fourth columns, respectively) along with the average time course of those active voxels. The first column are T2-weighted images acquired 2 days after the insult, showing the distribution of the infarct. Within I, III, and IV are examples of mild (0 to 15 mm Hg) BP changes (
Mean blood gas values before, during, and after intravenous injection of norepinephrine in sham animals and in animals 1 week after focal cerebral ischemia
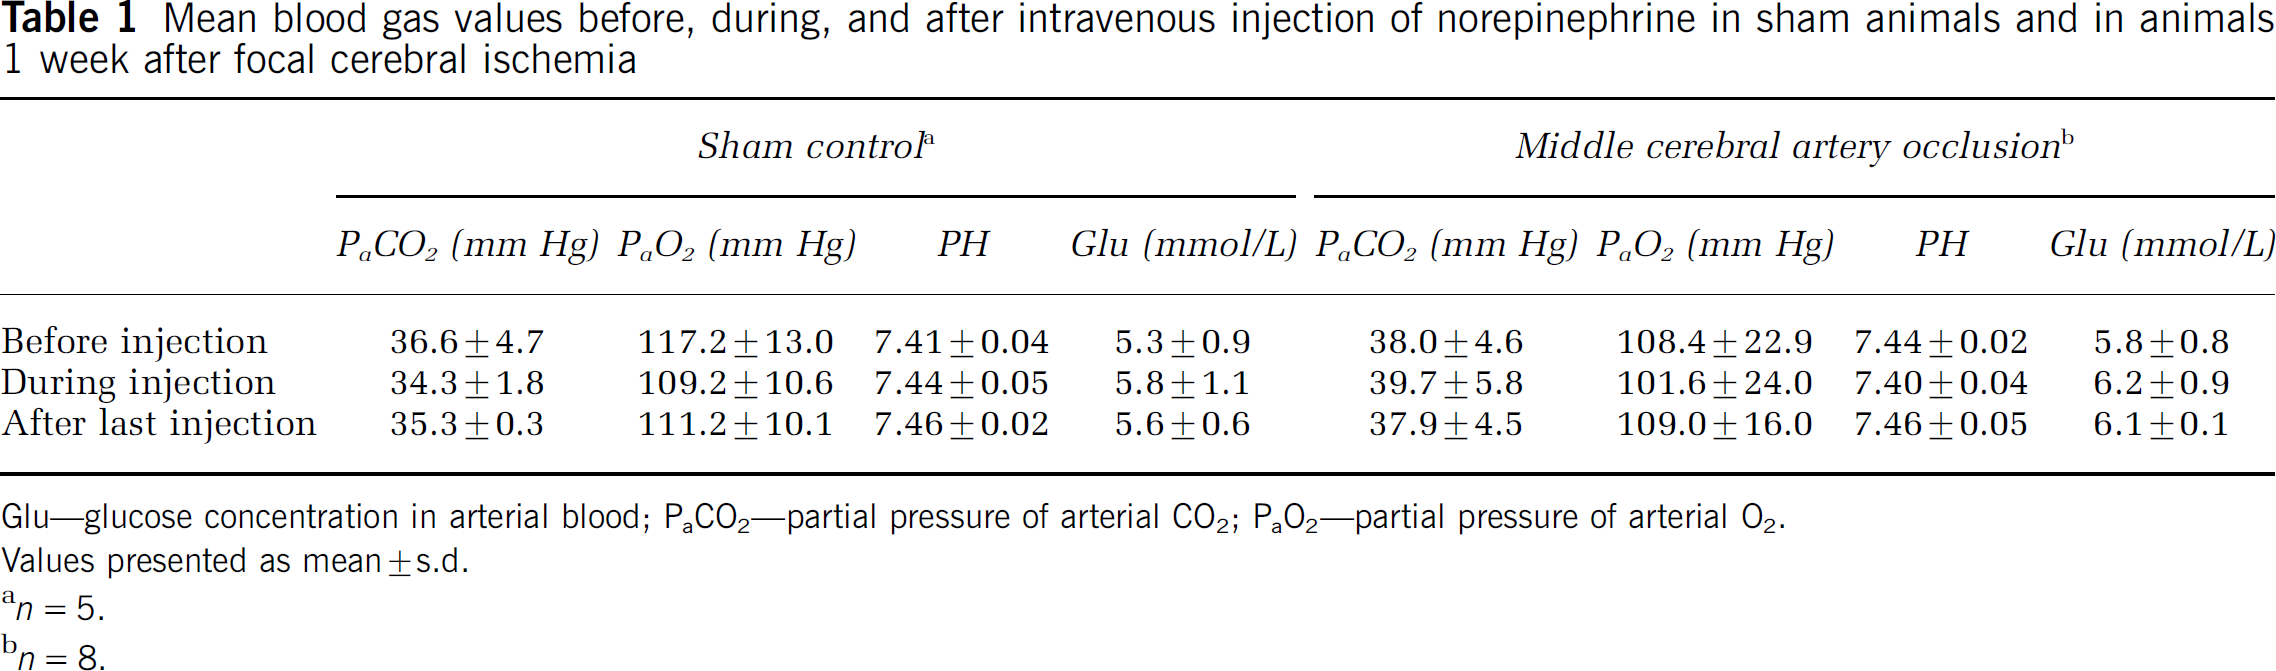
Glu—glucose concentration in arterial blood; PaCO2—partial pressure of arterial CO2;PaO2—partial pressure of arterial O2.
Values presented as mean ± s.d.
n = 5.
n = 8.
The quantitative assessment of the mean responses to transient hypertension for the various BP ranges was compared between sham and stroke animals, for related regions of interest (Figure 3). In stroke animals, infarct and peri-infarct regions had a significant increase in the mean numbers of voxels of activation at pressures > 30 to 45 mm Hg (Figure 3A), whereas the contralateral (left) hemisphere or corresponding region in sham animals tended to be less susceptible to BP changes. Differences between sham and control groups were significant for the highest BP range. The mean MR signal intensity changes in infarct and peri-infarct regions also tended to be more sensitive to BP changes than the responses in the contralateral hemisphere or in a corresponding sensory—motor cortex region in sham control animals (Figure 3B). In this case, differences between stroke and control groups were significant at the moderate BP range (31 to 45 mm Hg).
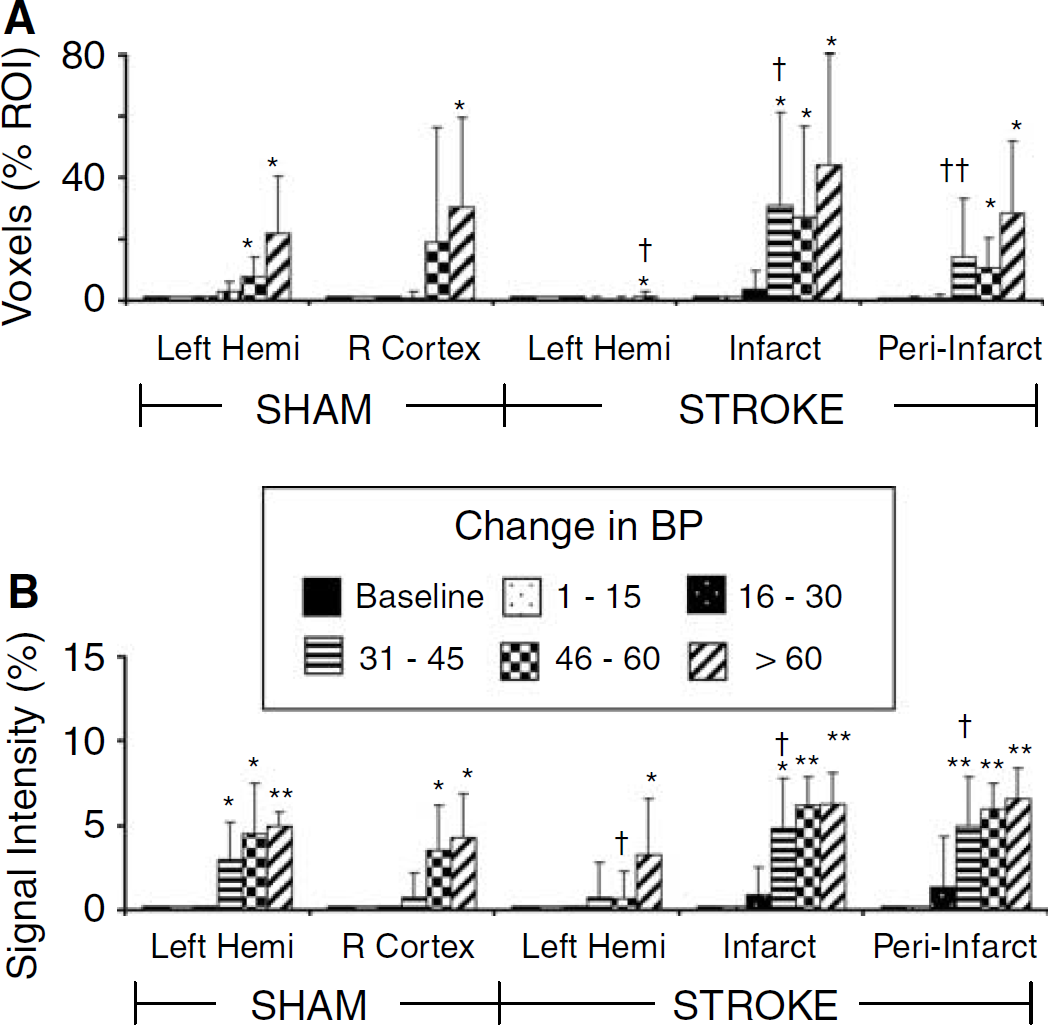
Mean activation responses to transient hypertension (no stimulation) during fMRI scans. Numbers of voxels significantly correlating to the change in BP time course have been grouped into different ranges of BP change for animals (n = 4 to 8) and are presented as a percentage of the voxels analyzed in each region of interest (ROI) (top panel,
Responses to Forepaw Stimulation following Stroke
During baseline fMRI experiments acquired under conditions without injection of NE or BP increases, right forepaw stimulation produced an activation with voxels correlating to the stimulation paradigm within the left sensory-motor cortex in either sham or control animals (e.g., Figure 2-II, C). In contrast, the response to left forepaw stimulation was absent in the right (infarcted) sensory—motor cortex after stroke (Figure 2-II, F). Quantitative assessment of voxels correlating to the stimulation paradigm confirmed that the activation response to right forepaw stimulation resulted in a similar number of voxels and signal intensity changes in the left sensory—motor cortex, for both stroke and sham groups (baseline response, Figure 4). In contrast, in response to left forepaw stimulation there was an activation in right sensory motor cortex in sham animals, whereas in stroke animals there was a significant decrease in the number of active voxels and their signal intensity changes in right infarct or peri-infarct regions (baseline response, Figure 5).
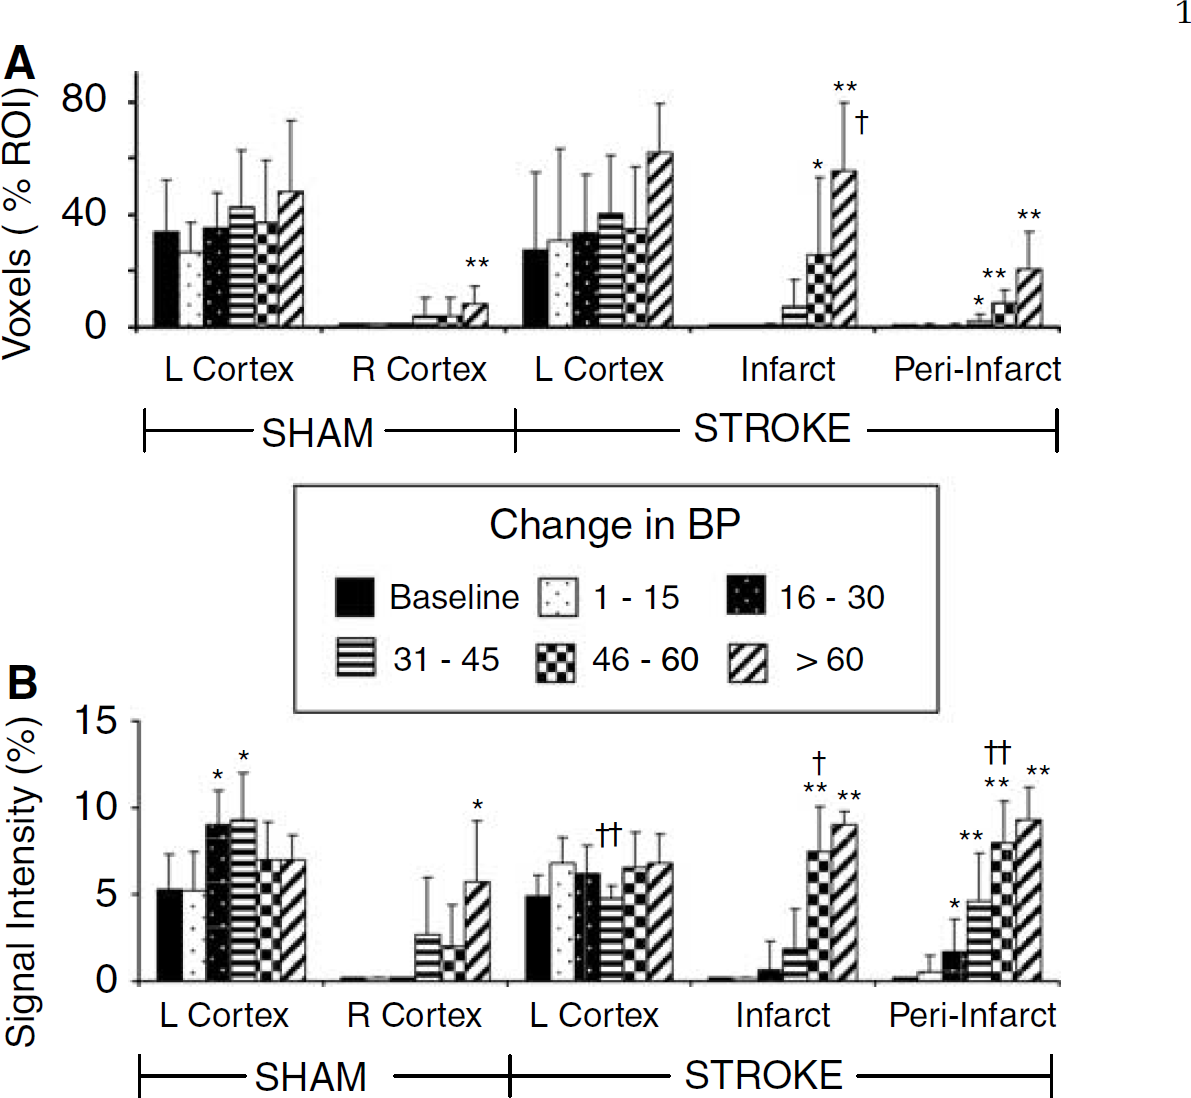
Mean activation responses to right paw stimulation plus transient hypertension during fMRI scans. Numbers of voxels significantly correlating to the stimulation time course have been grouped into different ranges of BP change for animals (n = 4 to 8) and are presented as a percentage of the voxels analyzed in each region of interest (ROI) (top panel,
Responses to Right Paw Stimulation Accompanied by Hypertension following Stroke
When scans with right paw stimulation were accompanied by a transient hypertension, similar to the results for BP increases alone, there were a significant number of voxels correlating with the increase in BP or stimulation time courses (Figures 2-III, 2B, 2E, and 2H). Relatively few voxels correlated to a mild change in BP with more becoming significantly correlated with moderate BP increases and these were distributed primarily in the infarct and peri-infarct brain regions but also scattered elsewhere. The voxels correlating to the stimulation time course when accompanied by mild transient hypertension were predominantly distributed in the left sensory motor cortex (Figure 2-III, C). As BP increased, the number of voxels correlating to the stimulation paradigm increased both within and surrounding the sensory—motor cortex. In addition, with high BPs, voxels in the infarct region became part of the activation response (Figures 2-III, 2F and 2I).
Quantitative comparison of the mean voxels and their average signal intensity changes in response to right forepaw stimulation and simultaneous transient hypertension were compared in sham and stroke animals (Figure 4). In both sham and stroke groups, as expected there were voxels correlating to the stimulation time course in the left sensory—motor cortex, however, the numbers of ‘active’ voxels tended to increase as the BP increased (Figure 4A). With moderate transient hypertension, the mean signal intensity responses (Figure 4B) tended to increase in the left sensory—motor cortex, reaching statistical significance in sham animals. As expected, in sham animals there was little response to right forepaw stimulation in the right cortex with mild hypertension but as pressure increased substantially a significant number of voxels above the correlation threshold with signal intensity changes correlating to the stimulation time course were observed. This pressure related response was more prominent in the right infarct and peri-infarct region in stroke animals than in the right sensory-motor cortex of sham animals.
Responses to Left Paw Stimulation Accompanied by Hypertension following Stroke
Analysis of the scans acquired during electrical stimulation of the left forepaw and transient hypertension in the stroke group resulted in a significant number of voxels correlating to the change in BP time course (Figures 2-IV B, 2E and 2H). These voxels were distributed mainly in the infarct and peri-infarct brain regions and the response was more pronounced with large BP changes. Only a few scattered voxels correlated to the stimulation paradigm with left forepaw stimulation when left paw stimulation was accompanied by mild BP changes (Figure 2-IV, C). This corresponded to a loss of activation in the stroke lesion. However, with greater BP changes, the similarity between the BP and stimulation time course was such that voxels correlating to the stimulation paradigm were observed, particularly in infarct and peri-infarct regions (Figures 2-IV, 2F and 2I).
Quantitative comparison in sham and stroke animals of the mean voxels and their average signal intensity changes in response to left forepaw stimulation and simultaneous transient hypertension are shown in Figure 5. A normal activation response to left paw in the right sensory-motor cortex was observed in sham animals. Also, the numbers of voxels and their mean peak signal intensities tended to increase with moderate BP increases. In contrast, in the stroke group with mild hypertension and left forepaw stimulation there was a loss of activation in the right hemisphere resulting in a significant reduction of the activation response compared with sham animals. However, the numbers of voxels and their average intensity response increased as the BP that accompanied the stimulation increased. This response was significant at pressures > 15 or 30 mm Hg in both infarct and periinfarct regions and the responses became similar to those in sham animals at pressures 31 to 45 or 45 to 60 mm Hg, for the signal intensity or voxel responses, respectively.
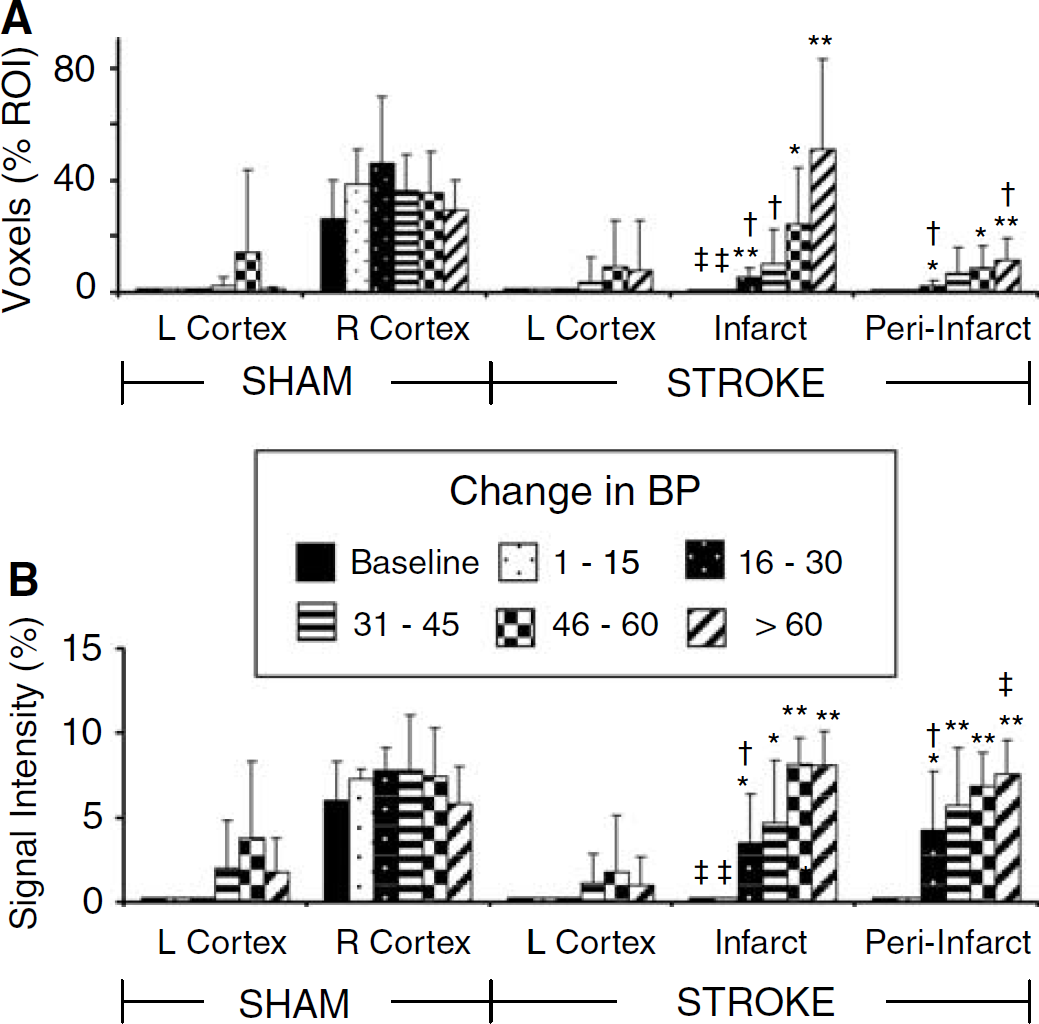
Mean activation responses to left paw stimulation plus transient hypertension during fMRI scans. Numbers of voxels significantly correlating to the stimulation time course have been grouped into different ranges of BP change for animals (n = 4 to 8) and are presented as a percentage of the voxels analyzed in each region of interest (ROI) (top panel,
Cluster Analysis of the Responses
The most physiological response is likely a combination of the BP and stimulation time courses and thus data were also analyzed using EvIdent—an unsupervised method of analysis that uses a fuzzy clustering based method. Except for experiments with minor changes in BP and no forepaw stimulation, this analysis provided several clusters with average time courses that followed the BP changes, the stimulation time course or a combination of the two when both stimulation and hypertension were applied. Selecting the predominant cluster and its time course for further correlation analysis resulted in quantitatively greater numbers of active voxels than with a correlation analysis to the known BP or stimulation time courses (data not shown). The variability in responses between animals also was increased, nevertheless the differences between responses at different magnitudes of BP and between sham and control animals tended to be similar to those described for the analysis in Figures 3 to 5.
Discussion
The results of the present study provide original findings regarding the effects of transient hypertension on the detection of fMRI activation following stroke. First, in response to transient increases in BP alone, there are voxels correlating to the BP increases, and these are most pronounced in the infarct but also in the peri-infarct brain region. Second, despite a loss of an activation response to forepaw stimulation in the injured sensory-motor cortex 1 week after stroke, when stimulation was accompanied by transient hypertension then an ‘apparent’ activation was detected in the infarct. An enhanced apparent activation not observed at lower pressures or in sham animals also occurred in regions adjacent to the infarct. Although already present in some animals at modest pressures of 16 to 30mm Hg, generally these effects were not significant until BP changes were moderate (e.g., > 30 to 45 mm Hg). The results indicate that activation in fMRI studies after stroke need to be interpreted cautiously if fMRI tasks are associated with moderate or severe BP changes.
Response to Forepaw Stimulation Following Stroke
In the rat, 1 week after MCA occlusion, the response to contralateral forepaw stimulation was generally abolished in the injured sensory—motor cortex. This is similar to previous observations in either patients or animals, where a loss of functional activation in regions with cortical lesions or ischemic damage have been reported (Abo et al, 2001; Dijkhuizen et al, 2001; Hodics and Cohen, 2005; Sauter et al, 2002; Ward, 2005). A loss or reduction of activation to sensory—motor stimulation would be expected if there is neuronal damage in the cortical projection area of the forepaw. Evidence of infarction within the sensory—motor cortex was substantiated by the appearance of hyperintense areas in T2-weighted images and pannecrosis in the hematoxylin and eosin-stained brain sections. The laminin immunohistochemistry also demonstrated a reduction of laminin labeling within vessels, consistent with injury or damage to intracortical vessels and a lack of normal vascular reactivity or BOLD responsiveness to neuronal activation. A continued coupling of flow to metabolism would be surprising considering the appearance of the vessels, neurons and supporting cells within the infarct one week after focal cerebral ischemia.
Response to Hypertension Following Stroke
Blood pressure in this study was increased using NE, an α-adrenergic agonist at a rate of 1.5 to 5 mm Hg/sec, which is generally less abrupt than the pressure changes achieved in dynamic autoregulatory studies using transcranial doppler that show initiation of the autoregulatory response within 1 to 2 secs and completion of the response within 6 to 7 secs (Aaslid et al, 1991). Thus, uninjured cerebral vessels are expected to respond with a normal autoregulatory response to the pressure changes observed. Note that NE is considered to have minimal direct effects on cerebral circulation, oxygen consumption or glucose utilization, particularly if the blood—brain barrier is undamaged because NE normally does not cross the blood—brain barrier (Hardebo and Owman, 1980; Moller et al, 2004; Tuor et al, 1986). Considering also that cerebral blood flow in normal rat brain has been reported to be unaffected by BP changes until BP levels are greater than 145 mm Hg(Narasimhan et al, 1996; Schaller et al, 2002), the enhancement of activation responses with substantial BP changes (> 45 mm Hg) are likely related to flow induced increases in BP above the upper limit of autoregulation. A pressure dependence on the activation response has been reported previously (Wang et al, 2006), and although not directly comparable because images in the previous study were not smoothed before analysis, the number of voxels of activation in the injured hemisphere appear to be enhanced. Indeed, in the infarct region, there was an earlier BP-related increase (already at levels of 31 to 45 mm Hg) in the apparent activation response than in the non-injured hemisphere. Furthermore, the apparent activation response observed also exceeded the response in sham animals when BP increased by 31 to 45 mm Hg.
Considering the damage 1 week after cerebral ischemia, the enhanced apparent activation during hypertension in the damaged infarct region is unrelated to a centrally mediated change in neuronal activity related to BP control (e.g., (Harper et al, 2000; King et al, 1999)). Instead, such enhanced BP-dependent effects are readily attributed to increases in perfusion related to a loss of myogenic reactivity (Cipolla and Curry, 2002) and an impaired CBF autoregulation of the injured brain to changes in perfusion pressure (Czosnyka et al, 2003; Dawson et al, 2003; Golding et al, 1999; Olsen, 1986; Paulson et al, 1990). Indeed, acutely and subacutely after an ischemic insult, the autoregulatory response to a change in BP is less efficient resulting in changes in CBF or a less effective dynamic autoregulatory response. Note that such responsiveness may be somewhat different in subjects with chronic hypertension where the upper limit of autoregulation has been reported to be increased (Paulson et al, 1990), although there is some evidence for an increased extent of CBF responsiveness even in hypertensives (Gamalo et al, 2005).
Also important is the observation that in regions adjacent to the infarct there are BOLD activation responses correlating to BP increases alone. Autoregulatory failure in regions exceeding the border of the infarct have been reported previously, particularly at acute and subacute times after stroke (Dawson et al, 2003; Eames et al, 2002; MacGregor et al, 2000). For example, corresponding well with the present responses to hypertension at 1 week after ischemia, is the observation of an impairment of CBF autoregulation to BP decreases in the peri-infarct region at 24 h after MCA occlusion. The extension of autoregulatory impairment into adjacent cortex, which also experienced hypoperfusion, is not entirely unexpected considering the scattered neuronal necrosis and gliosis we generally observed and reports by others of various cellular changes in the peri-infarct region (Boscia et al, 2006; Shimizu et al, 2005). Note however that regions surrounding the infarct appear rather normal in standard MR images making it difficult to predict using noninvasive imaging, which regions would have the greatest altered responsiveness. This may be more relevant for the acute and subacute stages after stroke, because recently after chronic recovery, an fMRI study in stroke patients reported the presence of baseline derangements of T2* in peri-infarct regions (Cramer et al, 2006). Within these regions surrounding the infarct there was also a smaller than normal fMRI activation. Whether BOLD responses to hypertension in these chronically recovered regions would be similar to those observed presently with subacute recovery deserves further study.
Response to Forepaw Stimulation and Hypertension
There is scant information available on the influence of BP increases on the BOLD response to functional stimulation after stroke. In normal rats, we recently observed a tendency for the signal intensity response to stimulation to increase as the transient hypertension increased (Qiao et al, 2006). This enhancement in an apparent activation became significant for pressure ranges greater than 30 mm Hg. Although somewhat variable, a similar tendency was observed in the present smaller series of sham controls, an example being the enhanced response in left sensory-motor cortex in response to right-paw stimulation. Furthermore, this BP-dependent increase in the detection of apparent cerebral activation to left forepaw stimulation was already evident with modest BP increases (e.g., > 15 mm Hg). This is an apparent detection of an fMRI ‘activation’ as this tissue in the infarct region is necrotic and had a total loss of activation under baseline conditions. Such an enhancement, which is unrelated to neuronal activation considering the damage in this region, can also occur in peri-infarct regions and is likely associated with the signal intensity changes with hypertension being combined with those in response to stimulation (Qiao et al, 2006). Although a neuronal activation related to BP control cannot be entirely excluded in the peri-infarct regions, they are not traditionally considered to be involved in the central regulation of BP and thus also appear directly susceptible to hypertension induced changes in CBF. Note also that in clinical studies, these regions would be indistinguishable from normal appearing brain on standard MR images.
These results have several implications for fMRI studies and their application to assessing generalized recovery from brain injury. Mild changes in BP (< 15 mm Hg) accompanying an fMRI study can be expected to have rather small effects on the activation detected, particularly if the stimulation and BP time courses are rather distinct. Although the exact levels of hypertension that are important will likely vary depending on species, severity of injury and the recovery period, the current results indicate that should changes in BP and fMRI paradigms overlap closely when the autoregulatory response is compromised, then an apparent activation unrelated to changes in neuronal activity may occur in injured or recovering brain, even with milder changes in pressure (> 15 mm Hg). In our case, these became substantial at BP > 30 mm Hg. Considering that mental or motor tasks used in some fMRI studies can be stressful or induce BP changes on the order of 10 to 30 mm Hg, it would be prudent to measure BP during such fMRI studies (Allen et al, 1992; Carter et al, 2005; Critchley et al, 2000; Manuck et al, 1992; Waldstein et al, 2004; Williamson et al, 2003). This is particularly pertinent in stroke recovery studies, since subjects with cerebrovascular disease or stroke have been shown to have increased BP reactivity (e.g., BP increases of more than 40 mm Hg) to mental stresses such as anger recall or the Stoop test (Manuck et al, 1992; Waldstein et al, 2004). Ideally in fMRI studies investigating recovery of brain injury, fMRI experiments should be designed to use tasks with mild effects on BP or alternatively they should in their analysis consider BP changes as potential contributors to the activation detected in infarct and peri-infarct regions.
Footnotes
Acknowledgements
The authors gratefully acknowledge the technical assistance of Susan Sea, Hamidah Meghani, Kelly McAllister, Shauna Crowley, and David Kirk.