
Abstract
The dopamine D1 receptor antagonist radioligand [11C]NNC 112 has previously been reported to have 100-fold selectivity for the D1 receptor compared with the serotonin 5-HT2A receptor. In this study, we tested the selectivity by scanning seven healthy human research volunteers with [11C]NNC 112 before and after 2mg of the antipsychotic drug risperidone, a dose that putatively blocks all 5-HT2A receptors with negligible effect on D1 receptors. We found that specific binding in cortical regions was reduced by 20% to 30%, whereas the striatum showed no change. Based on the known relative densities of these receptors in humans, our results suggest 5- to 10-fold selectivity of [11C]NNC 112 for D1 versus 5-HT2A as opposed to 100-fold selectivity. These results suggest caution in interpreting data from studies using this tracer to measure cortical D1 receptors as well as the need for more selective radioligands to assess cortical D1 receptors.
Keywords
Introduction
D1 receptors are the most abundant dopaminergic receptor subtype in neocortical areas including the prefrontal cortex, and appropriate stimulation of D1 receptors in primates is critical for working memory processing (Goldman-Rakic et al, 2000). Using the D1-receptor antagonist [11C]NNC 112 we have previously shown that D1 receptors are upregulated in the dorsolateral prefrontal cortex (DLPFC) in drug-free and drug-naive patients with schizophrenia, and this increase is associated with poor working memory performance (Abi-Dargham et al, 2002). This finding contrasts with findings from two other positron emission tomography (PET) studies that used another tracer for the D1 receptor, [11C]SCH23390, reporting a decrease (Okubo et al, 1997) or no change (Karlsson et al, 2002). Differences between these tracers in terms of specific to nonspecific-binding ratio, modeling techniques, and selectivity for D1 versus 5-HT2A receptors were some of the technical issues suggested as a possible explanation for the discrepancy.
Selectivity for 5-HT2A versus D1 would be of minor consequence in the striatum, where D1 density is high and 5-HT2A density is negligible. However, in primate cortex 5-HT2A is approximately twofold more abundant than D1 (Lidow et al, 1989). It has been known for more than a decade that [11C]NNC 112 has some affinity for the serotonin 5-HT2A receptor, although the selectivity ratio for D1 versus 5-HT2A was estimated in vitro to be 100:1 (Andersen et al, 1992). A selectivity ratio of 100:1 would lead to 5-HT2A comprising an almost undetectably small fraction of the specific binding signal in cortex (~2%), but 5-HT2A binding would be potentially more problematic if the selectivity ratio were substantially smaller. There is mixed evidence regarding the selectivity of SCH23390, with one study showing greater than 200-fold D1/5-HT2A selectivity (Andersen et al, 1992) in vitro, and another suggesting a more substantial 5-HT2A component (Laruelle et al, 1991). Previous in vivo data for both tracers, while limited, had suggested that the contribution of this 5-HT2A binding to the cortical uptake is negligible. A study in nonhuman primates using [11C]NNC 112 showed no change in the cortical time—activity curve (TAC) of [11C]NNC 112 following administration of the 5-HT2A receptor antagonist ketanserin, although quantitatively rigorous methods were not applied (Halldin et al, 1998). For [11C]SCH23390, studies in mice suggested that the in vivo binding is selective for D1 receptors, even in the prefrontal cortex (Suhara et al, 1992). Because of the discrepant results in schizophrenia with these two tracers, we revisited the issue of selectivity by conducting a fully quantitative PET imaging study in baboons with [11C]NNC 112 and [11C]SCH23390 to examine whether they differed in their binding profile to the serotonin 5-HT2A receptor, assuming that such a difference could possibly explain the discrepant results obtained in schizophrenia. The study in baboons showed that approximately 1/4 of the cortical specific binding signals of both ligands were associated with binding to 5-HT2A (Ekelund et al, in press). However, because the selectivity may differ across species and has never been assessed in humans for either tracer, we wanted to test whether the same binding profile would be observed in human subjects with [11C]NNC 112. Here, human subjects were scanned with [11C]NNC 112 at baseline and after an oral dose (2 mg) of risperidone that putatively would block 5-HT2A receptors without noticeably affecting D1 receptors.
Methods
Subjects
Seven healthy human volunteer subjects (five male, two female, age = 27.7 ± 6.3 years) participated in the study. The study was approved by the Institutional Review Board of the New York State Psychiatric Institute. All subjects provided written informed consent to participate in the study. The absence of pregnancy and medical, neurological, and psychiatric history (including alcohol and drug abuse or current use of psychotropic medications) were assessed by history, review of systems, physical examination, routine blood tests including pregnancy test, urine toxicology, and electrocardiogram.
Study Design
Positron emission tomography scans were obtained before (baseline scan) and 2 h after oral administration of 2 mg of risperidone (blocking scan). No special instructions were given regarding diet on the day of the scan. Six subjects received both scans on a single day. One subject's postrisperidone scan was obtained 19 days after the baseline scan.
Radiochemistry
[11C]NNC112 was prepared by N-methylation of the precursor using [11C]methyl triflate, as previously described (Halldin et al, 1998).
Positron Emission Tomography Protocol
Scans were acquired on the ECAT EXACT HR+ scanner (Siemens/CTI, Knoxville, TN, USA). Data were acquired in three-dimensional mode. A 10 min transmission scan was acquired (in two-dimensional mode) before radiotracer injection for subsequent attenuation correction. After an intravenous bolus of [11C]NNC 112 administered over 45 secs, 90 mins of emission data were acquired. Data were binned into 18 frames of increasing duration (3 × 30secs, 3 × 1 mins, 3 × 2 mins, 2 × 5 mins, and 7 × 10 mins).
Input Function Measurement
After radiotracer injection, arterial samples were collected every 10 secs with an automated sampling system for the first two min, and manually thereafter at longer intervals. A total of 30 samples were obtained per scan. Following centrifugation (10 mins at 1800 g), plasma was collected in 200 μL aliquots and activities were counted in a gamma counter (Wallac 1480 Wizard 3 M Automatic Gamma Counter).
Six samples (collected at 2, 8, 16, 30, 50, and 70 mins) were further processed by high-pressure liquid chromatography to measure the fraction of plasma activity representing unmetabolized parent compound, as previously described (Abi-Dargham et al, 2000b). The measured unmetabolized fraction of [11C]NNC 112 in arterial plasma was fitted to a biexponential function, which was then multiplied with the (decay corrected) measured plasma activity to generate a sampled, arterial plasma input function. The sampled input function was then fitted (from the time of peak activity) to a sum of 3 exponential functions. Plasma-free fraction was also measured, as previously described (Abi-Dargham et al, 2000b). Plasma clearance of unmetabolized [11C]NNC 112 (Cl, L/h) was computed as the ratio of injected activity to area under the curve of the (modeled) input function. Owing to equipment failure during one scan, full arterial input data was only collected from six subjects.
Image Analysis
Positron emission tomography emission data were attenuation-corrected using the transmission scan, scatter correction was applied, and frames were reconstructed by filtered backprojection using a Shepp filter (cutoff 0.5 cycles/projection ray). A T1-weighted magnetic resonance image (MRI) was acquired for each subject, and PET data were registered to the MRI using the automated image registration algorithm (Woods et al, 1993) in the MEDx software environment (Medical Numerics, Germantown, MD, USA). Regions of interest (ROIs) were drawn on each subject's MRI and then transferred to the coregistered PET data. Time—activity curves were formed for each ROI by measuring the mean activity in the ROI in each frame. Regions where the signal-to-noise ratio met a threshold criterion (V″3≥0.5; see parameter estimation section) were used in subsequent quantitative analysis and included cortex (anterior cingulate, dorsolateral prefrontal, medial prefrontal, orbito frontal, parietal, temporal and occipital cortices), limbic (amygdala), and striatal subregions (precommissural caudate (pre-DCA), precommissural putamen (pre-DPU), postcommisural caudate and putamen (post-CA and post-PU), and ventral striatum (VST)). Striatal subregions were defined as in Martinez et al (2003). All other regions were drawn as in Abi-Dargham et al (2002). A gray/white tissue segmentation procedure was applied to the cortical ROIs (Abi-Dargham et al, 2002); data from gray matter only were analyzed in these regions. Cerebellum was included as a reference region. The cerebellum ROI was initially drawn superiorly from the central arbor vitae to the most lateral and inferior boundaries of the cerebellum. These boundaries were then withdrawn linearly by 15% toward the centroid of the initial ROI.
Receptor Parameter Estimation
The primary outcome measure of the study was V″3, equal to f2bmax/KD, where f2 (unitless) is the brain-free fraction of free plus nonspecifically bound ligand, 1/KD (1/nmol/L) is the affinity of the ligand for the receptors and bmax (nmol/L) is the available receptor concentration. Note that if the ligand binds to D1 and 5-HT2A receptors, the observed V″3 is the sum of the V″3s for each receptor type. For the six subjects with full plasma data, a compartment model with arterial input—two-tissue model in ROIs (2TCM), one-tissue model in cerebellum—was fitted to the data (Abi-Dargham et al, 2000b). Total distribution volume (VT) was estimated in each region and V″3 was derived indirectly as
Additionally, the simplified reference tissue method (SRTM) (Lammertsma and Hume, 1996) was applied to the data of all seven subjects. This allowed both the inclusion of the seventh subject and additional confirmation of the results. The change in V″3 between conditions, ΔV″3, was computed as
Parametric Maps
Data were also analyzed at the level of individual voxels. Positron emission tomography data from each scan were normalized to a common template space. Magnetic resonance image scans from each subject were normalized to a template MRI (average of 152 T1 images) with SPM2 software (Friston et al, 1995), and the same transformations were applied to the previously coregistered PET data. Simplified reference tissue method analysis was performed using the ROI-derived cerebellum TACs as reference region curves. For each subject and condition, V″3 maps were generated in each voxel using a basis function approach (Gunn et al, 1997).
Statistics
Repeated measures analysis of variance with regional ΔV″3 as repeated measure was applied with post hoc contrasts between regions if a treatment difference was detected. Also, one group t-tests with false discovery rate multiple comparisons corrections were applied to determine if ΔV″3 was significantly different than 0 in any region. All nonreceptor-related scan parameters were compared between conditions by paired t-tests. Tests were performed with SPSS software (Chicago, IL, USA). For V″3 parametric maps, paired t-tests comparing baseline to risperidone conditions were performed with SPM2 software. No proportional scaling was used.
Results
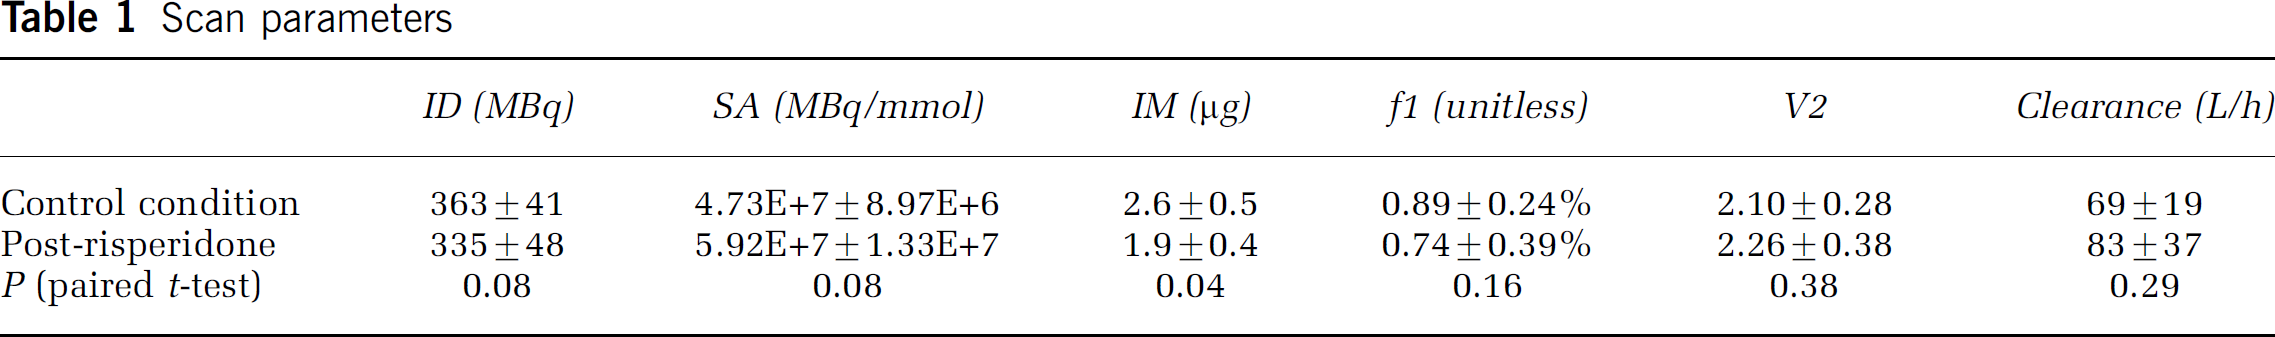
Scan Parameters
Basic scan parameters are presented in Table 1. There were no significant differences in injected dose, specific activity, plasma-free fraction, or Cl between conditions. Importantly, the distribution volume of free plus nonspecifically bound ligand (V2, the distribution volume in cerebellum) was not different between conditions. Injected mass decreased (P = 0.04) after risperidone, but was well within tracer dose range under both conditions.
Scan parameters
Risperidone Challenge
Mean V″3 under control and risperidone conditions as well as mean ΔV″3 are presented in Table 2 for plasma input data and Table 3 for the SRTM data. Repeated measures analysis of variance showed a significant effect of region for both analysis methods (P < 0.001). Simple contrasts showed a significant difference between each cortical and limbic region compared with the striatal subregions (0.003 ≤ P ≤ 0.04) but no differences between the striatal subregions (0.48≤P≤0.75). For both 2TCM and SRTM analysis, one group t-tests showed the 6 cortical regions to be significantly different than 0 after false discovery rate multiple comparisons correction but not amygdala or the striatal subregions (P-values in Tables 2 and 3).
Results from compartment modeling
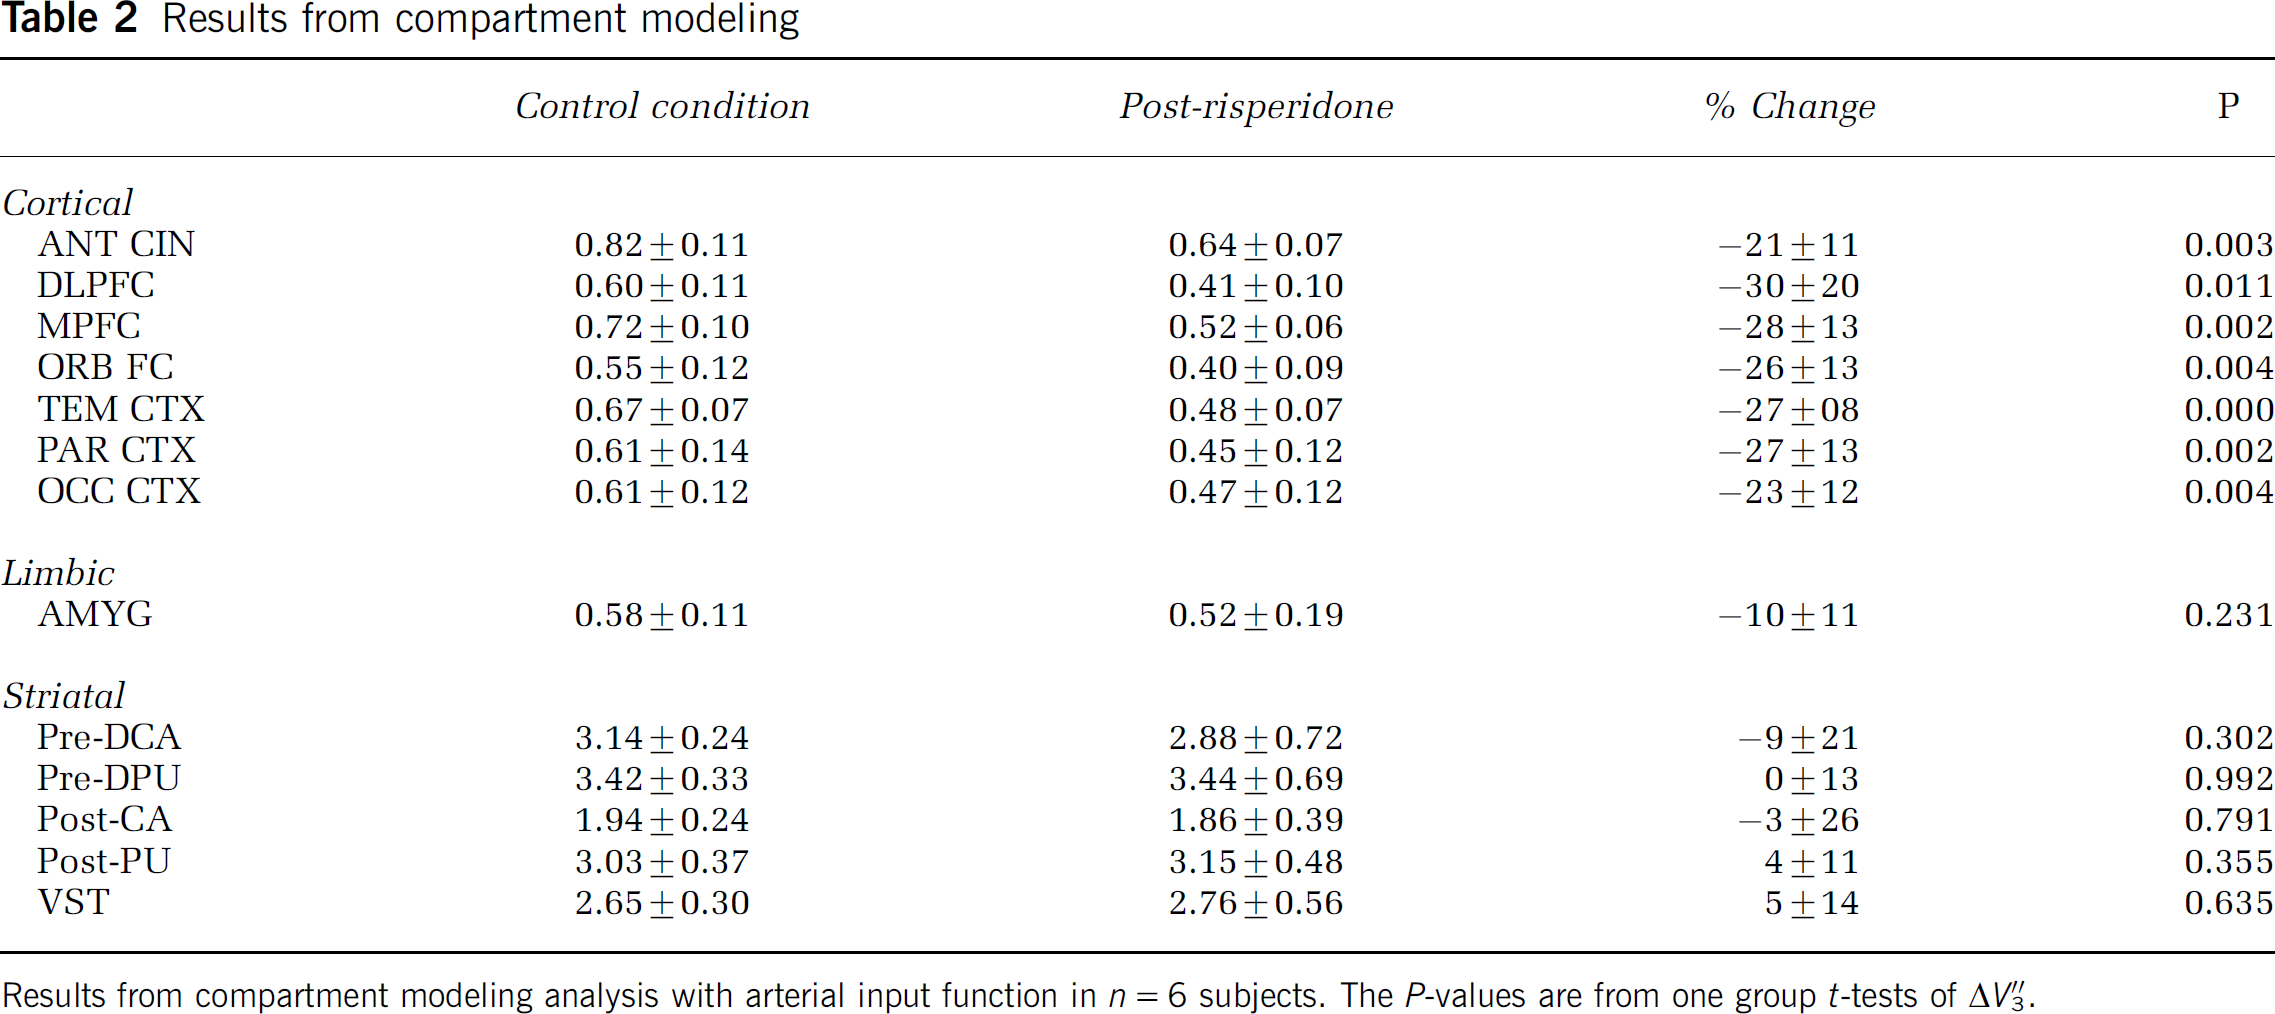
Results from compartment modeling analysis with arterial input function in n = 6 subjects. The P-values are from one group t-tests of ΔV″3.
Results from SRTM analysis
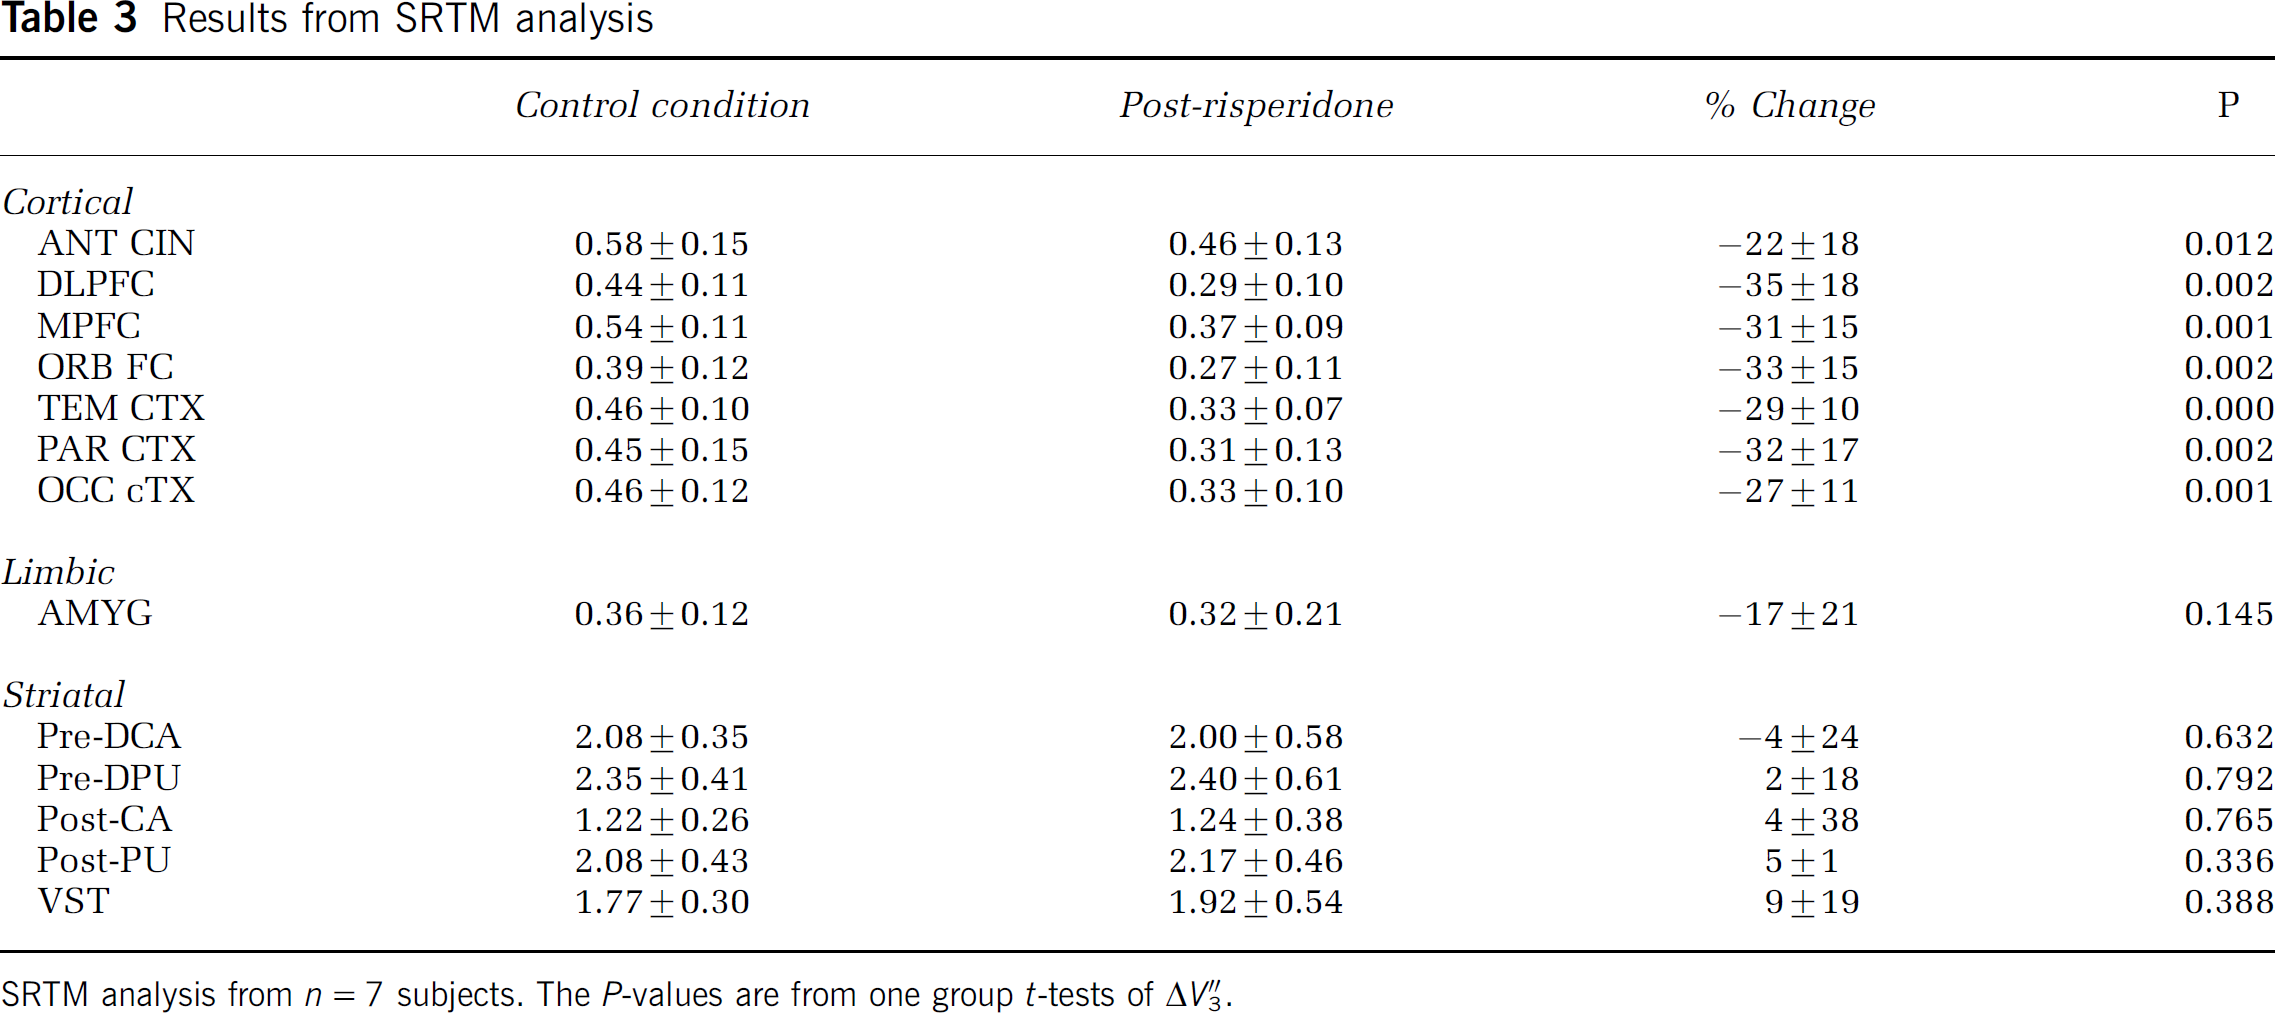
SRTM analysis from n = 7 subjects. The P-values are from one group t-tests of ΔV&Pprime;3.
Parametric Maps
Qualitatively, the voxelwise maps reflected the ROI-based results (Figure 1), with similar decreases in V″3 following risperdone to those observed in the ROI analysis. With the P-value display threshold set at 0.002, SPM analysis revealed two large significant clusters, with peak t-values located in the medial frontal gyrus and medial occipital gyrus. When the display threshold was relaxed to P = 0.01, these clusters spread to cover most of the cortex, but not the striatum (Figure 2).
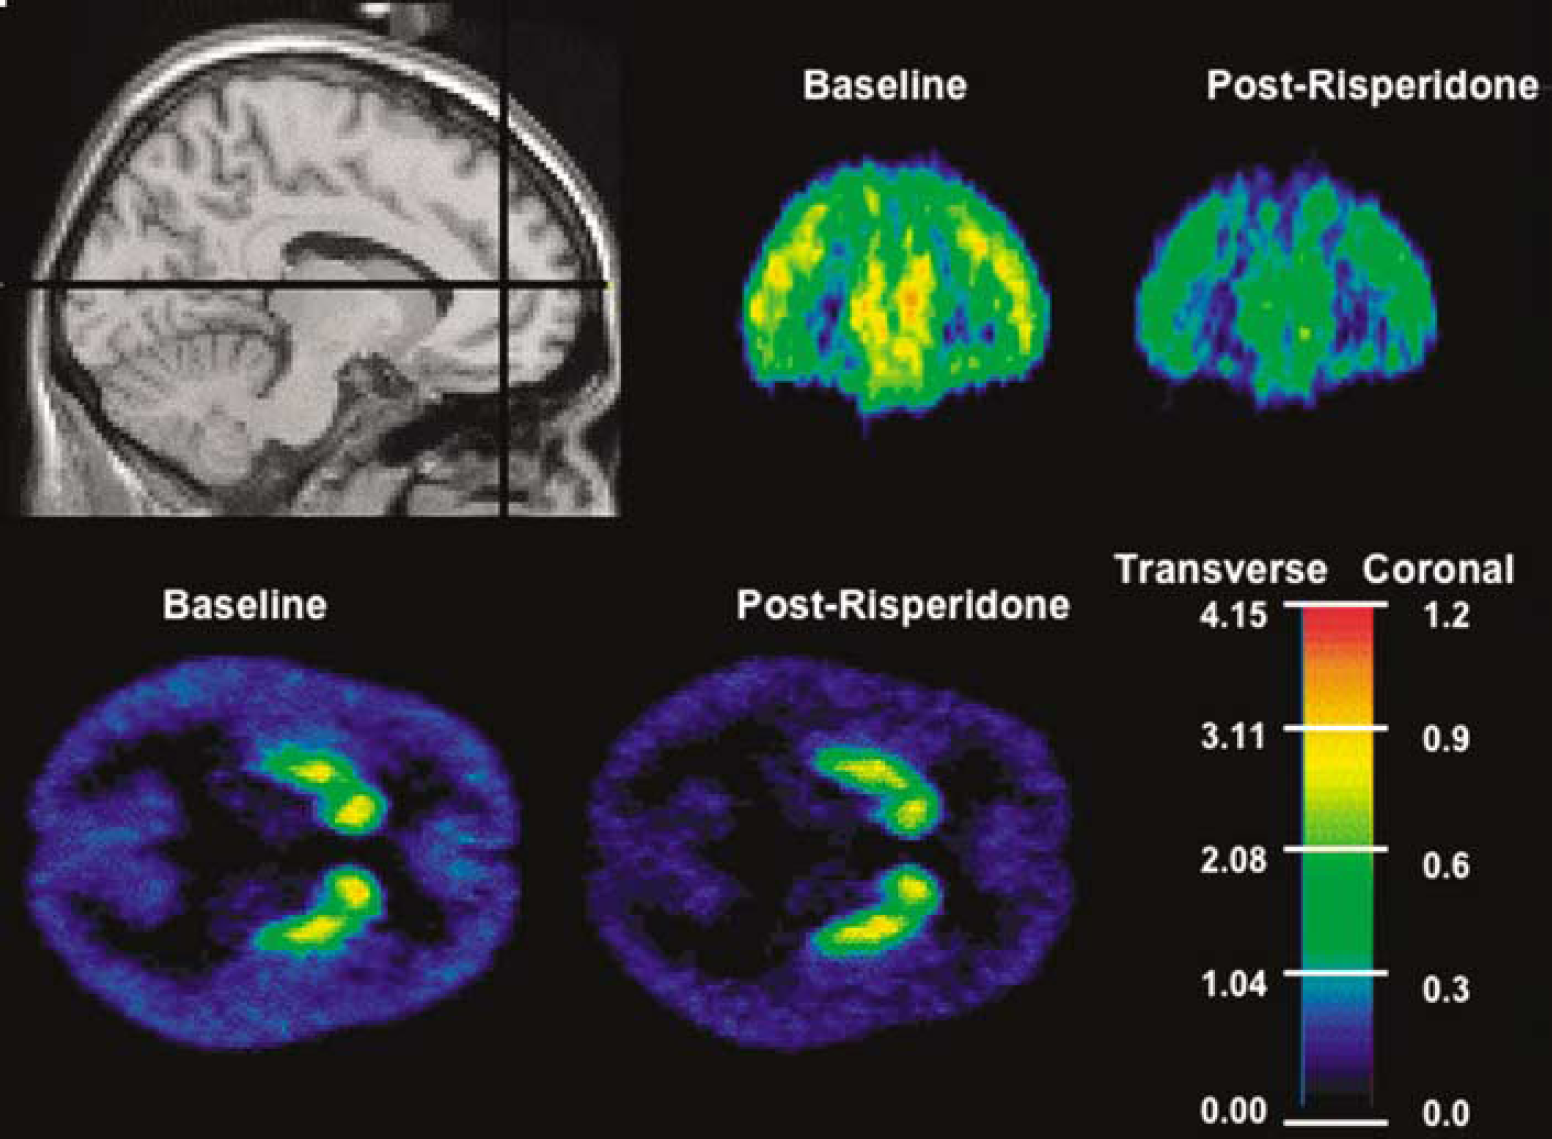
Mean (across n = 7 subjects) V″3 maps generated on pre- and postrisperidone data with the SRTM algorithm. Lines in the MRI show the coronal and transverse slice levels of the parametric maps. Different scaling was used to display the cortical (coronal) and striatal (transverse) values due to different V″3 magnitudes in these regions, but the same scaling was used across conditions.
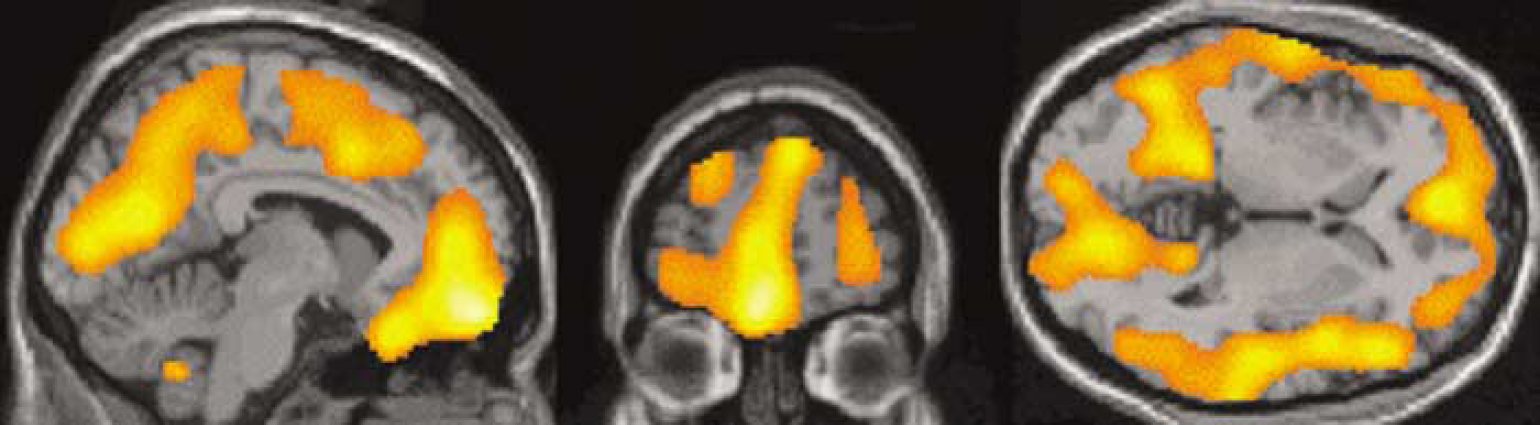
T maps generated in SPM. Significance level for display is P = 0.01. The slice levels are similar to those in Figure 1. High t-values cover most of the cortex but not the striatum (transverse view). (Statistical analysis presented in the Results section.)
Discussion
Observed change after risperidone: The measured ΔV″3 in cortical regions ranged from approximately 20% to 30%, whereas those in striatal subregions were all in the ±10% range. Statistical analysis showed the changes in the cortical regions decreases significantly different than 0, those in the striatal subregions not significantly different than 0, and some ambiguity in amygdala. Given the specificity profile of risperidone (see discussion below), the putative cause of these changes is blockade of 5-HT2A receptors. The density of 5-HT2A is approximately double that of D1 in primate cortex (Lidow et al, 1989), whereas 5-HT2A density is negligible compared with D1 in striatum. Assuming the ratio of densities in cortex is 5-HT2A:D1 = 2:1 and that the change in [11C]NNC 112 binding is due to blockade of 5-HT2A receptors, ΔV″3 in the range of 20% to 30% is consistent with D1:5-HT2A selectivity of this ligand in the range of 5- to 8-fold, as opposed to the 100-fold selectivity reported previously in the in vitro literature (Andersen et al, 1992). The lack of change in striatum is also consistent with the known receptor densities and serves as an internal control to show that D1 binding was not affected by the risperidone challenge. These data are also consistent with our recent study (Ekelund et al, in press) in which we tested the selectivity of both [11C]NNC 112 and [11C]SCH23390 for D1 and 5-HT2A in baboons using different pharmacological models than those used here. In that study, blocking doses of the selective 5-HT2A antagonist MDL 100907 caused changes with both radioligands similar to those observed in this study: approximately 25% reduction of binding in cortex, but no detectable change in striatum. Further analyses in that study of the separate affinities of [11C]NNC 112 for D1 and 5-HT2A also showed selectivity in the 10-fold, rather than 100-fold range.
Risperidone blockade: The selectivity profile of risperidone for 5-HT2A:D1 has been measured in the range of 3000 to 4000 (Leysen et al, 1992; Megens et al, 1994; Schotte et al, 1996). In data collected for an unrelated study, we found that a 4mg dose of risperidone resulted in complete blockade (> 97% in all brain regions) of [11C]MDL 100907 binding in two human subjects (unpublished data). Assuming brain concentrations of risperidone to be linear with ingested dose, and that the true occupancy exceeded 97% after 4mg of risperidone, 2mg of risperidone would occupy in excess of 94% of 5-HT2A receptors. This follows from halving the free concentration associated with 97% occupancy in the Michaelis—Menten formula. We also note that 5-HT2A occupancy in excess of 95% was reported following doses of 2 to 4mg of risperidone in a study of patients with schizophrenia (Kapur et al, 1999). Thus, it appears reasonable to assume that the direct effects of risperidone on [11C]NNC 112 binding in this study were complete blockade of 5-HT2A and negligible change of D1 availability.
Relationship between in vitro and in vivo studies: Quantitative results from a prior in vitro study (Andersen et al, 1992) regarding the selectivity of [11C]NNC 112 appear to be discrepant with those obtained in the present study by in vivo imaging in humans. Similar lack of accord between in vitro and in vivo affinities has been previously observed with other tracers. For example, in vitro binding studies (Mukherjee et al, 1996) have suggested that the affinity of the DA D2 receptor antagonist [18F]fallypride for D2-like receptors is several orders of magnitude higher than that of [11C]raclopride. In our hands, however, direct measurement of the affinity of [18F]fallypride from in vivo imaging data in baboons has shown its affinity to be more on the order of 10-fold higher than that of [11C]raclopride (Slifstein et al, 2004), a result that is consistent with quantitative comparison between these ligands from our own imaging data in humans (Abi-Dargham et al, 2000a; Mawlawi et al, 2001). These results show that while rodent and in vitro studies may be appropriate for proof of concept, quantitative information about radioligand binding in humans is more appropriately derived from in vivo studies in humans and nonhuman primates.
Cerebellum as a reference region: Cerebellum was used to estimate nondisplaceable distribution volume in this study, explicitly with the 2TCM approach and implicitly with SRTM. The assumptions regarding a reference region are that the concentration of the receptors of interest is negligible, and its total distribution volume is equal to that of the nondisplaceable compartments in regions of interest. D1 concentration is known to be negligible in cerebellum, and D1 binding will not be affected by risperidone. The literature regarding the presence of 5-HT2A receptors in human cerebellum is equivocal, with some autoradiography studies detecting low levels of [3H]ketanserin binding in cerebellum (Eastwood et al, 2001; Pazos et al, 1987), while another could not detect any specific binding with [3H]MDL100907 (Hall et al, 2000). In the present study, had there been detectable specific binding of [11C]NNC 112 in cerebellum, distribution volumes there would have decreased following the challenge (leading to underestimation of [11C]NNC 112 binding to 5-HT2A receptors), but that was not observed. In fact, a slight increase was observed in the mean of V2 between conditions. This did not reach statistical significance and is of similar magnitude to previously observed test—retest variability in cerebellum distribution volume (Abi-Dargham et al, 2000b) and thus quite likely predominantly measurement error. This small change in cerebellum by itself would not have led to the observed difference between cortex and striatum had both sets of regions decreased to the same extent as each other after risperidone. To see this, let γ equal the ratio of true postchallenge V″3 to prechallenge V″3 (i.e., the true decrease is (1–γ)100%) and let β equal the increase in measured cerebellum distribution volume (β = 1.076 in the present study). Then putting these values into the formula for ΔV″3 (Eq 1 and Eq 2) leads to
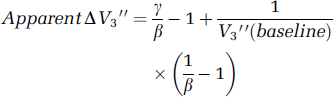
The first term is independent of regional values and sets the minimal observed reduction independent of V″3. For mean baseline V2 of 2.1, typical cortical V″3 of 0.7, and striatal V″3 of 3.0, one finds from the above formula that an observed ΔV″3 in cortex of −26% (the mean of the measured cortical values in Table 2) would have resulted from a true ΔV″3 of −9%. However, true ΔV″3 = −9% in striatum would lead to apparent ΔV″3 of −19%. Given that the observed mean change between conditions across striatal subregions was 0% ± 6%, such an artifact cannot explain the difference observed between striatal and cortical subregions in this study. We conclude that blocking of 5-HT2A receptors by risperidone combined with the higher ratio 5-HT2A:D1 available for binding in cortex relative to striatum is a more plausible explanation of these data than any artifact caused by use of cerebellum as a reference region.
Use of a single specific binding compartment: The model we are proposing in this study is that there are two distinct specific binding pools for [11C]NNC 112 with distinct kinetic properties, yet both methods of analysis (2TCM and SRTM) are based on the assumption that there is one pool. It would not have been possible to uniquely identify two separate specific binding compartments in the absence of further constraints, but our choice of methods requires that the sum of the two specific binding compartments can be reasonably well approximated by a single compartment. If this is not the case, there may have been some impact on the precision of the occupancy estimates, but the main result (much greater reduction in binding in cortex than striatum following blockade of 5-HT2A receptors by risperidone) is still well supported. This is evident in Figure 3, where mean TACs across subjects and between conditions are presented. These curves represent raw data without reference to any model, normalized by injected activity and subjects' body mass, at baseline and following risperidone. From the figure, it is clear that the fractional decrease after risperidone is greater in DLPFC than striatum. The ratio of the area under the curve after risperidone to the baseline value is 81% for DLPFC and 94% for striatum. Figure 4 shows estimated specific binding (one specific binding compartment) derived from the 2TCM model applied to the same data, with the additional constraint that V2 in each region equals the distribution volume of cerebellum in the same experiment. The AUC ratios are 69% in DLPFC and 96% in striatum.
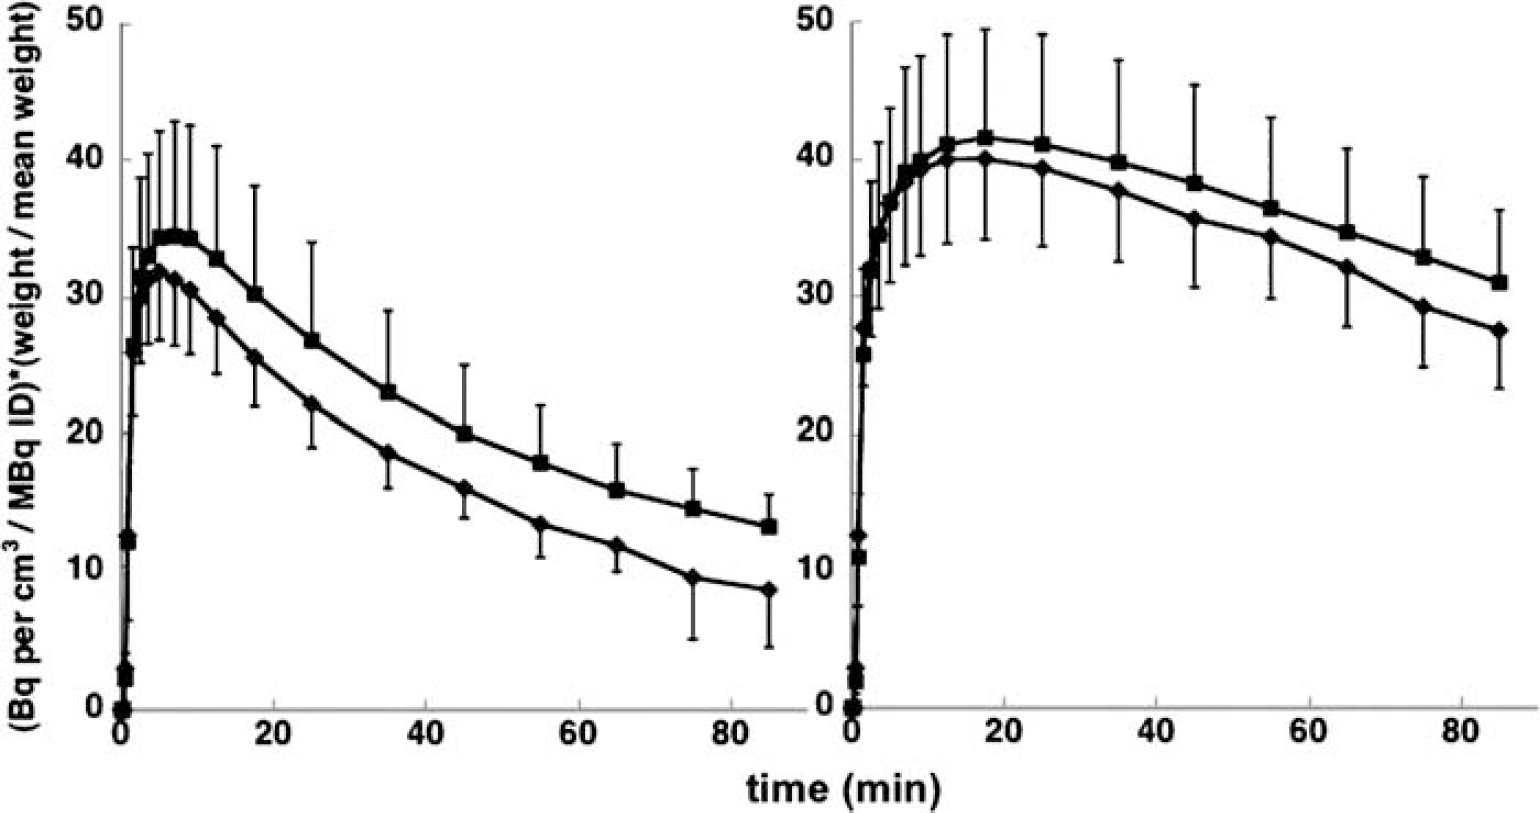
Mean (across subjects) ± s.d. TACs in DLPFC (left panel) and whole striatum (right panel) under control conditions (■) and after risperidone (♦). Data were normalized to injected activity and body mass to facilitate averaging across subjects.
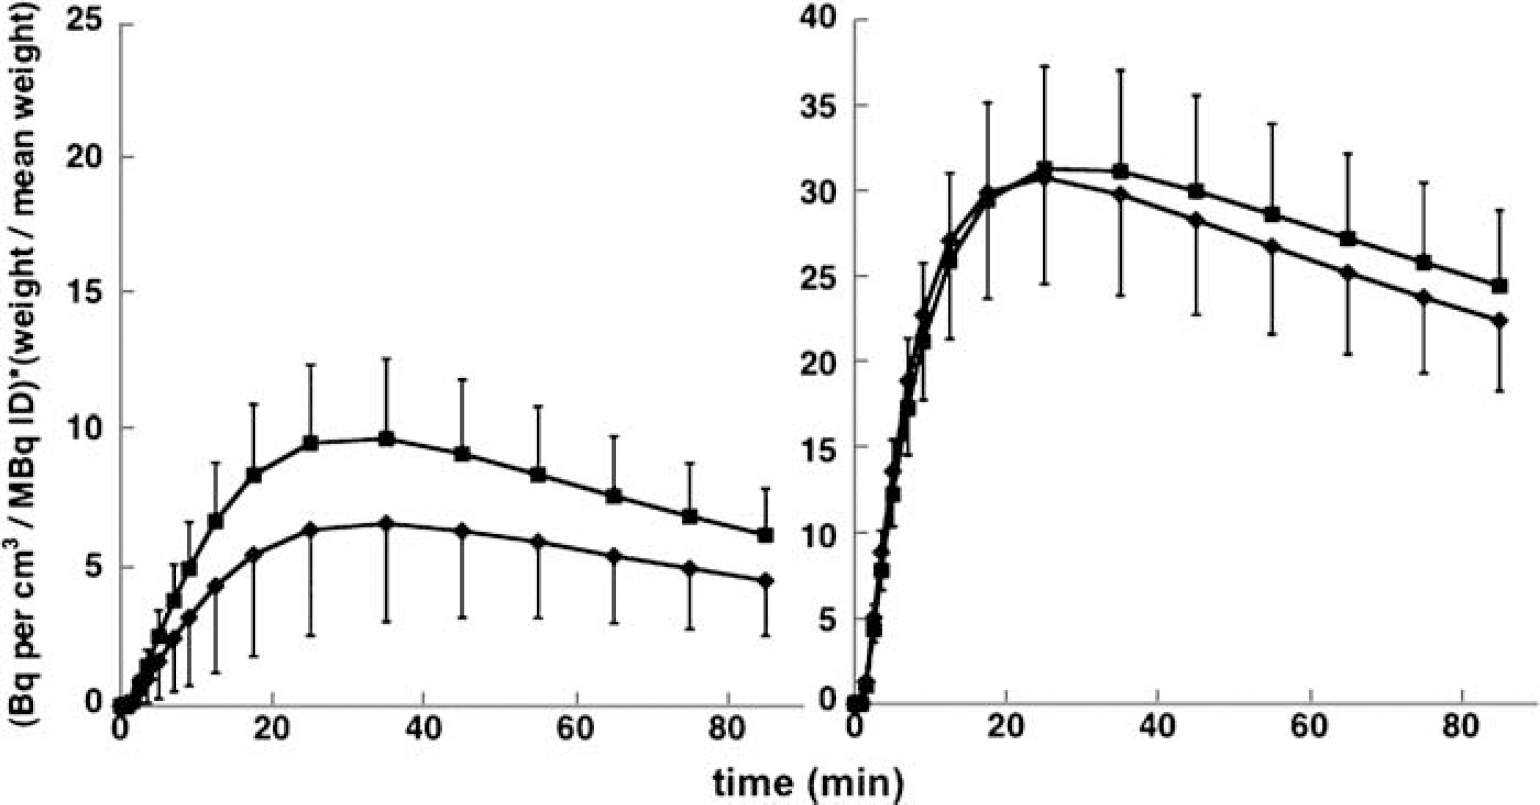
Mean (across subjects) ± s.d. TACs of specific binding in DLPFC (left panel) and whole striatum (right panel) under control conditions (■) and after risperidone (♦). Data were normalized to injected activity and body mass to facilitate averaging across subject.
Implications for studies in humans: Because similar results were obtained for both [11C]NNC 112 and [11C]SCH23390 in the baboon experiments (Ekelund et al, in press) and a similar range of 5-HT2A binding of [11C]NNC 112 in cortical regions was observed in baboons and humans, we expect that [11C]SCH23390 will show a similar lack of selectivity in humans. Thus, differences in selectivity between tracers are unlikely to explain the differences in results in schizophrenia obtained with the two tracers. This discrepancy remains unexplained at this point in time; studies with both tracers in the same patients may be the best approach to assess whether differences between studies are related to the tracers used or to the different samples.
Recently, Chou et al (2006) have published a PET study in monkeys in which, after a challenge with the antipsychotic drug clozapine, greater binding decreases of [11C]NNC 112 were observed in cortex than in striatum. These authors interpreted their data as evidence that clozapine binds to D1-like receptors with higher affinity in cortex than striatum. But in light of clozapine's high affinity for 5-HT2A and demonstrated occupancy of 5-HT2A receptors when administered in the dose range used in that study (Schotte et al, 1996), the results we have presented here suggest the alternative explanation that the larger binding decrease observed in cortex compared with striatum was owing to 5-HT2A blockade.
The lack of selectivity of [11C]NNC 112 for D1 in the cortex introduces another layer of complexity in the interpretation of findings with this tracer in schizophrenia (Abi-Dargham et al, 2002), in human ketamine users (Narendran et al, 2005) and monkeys treated with N-methyl-
Conclusion
In this study, we observed that binding of [11C]NNC 112 in the cortex in healthy volunteers was reduced by 20% to 30% after administration of 2 mg of risperidone orally. Because striatal binding was unaffected, we conclude that displacement reflects binding to the 5-HT2A receptor in vivo in humans, a result that was not predicted from the in vitro affinity ratio. This highlights the importance of careful characterization of tracers in the in vivo setting and the need for more selective D1 tracers to probe dopaminergic function in the cortex.
Footnotes
Acknowledgements
The authors thank Norman Simpson and his staff for radioligand support and Elizabeth Hackett, John Castrillon, Jennifer Bae, and Erica Sher for PET acquisition and data analysis support.