
Abstract
Although the impact of neuronal excitation on the functional activity of brain is well understood, the nature of functional responses to inhibitory modulation is far from clear. In this work, we investigated the effects of modulation of the metabotropic GABAB receptor on brain metabolism using a targeted neuropharmacological, 1H/13C nuclear magnetic resonance spectroscopy, and metabolomic approach. While agonists at GABAB receptors (Baclofen and SKF 97541) generally decreased metabolic activity, mild agonist action could also stimulate metabolism. Less potent antagonists (CGP 35348, Phaclofen) significantly decreased metabolic activity, while more potent antagonists (CGP 52432 and SCH 50911) had opposite, stimulatory, effects. Examination of the data by principal components analysis showed clear divisions of the effects into excitatory and inhibitory components. GABAergic modulation can, therefore, have stimulatory, inhibitory, or even neutral net effects on metabolic activity in brain tissue. This is consistent with GABAergic activity being context dependent, and this conclusion should be taken into account when evaluating functional imaging data involving modulation of neuronal inhibition.
Introduction
The major inhibitory neurotransmitter in the brain, γ-aminobutyric acid (GABA) mediates its effects via two major receptor types; a subset of ionotropic receptors known as GABAA receptors (includes the ionotropic ρ subunit-containing GABAC receptors) and the metabotropic GABAB receptor. Compared with GABAA receptors (Barnard et al, 1998; Rudolph et al, 2001), the subunit heterogeneity and pharmacology of GABAB receptors is relatively simple. There are two identified subunits, GABAB1 and GABAB2, and the receptor is an obligate heterodimer with the GABAB1 subunit responsible for GABA binding while the GABAB2 subunit is critical for interacting with the G-protein coupled second messenger cascade (Bettler et al, 2004). While a number of splice variants have been identified, it is not yet clear whether any of these are active in vivo apart from the GABAB1a and GABAB1b variants (Bowery et al, 2002). The receptor is found widely distributed throughout the brain (Charles et al, 2003; Fritschy et al, 1999) at both pre- and postsynaptic locations (Deisz et al, 1997). The GABAB1a and GABAB1b variants have been associated with pre- and postsynaptic locations respectively (Billinton et al, 1999; Perez-Garci et al, 2006) and the GABAB1a isoform with presynaptic autoreceptors inhibiting glutamate release, while GABAB1b in the hippocampus mainly mediates postsynaptic inhibition (Perez-Garci et al, 2006; Vigot et al, 2006; for a review see Bettler et al, 2004). Additionally, GABAB receptors are located extrasynaptically (Pham et al, 1998). Blockage of presynaptic GABAB receptors has been reported to require five- to 10-fold higher concentrations of antagonists than postsynaptic GABAB receptors (Pozza et al, 1999), but currently no truly pharmacologically distinct populations of receptors have been identified.
At present, the impact of inhibitory activity on neuronal activity and hence brain energy demands and metabolism is an open subject. The relationship of excitatory activity to metabolism is now reasonably well described (Shmuel et al, 2006; Sibson et al, 1998). However, almost any changes in neuronal activity require increased ionic conductance resulting in greater passive movements of ions across the membranes that have to be compensated by increased energy-dependent active transport. Therefore, both increased excitatory or inhibitory activity could manifest as increased signal in fMRI or positron emission tomography (Ackermann et al, 1984) (but there are alternative opinions; Lauritzen, 2005).
The results, to date, examining the effect of inhibitory input have been somewhat contradictory. γ-Aminobutyric acid uptake in astrocytes was found not to be linked to significant energy demand, and it was therefore concluded that GABA-ergic activity is unlikely to contribute to brain imaging signals based on 2-deoxyglucose (Chatton et al, 2003). This is in contrast to earlier reports, which showed varying 2-deoxyglucose uptake to various GABA ligands, including muscimol, bicuculline, and THIP (Palacios et al, 1982; Peyron et al, 1994; Roland and Friberg, 1988); indeed, it has been suggested that the metabolic response is dependent on the inhibition context, local connectivity, and type of inhibitory connection (Tagamets and Horwitz, 2001).
In contrast to GABAA-mediated inhibition, there is a dearth of data on the effect of GABAB activity on brain metabolism. However, the GABAB receptor is not only less variable than the GABAA receptor, in terms of having fewer available subunits and isoforms, but also has the advantage that pharmacologically specific drugs are available for its study. We have developed a guinea-pig cortical brain tissue slice model system of metabolism, which produces a ‘metabolic fingerprint’ in response to metabolism of the stable isotope 13C, supplied as [3-13C]pyruvate. This approach has been shown to be robust, reproducible, and capable of distinguishing subtle differences in the metabolic functional activity induced by a range of receptors and/or transporters. Further, the metabolic fingerprint can be analyzed by multivariate statistics, allowing identification of ligands that result in similar metabolic outcomes ligands (Moussa et al, 2002; Moussa et al, 2007; Rae et al, 2000, 2003, 2005b, 2006; Stanton et al, 2003). In this work, we used this approach to determine the metabolic sequelae of modulation of the GABAB receptor, using both classic and more recently developed ligands.
Materials and methods
Materials
Guinea-pigs (Dunkin-Hartley), weighing 400 to 800 g, were fed ad libitum on standard guinea-pig/rabbit pellets, with fresh cabbage leaves and lucerne hay roughage. Animals were maintained on a 12 h light/dark cycle. All experiments were conducted in accordance with the guidelines of the National Health and Medical Research Council of Australia and were approved by the institutional (UNSW) Animal Care Ethics Committee.
Sodium [3-13C]pyruvate and sodium [13C]formate were purchased from Cambridge Isotope Laboratories Inc. (Andover, MA, USA). (RS)-Baclofen (Baclofen, (RS)-4-amino-3-(4-chlorophenyl)butanoic acid); SKF 97541 (CGP 35024, 3-aminopropyl(methyl)phosphinic acid); CGP 35348 ((3-aminopropyl) (diethoxymethyl)phosphinic acid); CGP 52432 (3-[[(3,4-dichlorophenyl)methyl]amino]-propyl]diethoxymethyl)phosphinic acid), SCH 50911 ((+)-(S)-5,5-dimethylmorpholinyl-2-acetic acid), and phaclofen (3-[[(3,4-dichloromethyl)methyl]amino]propyl] diethoxymethyl)phosphinic acid) were purchased from Tocris Cookson, UK. All other reagents were of AR grade.
Preparation of Brain Cortical Tissue Slices
Guinea-pigs were killed by cervical dislocation. The brain was rapidly removed from the cranial vault, and the cortex dissected, and chopped into 350 μm slices in the paraxial plane using a McIlwain tissue chopper. The resulting slices were immediately washed three times in a modified Krebs–Henseleit buffer (124 mmol/L NaCl, 5 mmol/L KCl, 1.2 mmol/L KH2PO4, 1.2 mmol/L CaCl2, 1.2 mmol/L MgSO4, and 26 mmol/L NaHCO3 (Badar-Goffer et al, 1990) resuspended for 1 h in fresh buffer containing 10 mmol/L unlabelled glucose and gassed with 95% O2/5% CO2 in a shaking water bath, maintained at 37°C, to allow metabolic recovery (McIlwain and Bachelard, 1985). Slices were then washed three times in glucose-free buffer and resuspended in fresh buffer with the substrate of choice.
Modulation of GABAB Activity
To determine the effect of modulation of GABAB receptors on metabolic activity, slices were incubated with 2 mmol/L sodium [3-13C]pyruvate (control) and also, in the case of ligand treatment groups, with one of two concentrations of the ligand. We used 2 mmol/L sodium [3-13C]pyruvate as the 13C substrate as this compound in our experience (Rae et al, 2000, 2003, 2005b, 2006) labels a higher proportion of metabolites (it is problematic, for example, adequately to label aspartate and glutamine in the brain slice using [1-13C]glucose) as well as a larger number of metabolic compartments within the slice. This is not because pyruvate is a more efficiently used substrate than glucose, but simply reflects improved penetration of the label because of the higher relative concentration of [3-13C]pyruvate. At 2 mmol/L, pyruvate satisfies maximal respiration rates similar to those provided by 5–10 mmol/L glucose (McIlwain and Bachelard, 1985).
Ligands used included the GABAB agonists, 1 and 10 μmol/L Baclofen (specific and classic GABAB agonist (Davies and Watkins, 1974)), 0.2 and 2.0 μmol/L SKF 97541 (CGP 35024, potent GABAB agonist (Froestl et al, 1995)), and the GABAB antagonists, CGP 35348 (50 and 200 μmol/L, brain penetrant antagonist with higher affinity at pre- versus postsynaptic receptors (Olpe et al, 1990)), 0.1 and 1.0 μmol/L CGP 52432 (potent antagonist most effective at GABAB autoreceptors (Lanza et al, 1993)), and 5 and 50 μmol/L SCH 50911 (potent, orally active competitive antagonist, (Ong et al, 1998)), and 100 and 300 μmol/L Phaclofen (classic antagonist at GABAB (Kerr et al, 1987)). Phaclofen was dissolved in NaOH and the pH of the incubation buffer subsequently adjusted to that of the control buffer using HCl.
The concentrations of ligands were chosen to reflect the affinity of GABAB agonists and antagonists and to separate other possible nonspecific activities. Typically, the concentrations studied were around the KM or Kd (whichever published values were available) and 10 times this amount.
Slices were incubated for 1 h with [3-13C]pyruvate and the experiment was stopped as indicated.
Preparation of Samples and Nuclear Magnetic Resonance Analysis
On completion of the incubation period, slices were removed from the incubation buffer by rapid filtration and extracted in methanol/chloroform according to the method of Le Belle et al (2002). Extracts were lyophilized, and the pellet retained for protein estimation by the Lowry technique. Lyophilized supernatants were stored at −20°C until required for nuclear magnetic resonance analysis. Samples were resuspended in 0.65 mL D2O containing 2 mmol/L sodium [13C]formate as an internal intensity and chemical shift reference (13C δ 171.8). Fully relaxed 1H and 1H[13C-decoupled] spectra (total cycle of 30 secs, comprising 24 secs relaxation delay, 4 secs water suppression, and ∼ 2 secs acquisition time), WURST-40 (Kupce and Freeman, 1995) with a 112-step phase cycle (Skinner and Bendall, 1997), decoupling during acquisition were obtained at 600.13 MHz on a Bruker DRX-600 spectrometer with a 5-mm dual 1H/13C probe, followed by 13C [1H-decoupled] spectra (typically 3000–5000 transients, cycle of 4 secs comprising 2 secs relaxation delay and ∼ 2 secs acquisition time, continuous WALTZ-16 decoupling) 131072 data points. Assignments were made as described previously (Rae et al, 2000).
13C [1H-Decoupled] spectra were transformed using 3 Hz exponential line-broadening and peak areas were determined by integration using standard Bruker software (TOPSPIN, Version 1.3) after baseline correction. Peak areas were adjusted for nuclear Overhauser effect, saturation and natural abundance effects, and quantified by reference to the area of the internal standard resonance of [13C]formate. Glu C3 was not quantified because of possible resonance overlap with residual pyruvate dimer, as described previously (Rae et al, 2000). Metabolite pool sizes (lactate, alanine, GABA, glutamate, glutamine, and aspartate) were determined by integration of resonances in fully relaxed 600 MHz 1H[13C-decoupled] spectra using [13C]formate as the internal intensity reference.
Experimental data (N = 4) are given as means (standard deviation). Statistical analysis was performed using ANOVA for comparing ligand-treated metabolism at each receptor with control (N = 24), followed, only where statistical significance was indicated by Scheffe F-test, by a nonparametric (Mann–Whitney U test) test (Statview Student). Significance was assumed at α = 0.05.
Pattern Recognition of the Data
Multivariate pattern recognition and data reduction tools are preferable to standard univariate statistical approaches since they have the capacity to handle hundreds of variables simultaneously and can cope with numerous co-linearities in the data set, making them a powerful tool in systems biology (Goodacre et al, 2004; Rochfort, 2005). Principal components analysis (PCA) is a projection method designed to extract and highlight the inherent variation in a data set by defining a series of principal components (PCs). The approach is unsupervised and classifies the data into groups solely based on the variables that change the most and no information is given regarding class membership. Thus, it is less liable to over-fitting compared with supervised techniques. To assess model robustness, the fractional variance represented by a model is calculated by R2 (a goodness of fit algorithm). An R2 > 0.60 signifies a highly robust model explaining the majority of variance in the data set; in the case of this work, all models had R2 > 0.7 across three components.
Each experiment (representing two drug concentrations) was performed with its own control sample. The control samples for all experiments were averaged. These mean values were then subtracted from the samples exposed to drugs to produce a new data set that represented the effect of the drug less the metabolic fluxes/pool sizes of the relevant control samples. Pattern recognition was performed on this change in metabolism, rather than pool size/flux rates per se; this latter analysis is shown in Figure 1 and Table 1, while the PCA of the drug effects is shown in Figures 2 and 3. This is a departure from our previous approach to PCA of such data, where the first PC has always represented the variance in the control versus the experimental data (Rae et al, 2005b, 2006). This variance is illustrated well in Figure 1 and is less interesting.
Total metabolite pool sizes
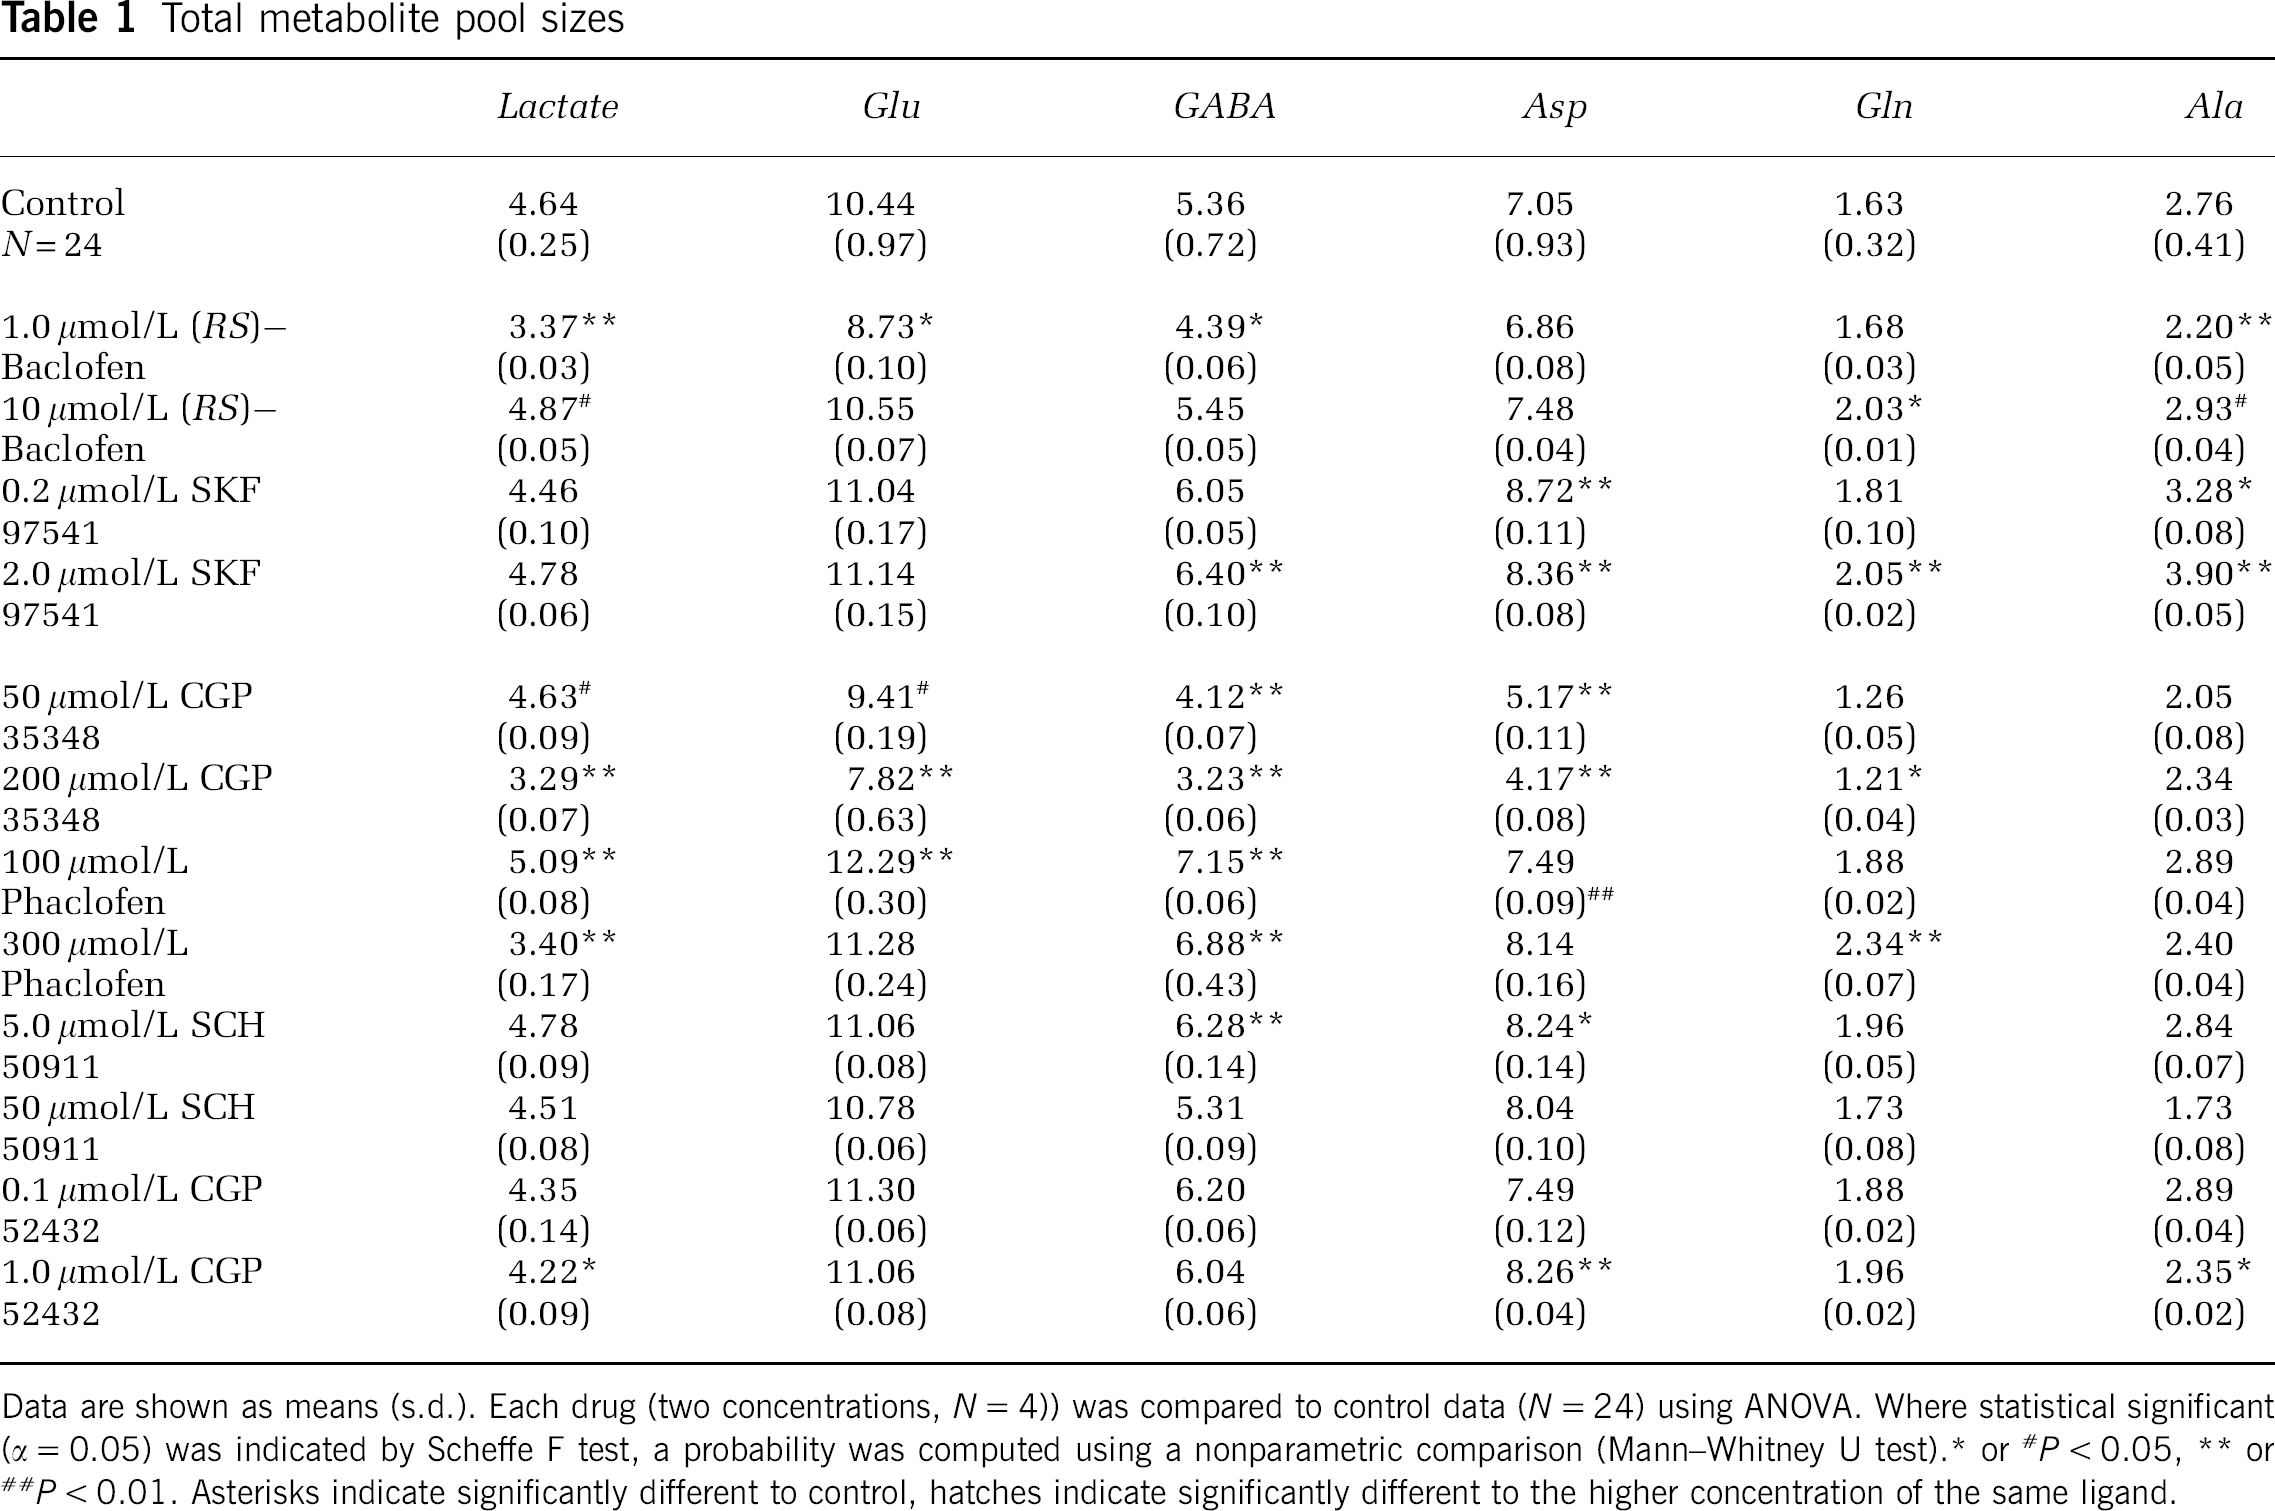
Data are shown as means (s.d.). Each drug (two concentrations, N = 4)) was compared to control data (N = 24) using ANOVA. Where statistical significant (α = 0.05) was indicated by Scheffe F test, a probability was computed using a nonparametric comparison (Mann–Whitney U test).* or #P < 0.05, ** or ##P < 0.01. Asterisks indicate significantly different to control, hatches indicate significantly different to the higher concentration of the same ligand.
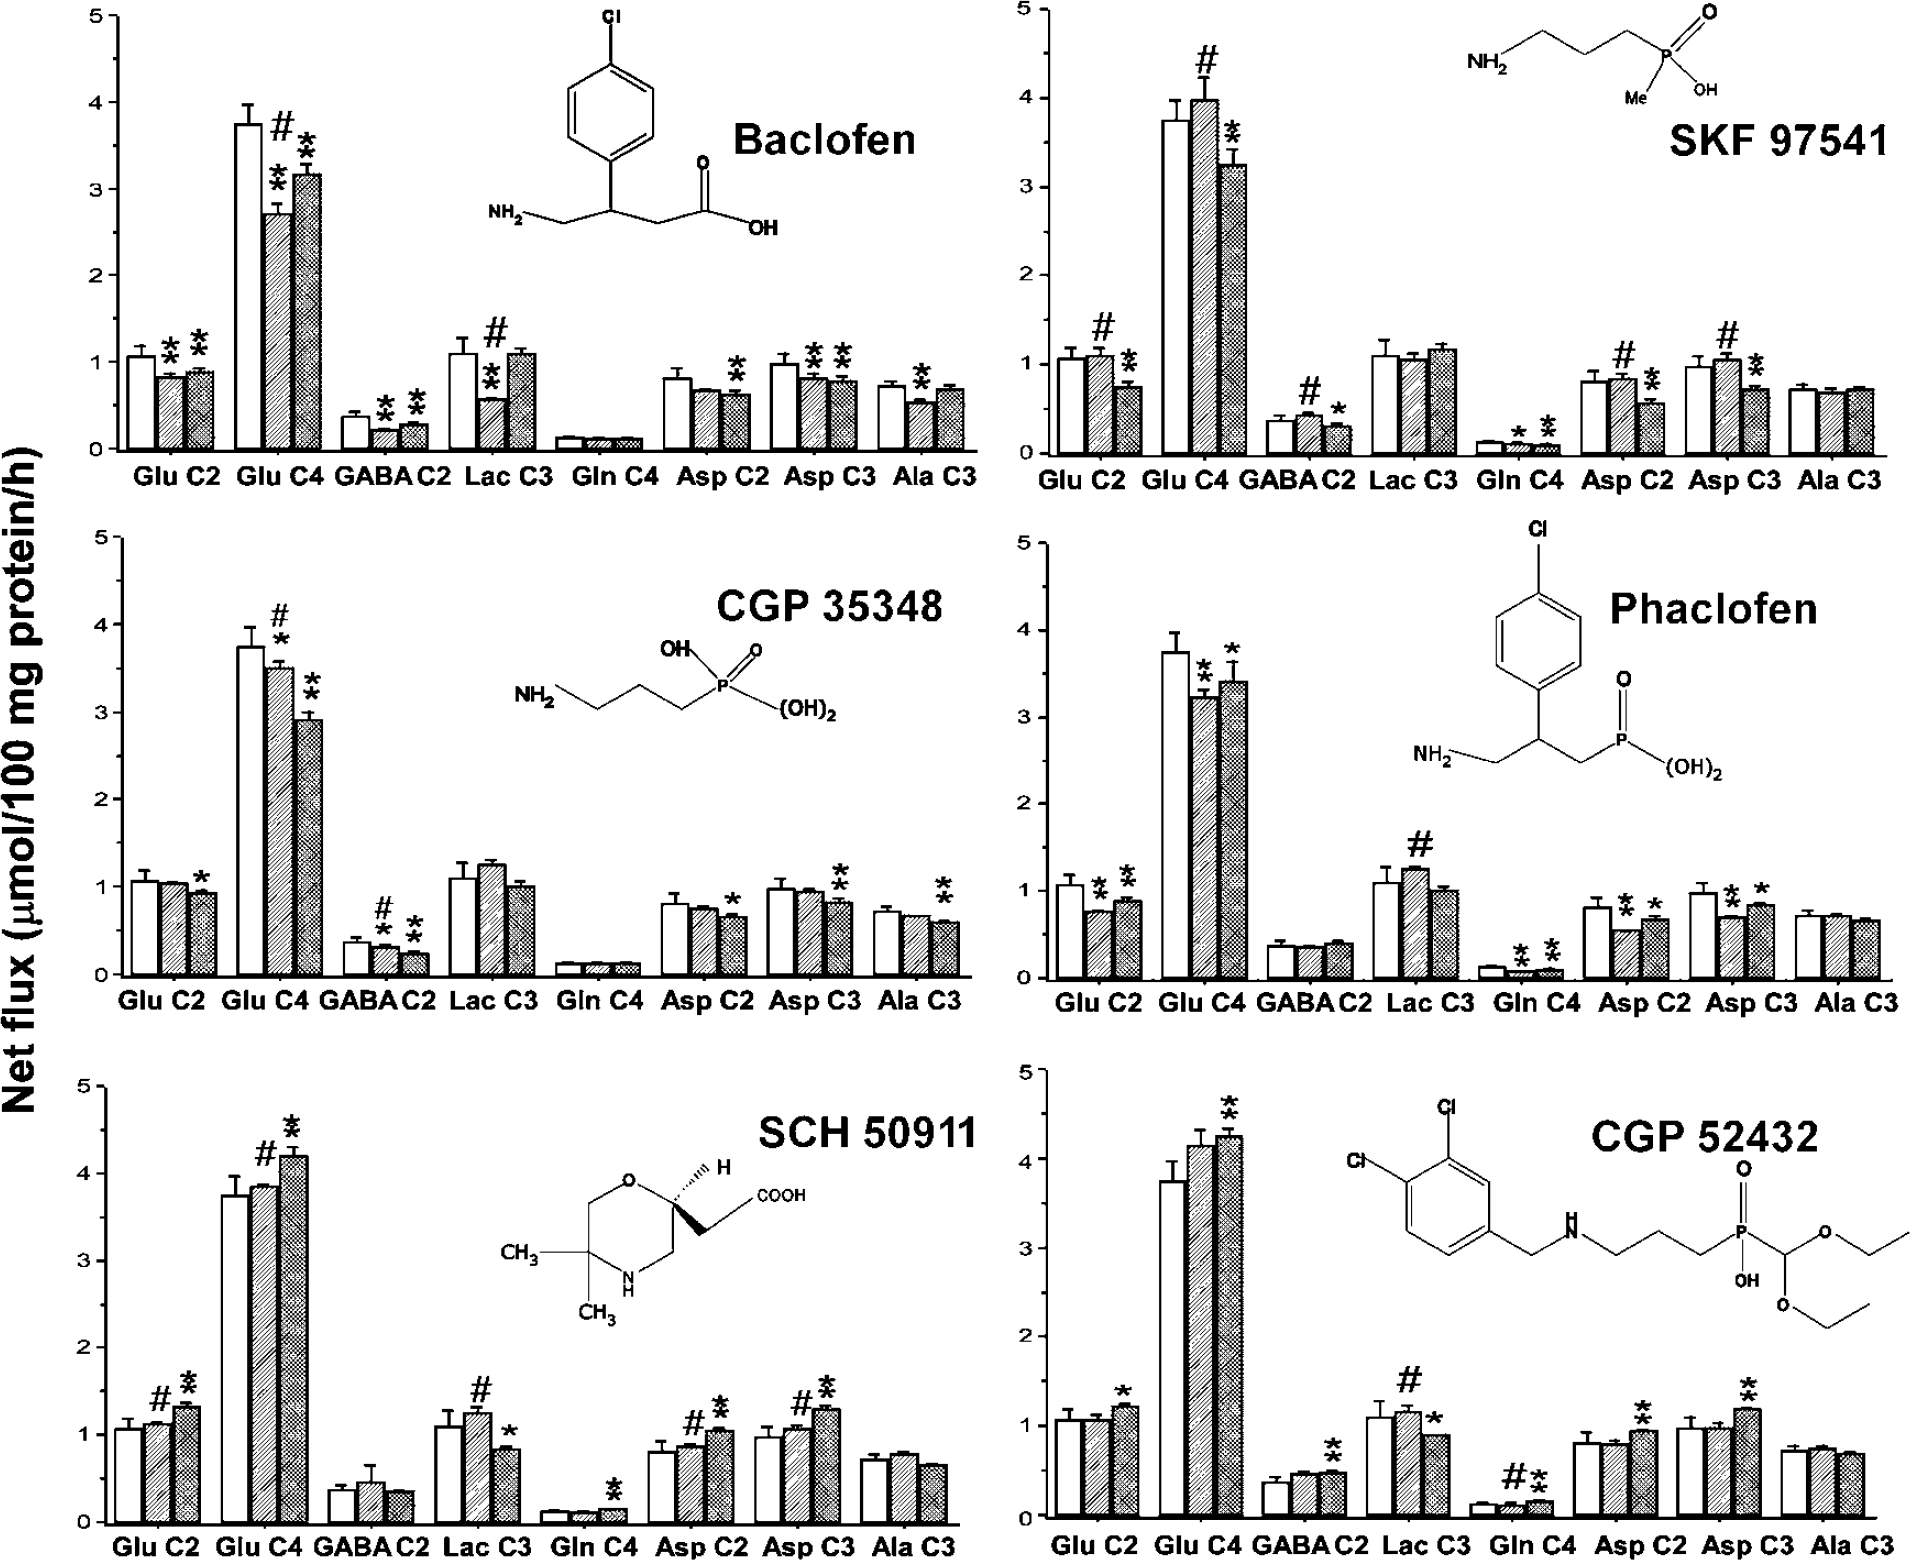
Effects of GABAB receptor ligands on net flux of 13C in brain cortical tissue slices incubated 1 h with sodium [3-13C]pyruvate. Clear bars, control (N = 24); hatched bars, lower dose of ligand (N = 4); cross-hatched bars, higher dose of ligand (N = 4). Values shown are means, while error bars show standard deviations. *Significantly different to control; # significantly different to higher dose ligand. * or #P < 0.05, ** or ##P < 0.01.
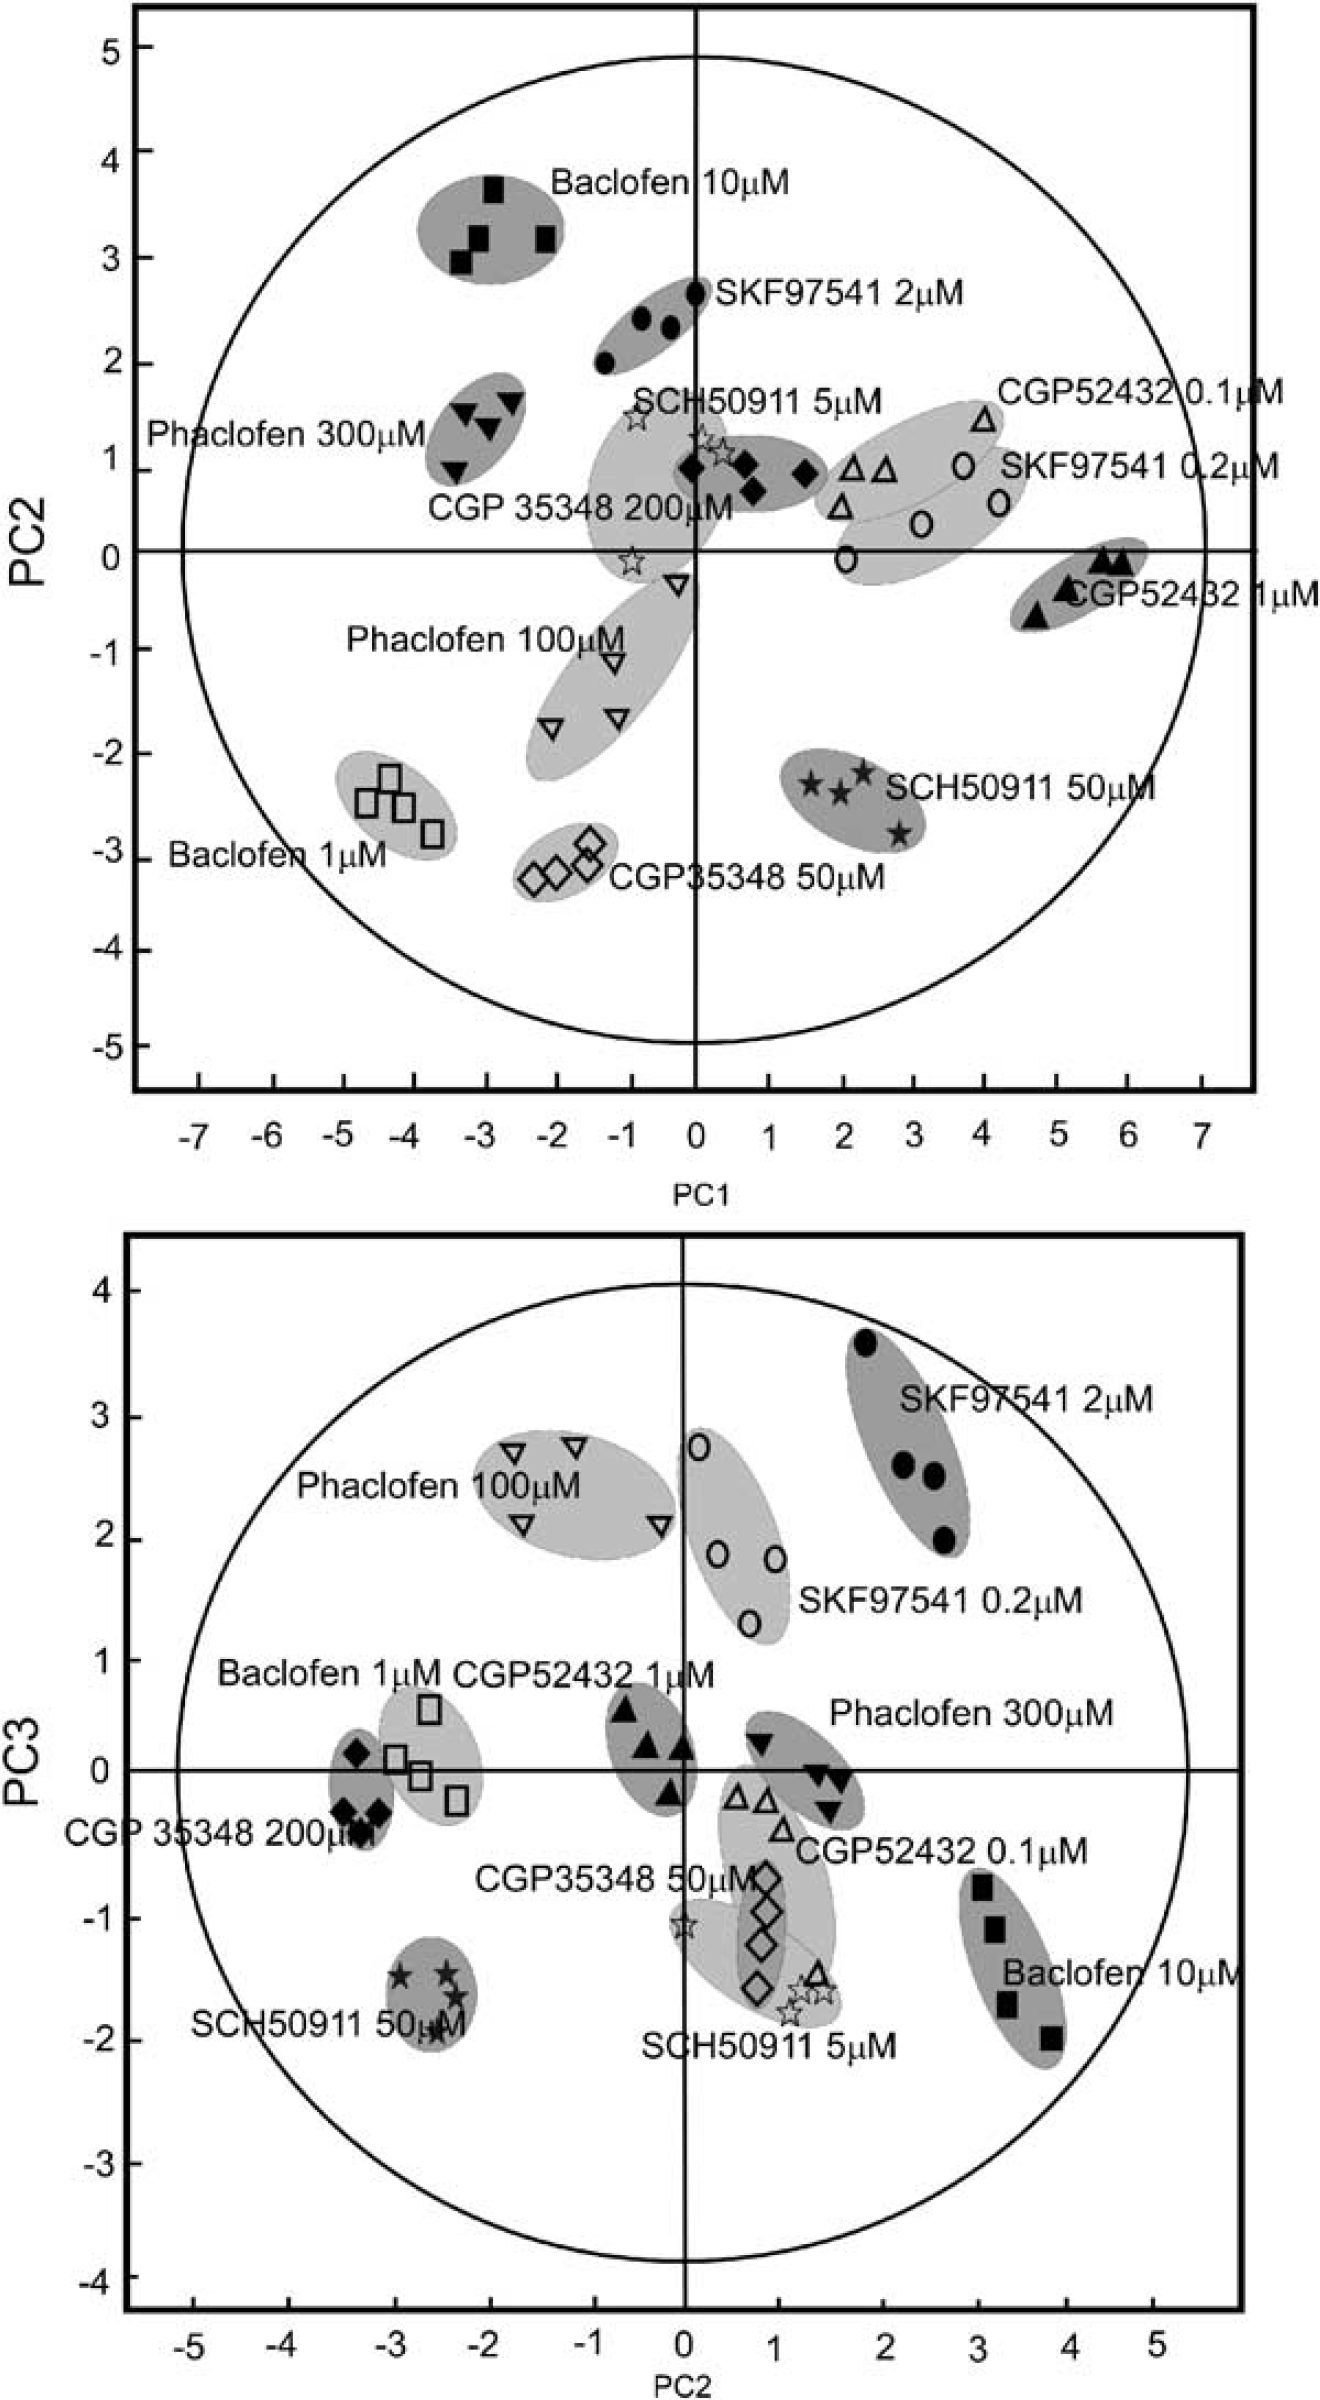
Principal components analysis of labelling and total metabolite concentrations for GABAB receptor ligands. (
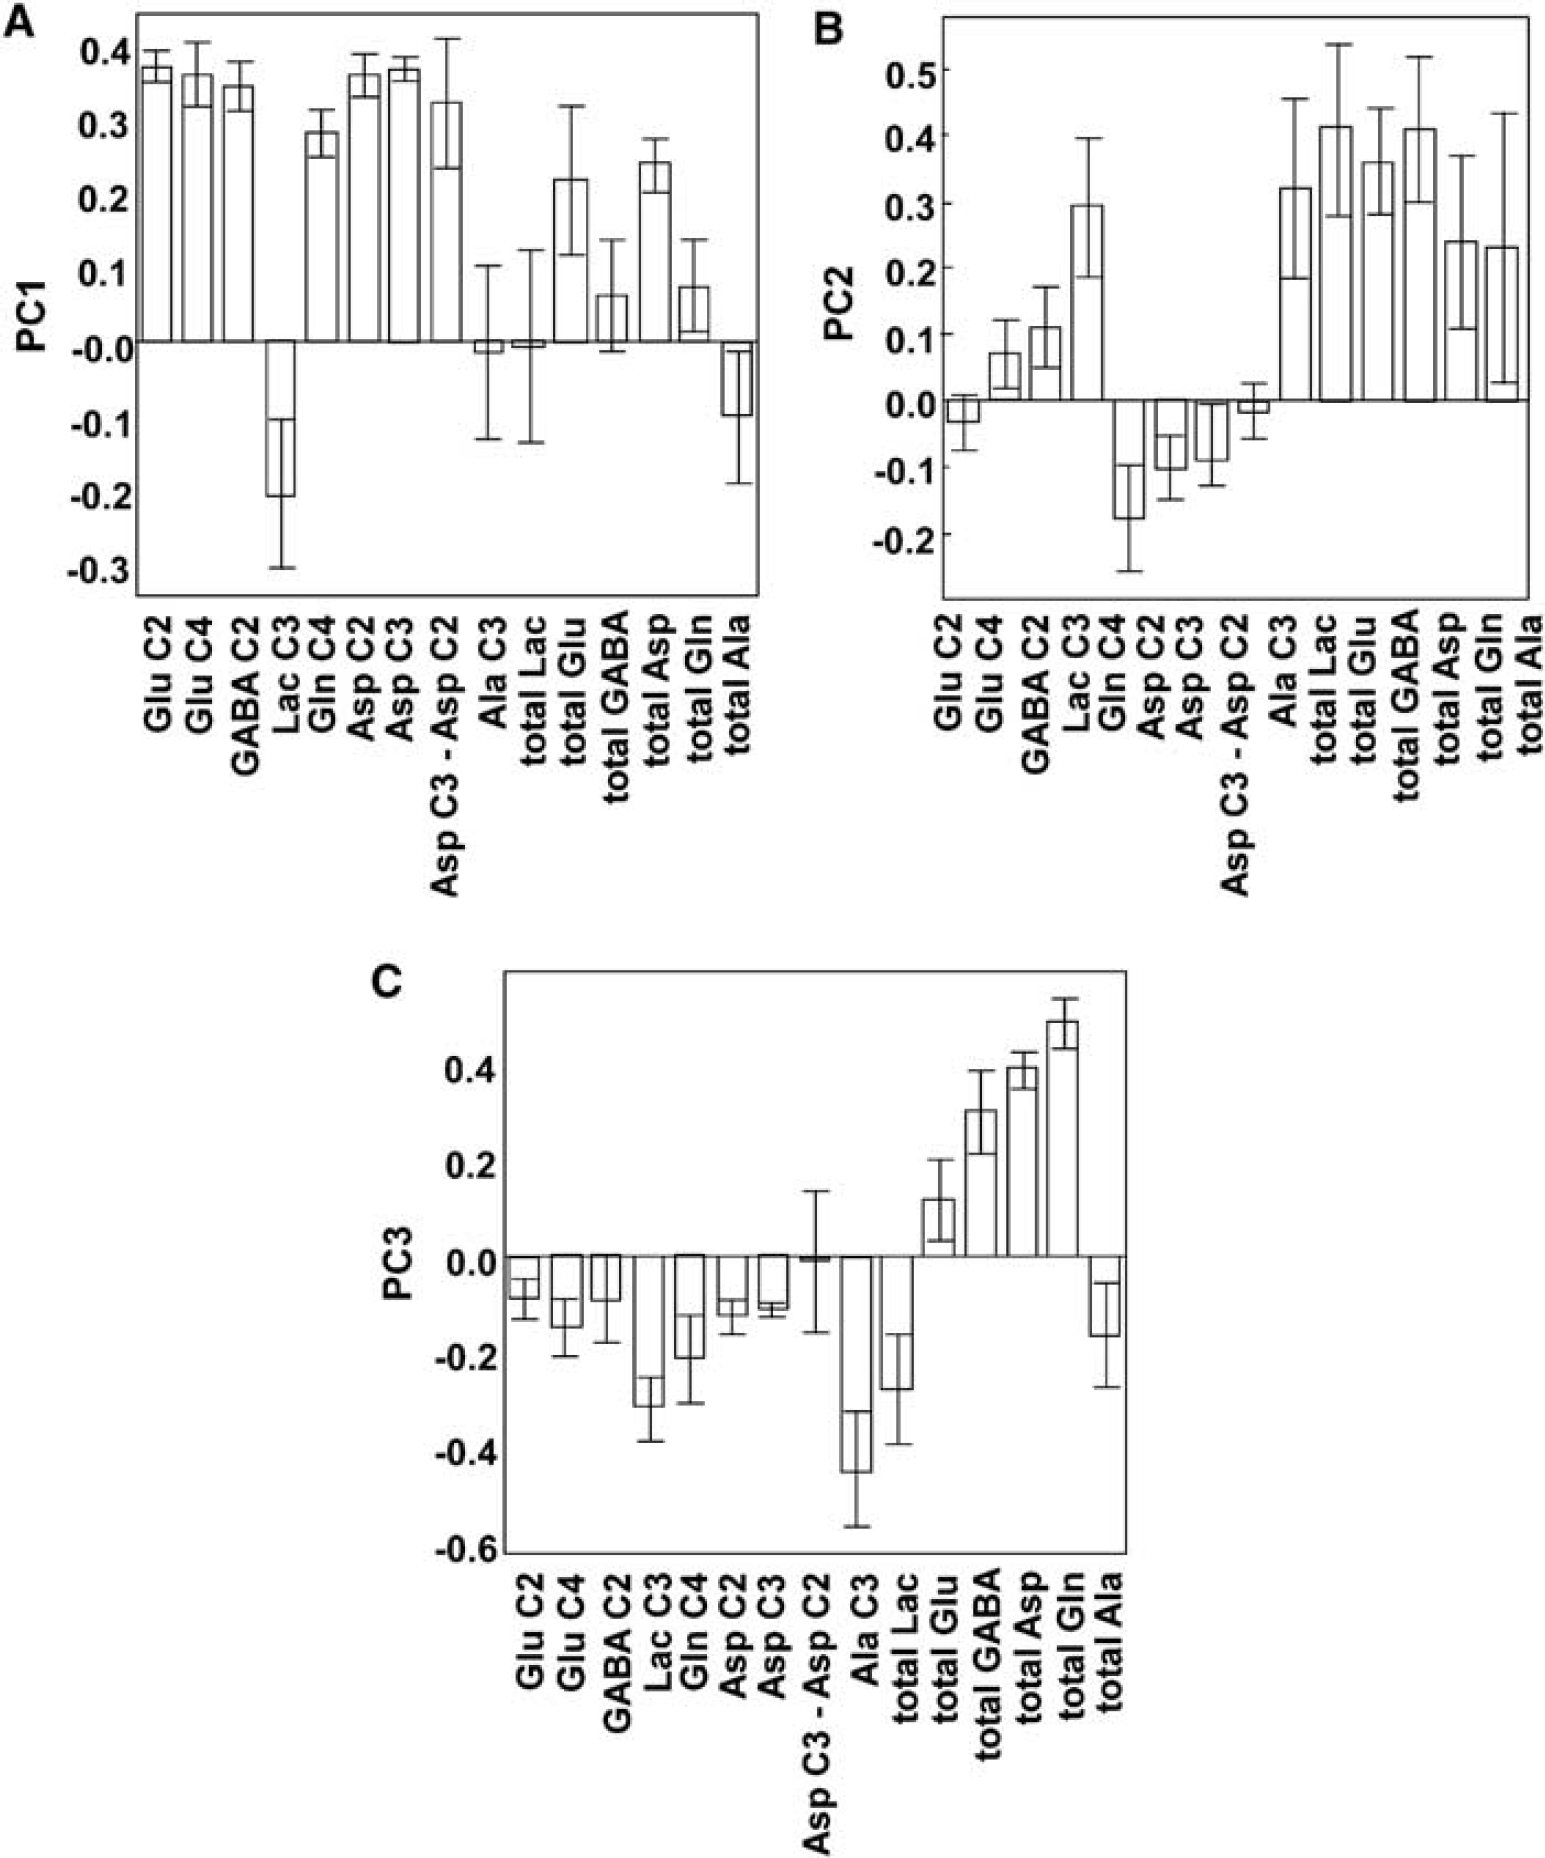
Bar graphs showing contribution of individual variables to each PC of the multivariate statistical analysis. The actual score shown is the coefficient each variable contributes to the model (these would all be the same if the contributions were equal, owing to unit variance scaling of the data). The coefficients are calculated by leaving the variables out of the model and determining how much this effects the model in an iterative manner. The error bars represent standard deviations of the loadings determined by a jack-knife routine.
The data was imported into SIMCA (Umetrics, Umeå, Sweden; www.umetrics.com) where the data reduction tool PCA was used. Data were initially scaled with unit variance scaling, where the variable is centered around the mean and then divided by 1/s σ , where s σ is the standard deviation of that variable. This has the effect of ensuring that every variable contributes to the model equally. The data set was then analyzed by PCA, which reduces the major variance of the data set into a smaller number of latent variables called PCs. This allows the easy visualization of trends in two-dimensional scores plots. To examine which metabolites contribute the most to these trends, the corresponding loadings plots are examined.
Results
GABAB Agonists—(RS)-Baclofen
Incubation of cortical brain slices with 1.0 μmol/L Baclofen resulted in significantly decreased net flux of 13C into Glu C2 and C4, GABA C2, Lactate C3, Asp C2 and C3, and Ala C3 compared with all controls (N = 20; Figure 1). There was a significant decrease in anaplerotic activity measured by comparing labelling at Asp C3 versus Asp C2. Increasing the concentration of Baclofen to 10 μmol/L also decreased net flux into Glu C2 and C4, GABA C2, and Asp C2 and Asp C3 although the decreases were less than that seen using 1.0 μmol/L Baclofen (statistically significantly less only for Glu C4; Figure 1). The metabolite pool size of Lactate, Glu, GABA, and Ala was significantly decreased by 1.0 μmol/L Baclofen, while 10 μmol/L Baclofen had no significant effect on pool sizes (Table 1).
SKF 97541
SKF 97541 (0.2 μmol/L) had no significant effects on net flux (Figure 1) but resulted in a significant increase in the metabolite pool size of Asp and Ala (Table 1). By contrast, 2.0 μmol/L SKF 97541 significantly decreased net flux into Glu C2 and C4, Gln C4, and Asp C2 and C3 (Figure 1) and significantly increased the metabolite pool sizes of GABA, Gln, and Ala.
GABAB Antagonists—CGP 35348
The centrally active antagonist CGP 35348 (50 μmol/L) had no significant effect on net flux (Figure 1) but significantly decreased the pool size of GABA and Asp in the slices (Table 1). A higher concentration of the ligand (200 μmol/L) resulted in significant decreases in net flux into Glu C2 and C4, GABA C2, Asp C2 and C3, and Ala C3 (Figure 1). The pool sizes of lactate, Glu, GABA, Asp, and Gln were also significantly decreased by this concentration of ligand (Table 1).
Phaclofen
The baclofen derivative and classic GABAB antagonist phaclofen at 100 μmol/L resulted in significantly decreased net flux into Glu C2 and C4, Gln C4, and Asp C2 and C3 compared with control (Figure 1), while the anaplerotic activity measured via Asp C3/C2 was also significantly decreased. The metabolite pool sizes of lactate, Glu, and GABA were significantly increased (Table 1). Phaclofen at 300 μmol/L significantly decreased net flux into Glu C2 and C4, Gln C4, and Asp C2 and C3 (Figure 1), while the metabolite pool size of lactate was also significantly decreased, those of glutamine and GABA were increased (Table 1).
SCH 50911
The competitive antagonist SCH 50911 had no significant effect on net flux of 13C at the lower concentration measured (5 μmol/L) but resulted in significant increases in net flux into Glu C2 and C4 and Asp C2 and C3 when the concentration was increased to 50 μmol/L (Figure 1). The total pool size of GABA and Asp were increased by addition of 5 μmol/L SCH 50911, while 50 μmol/L SCH 50911 had no significant impact on metabolite pool sizes.
CGP 52432
The antagonist with higher activity at GABAB autoreceptors CGP 52432, at 0.1 μmol/L, resulted in increased net flux into Glu C4 and GABA C2 (Figure 1). Increasing the concentration to 1.0 μmol/L significantly stimulated net flux into Glu C4, GABA C2, Gln C4, and Asp C2 and C3. The anaplerotic ratio calculated from the difference in Asp C3/C2 labelling was also increased, indicating an increased net flux of label via pyruvate carboxylase activity relative to control. The total metabolite pool of Asp was increased (Table 1), while those of lactate and Ala were significantly decreased (Table 1).
Principal Components Analysis of GABAB Ligand Effects on Metabolic Activity
A three component PCA model was formed with these PCs representing 46%, 24%, and 14% of the total variation in the data set, respectively. Across all three PCs, the data readily clustered according to drug type and dose. The contributions of individual variables to each PC are shown in Figure 3. PC1 (Figure 3A) represents the engagement of Krebs cycle and anaplerotic activity and increased metabolic activity across the total metabolon, and can be argued to show the degree of excitatory activity induced by the added ligand. PC2 (Figure 3B), by contrast, represents net flux into metabolites synonymous with engagement of the GABA-ergic system (GABA C2, Lactate C3, with concurrent decreased net flux into Gln C4), along with positive effects on metabolite pool sizes. PC3 (Figure 3C) is a measure of the degree of engagement of the total metabolon, as determined by the ratio of net flux of 13C into metabolites versus total metabolite pool sizes and can be argued to show the degree to which each ligand engages distinct metabolic compartments.
Discussion
The Effect of Inhibitory Activity on Metabolism
Inhibitory activity might be expected to have two, potentially opposing, metabolic effects. Increased inhibition at a neuron involves hyperpolarising the membrane (i.e., pumping more Na+ and K+ and thereby increasing the activity of the Na+/K+ ATPase, which is a major consumer of the ATP produced consequent to glucose oxidation (Mata et al, 1980) and so would be predicted to involve increased metabolic activity (as evidenced by increased Krebs cycle activity). Increased inhibitory input into excitatory neurons, however, would be expected to result in decreased metabolic activity, decreased glutamate/glutamine cycling, and decreased cycling of lactate and alanine. Alanine cycling occurs downstream of glutamine cycling (Rae et al, 2003, 2005a; Waagepetersen et al, 2000; Zwingmann et al, 2000, 2001) and is in rapid equilibrium with lactate labelling in tissue slices (Rae et al, 2003). Decreased inhibitory activity, however, would also be predicted to result in two different potential outcomes; decreased inhibitory activity of inhibitory neurons would result in decreased metabolic activity for these neurons as they could attain a resting, rather than hyper-polarised, membrane potential, while decreased inhibitory input into excitatory neurons would be expected to produce similar metabolic outcomes to that expected for mildly increased excitatory activity. That is, greater numbers of spontaneous excitatory potentials, increased Krebs cycle flux, increased glutamate/glutamine cycling, and increased cycling of lactate and alanine. Therefore, the net outcome of addition of agonists or antagonists to our system ought strictly to be viewed as a net sum of these effects, as it is in a brain imaging experiment conducted in vivo. With this in mind, interpretation of the apparently conflicting outcomes consequent on modulation of the GABAB receptor becomes more straightforward (Figure 4).
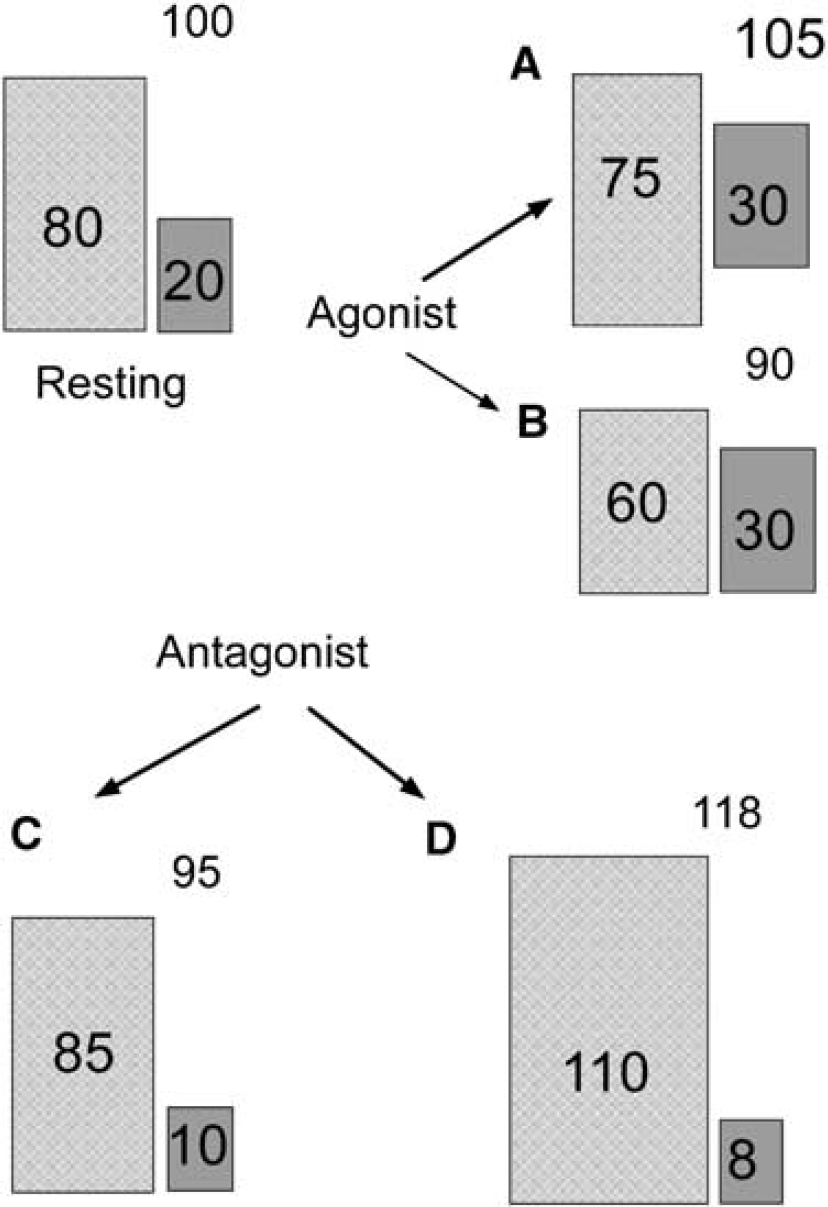
Scheme showing additive contribution of excitatory and inhibitory compartments to net metabolism. Under resting conditions, a theoretical contribution to total net metabolism is made by excitatory (hatched, 80%) and inhibitory (gray, 20% activity. Addition of GABAB ligands can produce a spectrum of responses of which four possible outcomes are illustrated here. (
Agonists at GABAB, such as Baclofen or the higher concentration (2.0 μmol/L) of SKF 97541, showed results consistent with decreased net flux into the Krebs cycle (decreased net flux into Glu C2 and C4, and Asp C2 and C3), a neutral effect on net flux into Gln C4 and decreased net flux into Ala C3 and Lac C3, consistent with decreased alanine/lactate cycling. These metabolic effects are consistent with increased inhibitory and decreased excitatory activity, consistent with the scenario shown in Figure 4B. Although the lower concentration of SKF 97541 did not show any individual net flux changes that were significantly different to the total control fluxes, the across the board higher values for net flux into Krebs cycle intermediates (Glu C2, C4 and Asp C2 and C3) suggested that Krebs cycle activity was higher in this case (if there was no change, on probabilities one might reasonably expect there to be an equal number of higher and lower values compared with control values). Indeed, if the control data were limited only to those obtained concurrently with the SKF data, and not widened to include the full control range, there were significant increases in net flux into Glu C4 and Asp C2 and C3, with significantly greater net flux into GABA C2, indicative of increased Krebs cycle activity and increased labelling of the GABA pool (GABA C2) with no change in net flux into Glu C4. It could therefore be argued that the lower concentration of SKF 97541 is stimulating inhibitory (hyperpolarisation) activity without greatly effecting excitatory activity, as is illustrated in Figure 4A. This is also supported by the clustering of the data from the lower concentration of SKF 97541 to the right along PC1 (Figure 2A) in the company of the potent antagonist CGP 52432.
The weak antagonist CGP 35348 shows net metabolic effects similar to that of Baclofen (Figure 1), illustrated by this drug clustering in the same Hotellings quadrant as a similar concentration of Baclofen along all PCs (Figure 2). The main separating factor of CGP 35348 from Baclofen is in the pool sizes, which are lower in the case of CGP 35348. The weak antagonist Phaclofen also separates in the same quadrant as Baclofen and CGP 35348, showing similar patterns of net flux, but the pool sizes in this case are increased. The net metabolic activity best matched by this is illustrated in Figure 4, scenario C.
The potent antagonists SCH 50911 and CGP 52432 show quite different patterns of net flux to the other ligands employed in this study. The profiles show increased Krebs cycle activity (illustrated by increased net flux into Glu C2, C4, Asp C2 and C3), significantly increased anaplerotic activity (measured by the difference in Asp C3 versus C2 labelling), and increased net flux into Gln C4, consistent with increased glutamate/glutamine cycling (and increased glutamatergic activity). This suggests an outcome consistent with that illustrated in Figure 4, scenario D.
It is apparent from the present results that it cannot be automatically inferred that increased inhibitory activity causes a decrease in total metabolic activity, or that decreased inhibitory activity is necessarily stimulatory. More specifically, if the neuronal activity is understood in terms of changes in membrane permeabilities (resulting in ionic currents using transmembrane potentials that require energy to be maintained), it should be clear that both depolarization (excitation) or hyperpolarization (inhibition) can put extra demand on energy metabolism. In addition, other factors such as the role of signalling mechanisms triggered by changed ionic concentrations inside the cells need to be considered (Lauritzen, 2005) in all interpretation of functional imaging data regardless of whether pathways involved are predominantly excitatory or inhibitory.
GABA Pool Sizes
Pool sizes in brain cortical slices are subject to fluctuations depending on the metabolic activity in the brain slice and on the rate of loss of substrate to the medium. The rate of loss of substrate to the medium is surprising low; however, in the absence of transporter inhibitors and exchange between compartments tends to be tight, with competition from exogenously added substrates difficult to show (Lozovaya et al, 2004; Rae et al, 2003). It is therefore valid to conclude that fluctuations in brain tissue slice pool sizes are strongly correlated with metabolic rate, and therefore indicative of the level of metabolic pool size that might be expected under similar circumstances in vivo. γ-Aminobutyric acid levels are now frequently measured in clinical investigations using magnetic resonance spectroscopy under both normal functional conditions, for example (Floyer-Lea et al, 2005), and in disease states (Chang et al, 2003), and inferences have been drawn from these levels about the function of the GABAergic system. Inspection of GABA pool sizes in Table 1, however, shows that levels of GABA per se are not necessarily indicative of functional activity. γ-Aminobutyric acid pool sizes correlated well with the net flux of 13C label into GABA C2 under conditions where GABAergic ligands were added to the slices (Spearman's correlation coefficient ρs = 0.52, N = 48, P = 0.0001), but not with net flux into Glu C4 (ρs = 0.22). From this one might conclude that GABA levels correlate well with the amount of engagement of the GABAergic compartment, but not with glutamatergic activity. However, there is a negative, significant correlation between GABA pool sizes and the rate of net flux of label into Glu C2. Glu C2, which occurs on the second turn of the Krebs cycle, might be considered a better indicator of Krebs cycle activity than Glu C4, which is also influenced strongly by glutamate/glutamine cycle rates. Glu C2 correlates negatively with GABA pool sizes (ρs = −0.30, N = 48, P = 0.04) suggesting that increased GABA levels do indeed relate to decreased Krebs cycle activity, although the correlation is weak. Examination of the contribution of the total GABA pool size to each PC (Figure 3) in this case is useful, as it shows that engagement (increase) in the pool size is more strongly related to PC2 and PC3 (i.e., the degree of engagement of the GABAergic compartment and the amount to which this then engages the total metabolon) than it is to PC1 (i.e., excitatory activity).
In summary, we have shown that total metabolic activity subsequent to modulation at GABAB receptors represents a summation of excitatory and inhibitory effects, contributed to by a number of different metabolic compartments, and that these compartments may or may not be engaged by GABAB modulation, depending on the potency and nature of the ligand employed.
Footnotes
Acknowledgements
The authors are grateful to Dr Graham Ball, Dr James Hook, and Ms Hilde Stender of UNSW School of Chemistry for expert technical assistance.