
Abstract
Analysis of photon transit time for low-power light passing into the head, and through both skull and brain, of human subjects allowed for tomographic imaging of cerebral hemoglobin oxygenation based on photon diffusion theory. In healthy adults, imaging of changes in hemoglobin saturation during hand movement revealed focal, contralateral increases in motor cortex oxygenation with spatial agreement to activation maps determined by functional magnetic resonance imaging; in ill neonates, imaging of hemoglobin saturation revealed focal regions of low oxygenation after acute stroke, with spatial overlap to injury location determined by computed tomography scan. Because such slow optical changes occur over seconds and co-localize with magnetic resonance imaging vascular signals whereas fast activation-related optical changes occur over milliseconds and co-localize with EEG electrical signals, optical methods offer a single modality for exploring the spatio-temporal relationship between electrical and vascular responses in the brain in vivo, as well as for mapping cortical activation and oxygenation at the bedside in real-time for clinical monitoring.
The regional cerebral blood volume, regional CBF, and regional hemoglobin oxygen saturation (rS
Efforts to obtain a temporal and spatial understanding of regional oxygenation changes have been hampered by the difficulty of measuring such values both quantitatively and noninvasively in vivo. Surface optical mapping of exposed brain provides both quantitation and spatial resolution (Malonek and Grinvald, 1996) but is invasive and not suited to general clinical investigation; functional magnetic resonance imaging (fMRI) can map deoxyhemoglobin concentration, blood volume, and blood flow (Kwong et al., 1992; Ogawa et al., 1992; Bandettini et al., 1992; Frahm et al., 1992; Blamire et al., 1992) but does not quantify hemoglobin saturation and may be insensitive to changes at the capillary level. Positron emission tomography can map tissue metabolism and blood flow but has limited spatial resolution (Belliveau et al., 1991), poor temporal resolution, and requires use of an emitter, which renders the approach unsuitable for continuous monitoring or for routine use in infants.
In contrast, red and near-infrared light pass through the body in small amounts, losing one decade of intensity for each centimeter traveled. Hemoglobin is a strong absorber at these wavelengths and accounts for over half of the typical optical absorbance by the adult brain, thus providing contrast that is a function of both local tissue blood content and oxygenation. At 800 nm, the absorbance of adult brain (μa) is 0.01 to 0.02/mm, expressed as absorbance events per millimeter of photon travel, and is related to classic absorbance by A = μaL, where L is the mean total path length traveled by photons diffusing through the tissue. Given an average cortical hemoglobin concentration of 84 μmol/L, hemoglobin accounts for just over half of the absorbance of adult brain. Typical effective (or reduced) scattering at this wavelength (μs') is 2.5/mm for gray matter and 9.0/mm for white matter, or at least 100-fold higher than absorbance. Thus, in the brain at this wavelength, optical transport is scattering dominated. Effective scattering values for neonatal brain are lower at 0.5/mm for gray matter and 1.0/mm for white matter. The source of the scattering is not clear, although mitochondria and cell membranes may be major sources, providing contrast that varies as a function of cell shape and size, local electrical activity, ion gradients, and water movement. Temporal variations in absorbance occur with changes in tissue oxygenation, whereas temporal variations in scattering occur during neural activation, temperature transitions, cell injury, and water shifts (Malonek and Grinvald, 1996; Grinvald et al., 1986; Cohen, 1973; Frostig et al., 1990). However, measuring these effects in tissue using classic spectroscopy fails because of the confounding influences of light scattering and absorption on measured light intensity (Patterson et al., 1989; Bonner et al., 1987; Jacques, 1989). Similarly, direct or computed optical imaging fails under the conventional assumption of linear transport (e.g., computed tomography [CT], single-photon emission CT, positron emission tomography) or single scattering (e.g., ultrasound, optical coherence tomography, geotomography) (Huang et al., 1991).
Photon diffusion spectroscopy and imaging treat photon migration through tissue analogously to other physical processes involving general particle transport and allow for a separation of absorption and scattering effects (Patterson et al., 1989; Benaron and Stevenson, 1993). These diffusion-based approaches may be divided into three basic groups: time-resolved spectroscopy, in which a time of transit is measured through the tissue for each photon; frequency-resolved spectroscopy, in which an amplitude-modulated signal is measured for phase, intensity, and depth of modulation after passage; and spatially resolved spectroscopy, in which the decay in intensity of a signal with distance from the source is measured. Combinations of different methods are possible, such as in the combination of phase measures and conventional measures of intensity. Time domain and frequency domain data are interchangeable, related by the Fourier transform. Such methods yield absolute chromophore concentration in homogeneous samples, even under highly scattering conditions. Detail and deep imaging capability is known to be less with current optical methods than with ultrasound, CT, or magnetic resonance imaging (MRI), yet optics provides the advantage of real-time, bedside functional information such as changes in oxygenation not measured, or not obtainable as quickly, using the standard imaging techniques. Clinical application of optical methods has allowed quantitation of tissue oxygenation in brain, muscle, and tumors (Fishkin et al., 1997; De Blasi et al., 1995; Chance et al., 1988 and 1993; Ferrari et al., 1992), as well as imaging of intracranial hemorrhage in neonates (Hintz et al., 1999; van Houten et al., 1996).
Here we present evidence that application to quantitative spatial and temporal monitoring of hemoglobin volume changes and oxygen saturation in vivo is feasible and suggest such an approach yields a unique modality allowing simultaneous and noninvasive tomographic co-localization of electrical and vascular activity in the brain.
METHODS
Instrumentation
Time-of-flight device. Optical functional imaging of adults during mixed sensory motor exercises, and neonates with and without suspected hypoxic injury was performed using a noninvasive, portable time-of-flight and absorbance (TOFA) system. This system has been previously described (Benaron et al., 1994a, b , 1995; Hintz et al., 1996) and uses two diode lasers that emit low-intensity light (100 μW average, 60 picoseconds at full-width, half-maximum [FWHM]) at 785- and 850-nm wavelengths. Although the original system used mechanical scanning with a computer-controlled positioning stage, similar to a CT scanner, this was modified for clinical use (Hintz et al., 1998). A commercially available switching network (DiCon FiberOptic Systems, Berkeley, CA, U.S.A.) allowed for bedside scanning without moving parts. The emitter and detector switcher pathway length and the length of the emitter and detector fibers were calibrated for actual photon time delay in picoseconds. Optical scanning was performed using a soft, flexible fiberoptic headband consisting of 34 optode pairs, each consisting of a custom-made pair of 100-μm fibers (Purdy Electronics, InterOptics, Burlingame, CA, U.S.A.) terminating in a miniature right-angle reflecting prism. Each headband fiber was calibrated for actual photon time delay. Scanning was accomplished using a scan pattern with emission of brief low-power pulses of laser light at each fiber location, followed by sequential detection at the remaining fiber locations. Maximum source-detector separation was found to be about 5 cm, at which point a photon count of 150 to 200 at the peak of the signal was noted. Time-of-flight and absorbance curves were collected at each step until a comprehensive circumferential scan of the subject's head was completed. Neonatal scans required 2 to 6 hours to complete, depending on head size and number of wavelengths used. Adult scans, which required a high degree of detail for optimal comparison to fMRI, were performed in four sessions of 6 hours each. For each TOFA curve collected, a variety of factors were determined, including scattering coefficient, absorption coefficient, average ratio of optical path length to physical emitter-detector separation (differential path length), and rate of change of these variables over space. An image then could be reconstructed mathematically by an approach involving a curvilinear backprojection method using custom software (Benaron et al., 1994a) accessing either absorption or scattering data.
Diffuse optical tomography system. Optical functional imaging of adults during finger tapping exercise was performed using a portable continuous-wave diffuse optical tomography system (DOTS). This device has been previously reported (Siegel et al., 1999) and has shown good spatial agreement over a wide range of scattering and absorption conditions, and during functional imaging of paralyzed adult rats. The DOTS uses the technique of phase-sensitive detection, with laser diodes at 780-nm modulated at 2 kHz to enable lock-in detection to reject room light contribution and reduce 1/f electronic noise. Laser diodes can be time-shared with the sequence controlled by a computer with custom software, and the detectors are standard photodiodes, each with its own signal acquisition circuitry (Burr-Brown, Tucson, AZ, and Sager, San Jose, CA, U.S.A.). The system uses a fiber-coupled array of 9 laser diodes and 16 silicon photodetectors to deliver light to and collect diffuse light from the scalp. Arranging the 1-mm acrylic fibers in a 9 × 6 cm grid embedded in custom-made RTV caps enables one hemisphere of the adult motor cortex to be imaged. All data are collected in 2-second intervals, enabling near-real-time imaging. Images were reconstructed using synchronous iterative reconstructive technique with the Born approximation. Unlike the TOFA system, DOTS is nonquantitative but also is much lower in cost, near-real-time, and simple to operate.
Functional activation scenarios
TOFA functional imaging of motor activation. Physiologic changes in brain oxygenation were studied in two healthy, bald male adults during mixed motor and sensory cortex activation. Baldness facilitated optical coupling and reduced scan time but is not a requirement for optical imaging using TOFA technology. Because baseline brain oxygenation in nonactivated areas is stable over time, a resting state (baseline) can be subtracted from an activated state (motor task) to unmask a residual signal, which is a function of local activation (Fox et al., 1984, 1986, 1987). Optical imaging was performed, with or without fMRI (Frahm et al., 1994; Kleinschmidt et al., 1995), during a sequential thumb-to-finger apposition task known to result in localized increases in brain blood volume and oxygenation. In the first subject, stimulation during optical monitoring consisted of periods of finger tapping at 3 Hz; in the second subject, sequential thumb-finger apposition was used. Each stimulation sequence consisted of the following sequence: 48 seconds of rest (final 30 seconds to collect baseline data), 72 seconds left-handed sequential finger opposition (final 60 seconds to collect data), 48 seconds of rest (final 30 seconds to collect data), and 72 seconds of right-handed sequential finger opposition (final 60 seconds to collect data). This sequence thus produced 60 measured seconds of rest, right-stimulation and left-stimulation every 4 minutes. The additional unmeasured minute represented stabilization time between states. In this experiment, stimulation (or lack of stimulation) always preceded start of measurement by 12 seconds. The sequence was repeated multiple times, with scanning ongoing during each period. Two wavelengths were measured and sequentially collected, 785 nm first, followed by 850 nm. Optical scanning was performed with the fiberoptic headband positioned to obtain a coronal image. Increases in oxygenation during cortical activation greater than 2 SD from the mean oxygenation baseline were calculated from the optical data (Sevick et al., 1991), tomographically reconstructed, and compared with a fMRI activation map from the same subject, if obtained, using a 3-SD threshold and a scan similar orientation. Optical images and fMRI activation maps were reviewed and assessed by individuals who were masked to results of the other imaging modality.
DOTS functional imaging of motor activation. Physiologic changes in brain oxygenation and blood volume also were studied during finger tapping exercises in three healthy male adult subjects using the continuous-wave DOTS. Subjects tapped the forefinger of the hand contralateral to placement of the functional imaging probe. Baseline (rest) images were obtained for 20 seconds, followed by a 15-second period of finger tapping at 1 Hz, followed by a 15-second rest period, followed by another 15-second period of finger tapping. The images were obtained at a wavelength of 780 nm. The images were reconstructed in near-real-time in a plane parallel to the plane of sources and detectors and approximately equal to the size of the imaging probe grid (Siegel et al., 1999).
TOFA optical imaging of neonatal hypoxic injury. Pathologic changes in brain oxygenation were studied in infants with and without suspected hypoxic brain injury using TOFA optical imaging, with and without CT. One infant with suspected focal hypoxic—ischemic injury presented shortly after birth with seizure activity. Head CT and TOFA optical scanning were performed sequentially, with the individual performing the optical scan masked to the CT results. Optical scanning was performed with the fiberoptic headband positioned circumferentially to obtain axial images similar to the comparison CT images. Optical hemoglobin saturation was calculated (Sevick et al., 1991) and tomographically reconstructed (Benaron et al., 1994b; Hintz et al., 1999), and injury localization was compared with CT. An age-matched control infant, undergoing treatment for mild respiratory distress and with no signs of cerebral hypoxia, also was optically scanned.
Subjects
Human studies were subject to institutional review and approval. Patients were enrolled only after informed consent was obtained from them, or in the case of infants, from parents. Institutional and National Institutes of Health Standards for use of Human Subjects were observed at all times. There were no complications from optical probe placement in any subject.
RESULTS
TOFA functional imaging of motor activation
Data from two subjects are presented. For a first subject, global cortical hemoglobin saturation is unchanged by focal motor activity, whereas regionally there are contralateral increases during such activity (Fig. 1). These regional increases in saturation are located in the left hemisphere during right-handed activity and in the right hemisphere during left-handed activity. For a second subject, optical imaging and fMRI were sequentially performed, an optical image tomographically was generated, and local increases in hemoglobin saturation above 2 SD from the mean were highlighted and overlaid on a T1-weighted fMRI image using a 3-SD threshold (Fig. 2). There is good spatial agreement between the optical and fMRI images with respect to activation site, whereas optical scanning alone yields quantitative measurement of cortical hemoglobin saturation.
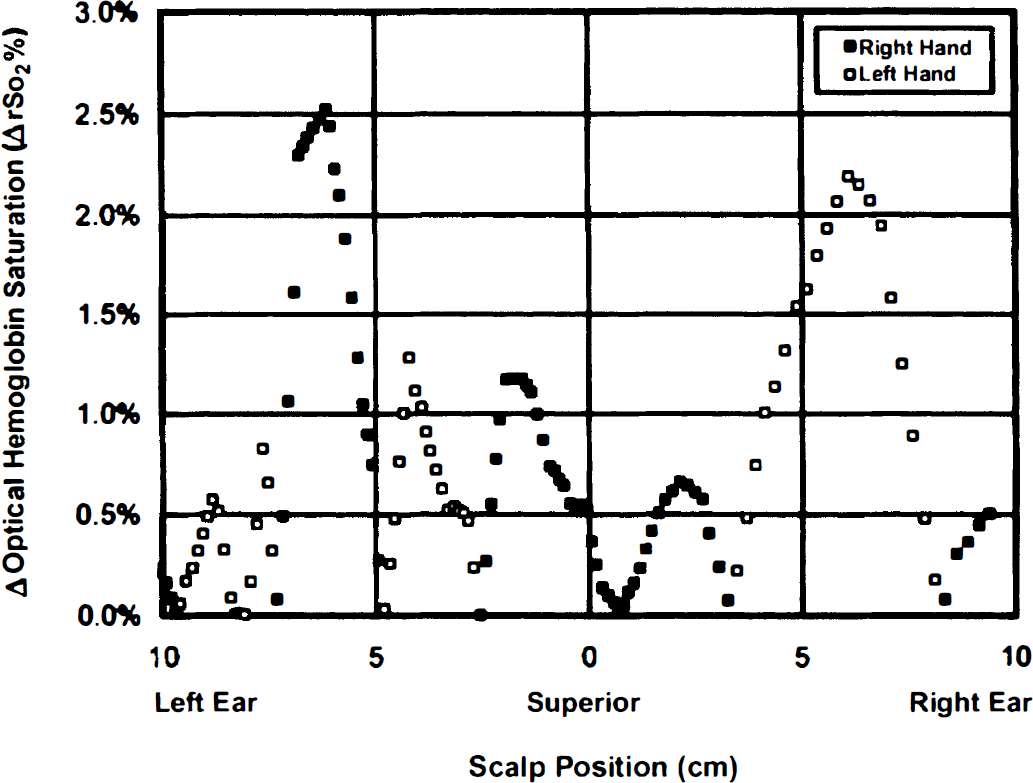
Saturation change measurements over the motor cortex of an adult during motor activation. Data points represent a coronal series of measurements, from left ear to right ear across the superior point of the head (vertex), measured with an optical imaging headband at a fixed emitter—detector separation of 2 cm. Saturation change is calculated as a paired difference, ipsilateral activity minus contralateral activity saturation, at each site. Global cortical hemoglobin saturation is stable during motor activity (change = 0.3 ± 0.5%, n = 47 measures, P = not significant [NS]), but there are localized, lateralized regions with an increase in hemoglobin saturation during such activity. These increases in saturation are located to the left of the vertex when the motor activity is right-handed (▪, peak increase = 2.6%, center = 6.1 cm left of vertex, full-width, half-maximum [FWHM] = 2.1 cm, mean increase = 2.0 ± 0.5%, n = 9, P < 0.001), and to the right of the vertex when the stimulation is left-handed (□, peak increase = 2.2%, center = 7.6 cm right of vertex, FWHM = 4.3 cm, mean increase = 1.7 ± 0.4%, n = 6, P < 0.001). The measured FWHM may be larger than actual size because of the wide emitter—detector spacing.
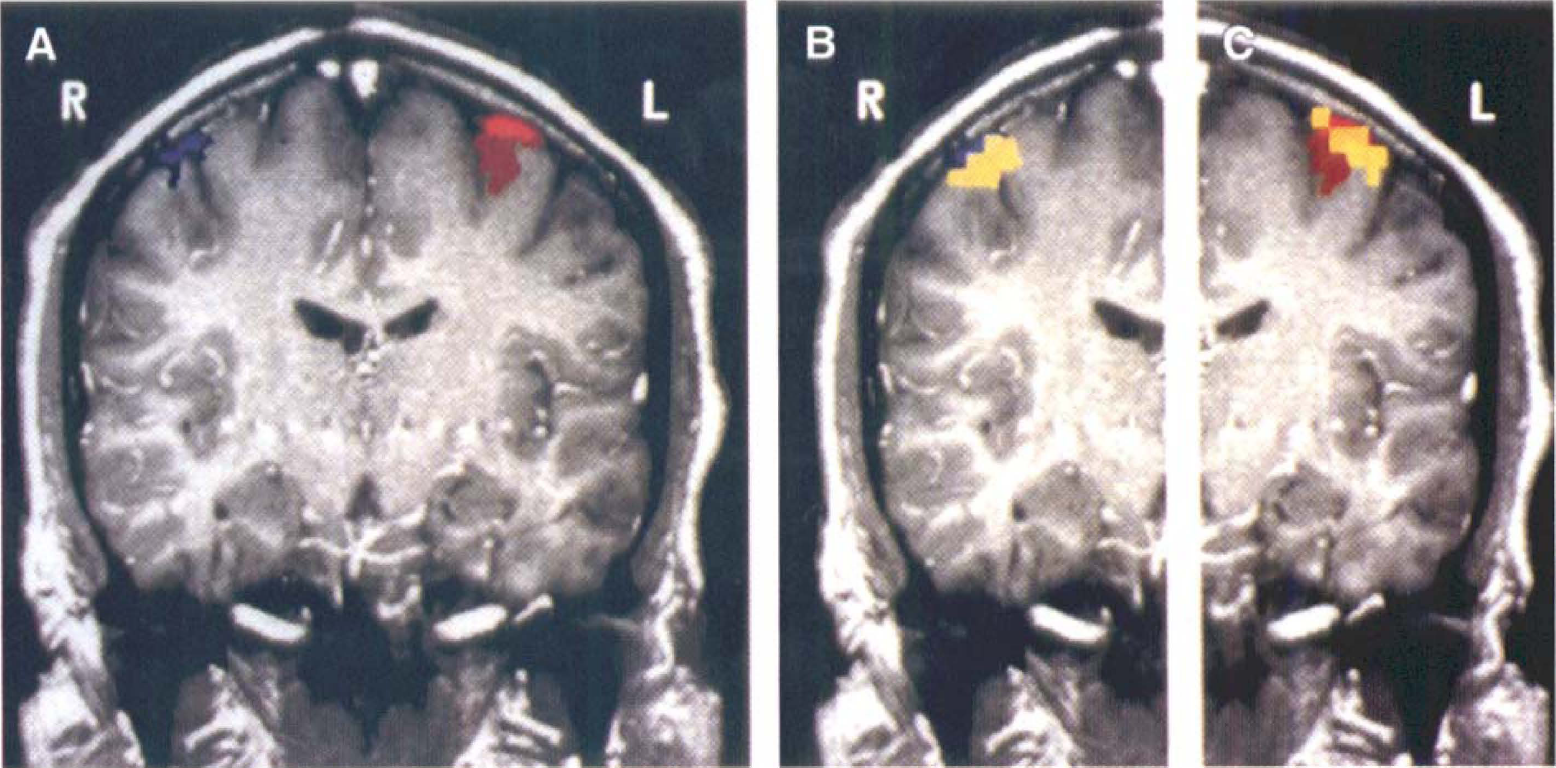
Comparison of optical and functional magnetic resonance images of motor cortex activation. An image tomographically reconstructed from an optical scan (n = 1, 297 measures) shows focal areas of hemoglobin saturation rising more than 2 SD above the mean (yellow), which correspond to motor activation maps generated in the same subject using functional magnetic resonance imaging (fMRI) alone (left-hand activity, blue; right-hand activity, red; T1-weighted image, gray). The fMRI images alone (
DOTS functional imaging of motor activation
Data from a representative adult subject are presented. Activation-induced absorption increase, as seen by a change from blue-green to red, can be imaged in realtime using the nonquantitative DOTS system (Fig. 3). This increased absorption at 780 nm is consistent with an increase in regional hemoglobin volume; however, because data were collected at only a single wavelength, specific changes in hemoglobin oxygen saturation could not be ascertained. Because of the positioning of the probe over the contralateral frontoparietal region and time sequence of motor activation, this increase in absorption corresponds spatially and temporally with sensorimotor stimulation. As seen in the Fig. 3, the distinct area of activation during the finger tapping exercise is extinguished during rest and reactivated during a second period of tapping.
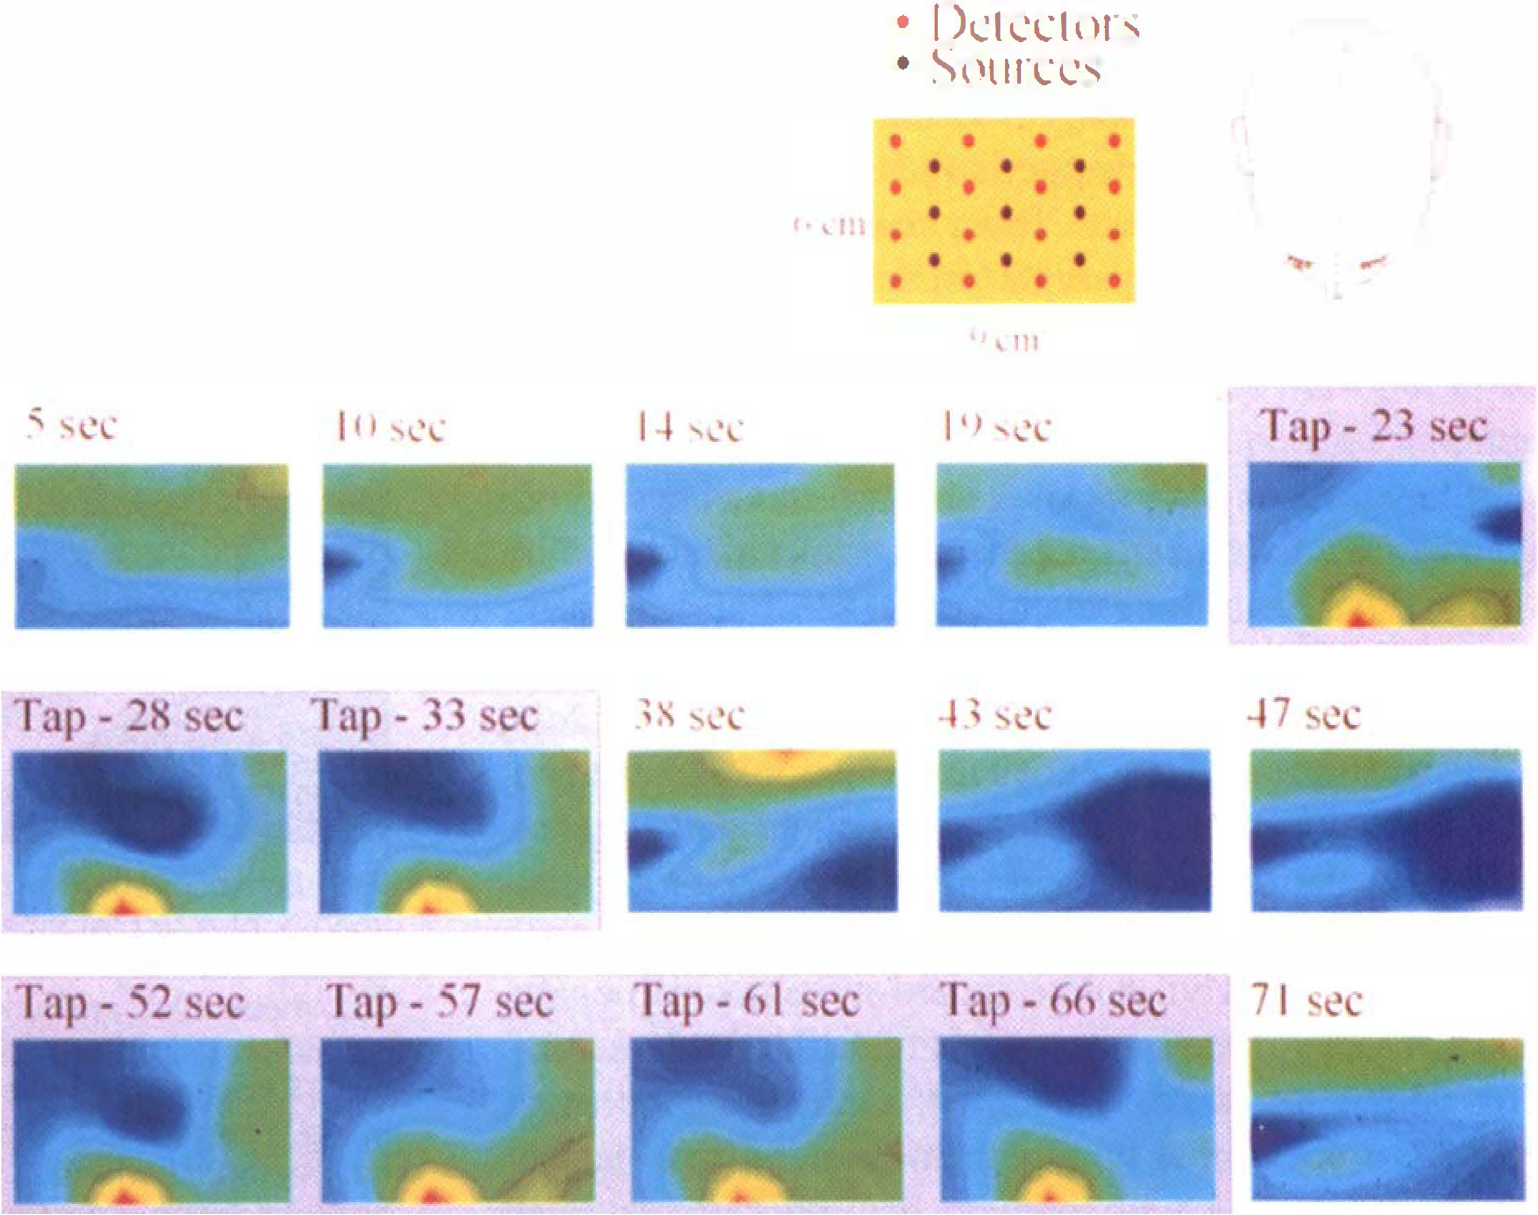
Nonquantitative, near-realtime diffuse optical tomography system images of motor cortex activation. The images were reconstructed in a 9 × 6 cm plane overlying the left frontoparietal region of the brain. The top (left) of each image is nearer the occipital lobe. During right forefinger tapping (20 to 35 seconds), a region of motor cortex can be seen to change in optical absorbance, and this rapidly resolves with cessation of tapping (35 to 50 seconds). The activity seen in this region is reproduced in a second episode of tapping (50 to 65 seconds). The images obtained at 780 nm indicate an activation-induced absorption increase of a factor of 3 over the background fluctuation.
TOFA optical imaging of neonatal hypoxic injury
Data from two infants, one with and one without hypoxic—ischemic injury, are presented. There is a focal region of low hemoglobin saturation for the infant with injury not seen in the control subject (Fig. 4). For the infant with hypoxic—ischemic injury, CT and optical imaging were sequentially performed, and an optical image was tomographically generated; local decreases in oxygenation 2 SD or more from the mean saturation value are highlighted and overlaid on the CT image. There is overlap between the optical and CT localization of injury site (Fig. 5), whereas optical scanning alone yields quantitative measurement of regional cortical saturation. The optical scan, unlike the CT scan, was obtained at the bedside during a period of critical illness.
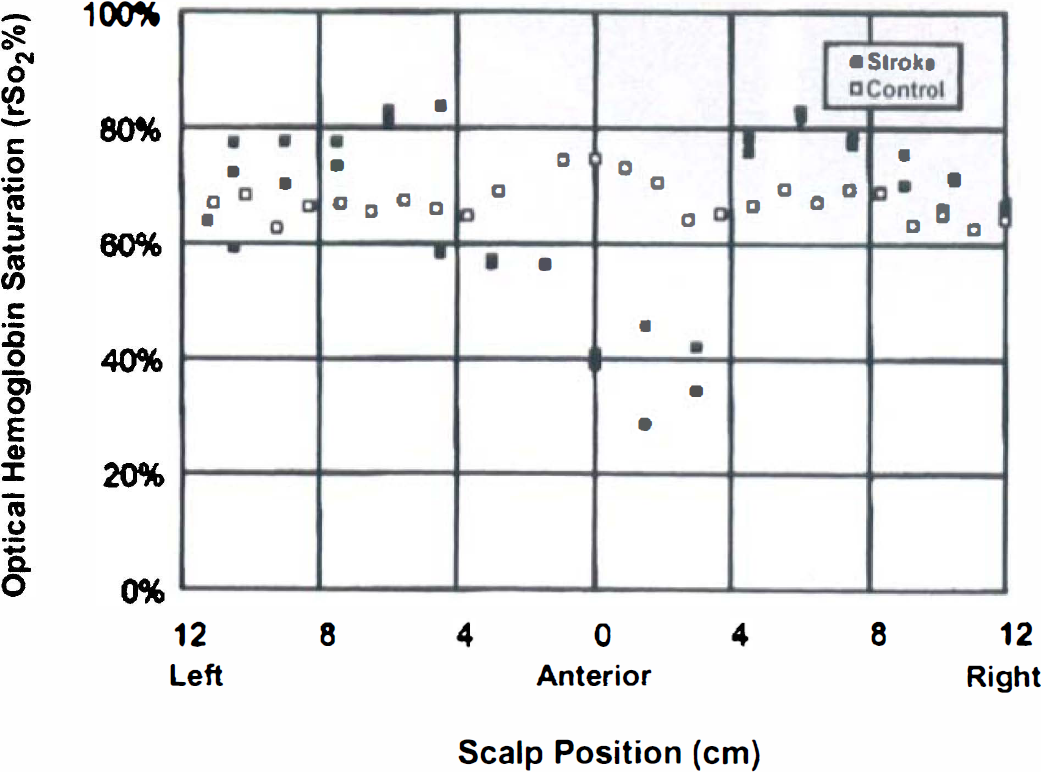
Absolute saturation measurements around the head of an infant with suspected stroke (▪) and around the head of a control infant (□). The points represent a circumferential series of measurements around the infant's head, taken with an imaging optical headband at a fixed emitter-detector separation of 2 cm. Global cortical hemoglobin saturation is similar between control infant (67.3 ± 3.2%, n = 26 measures) and stroke infant (69.9 ± 5.2% away from region of stroke, n = 16, P = NS), but there is a focal region of low oxygenation in the stroke infant not seen in the control infant (47.0% ± 10.6%, n = 11, P < 0.001).
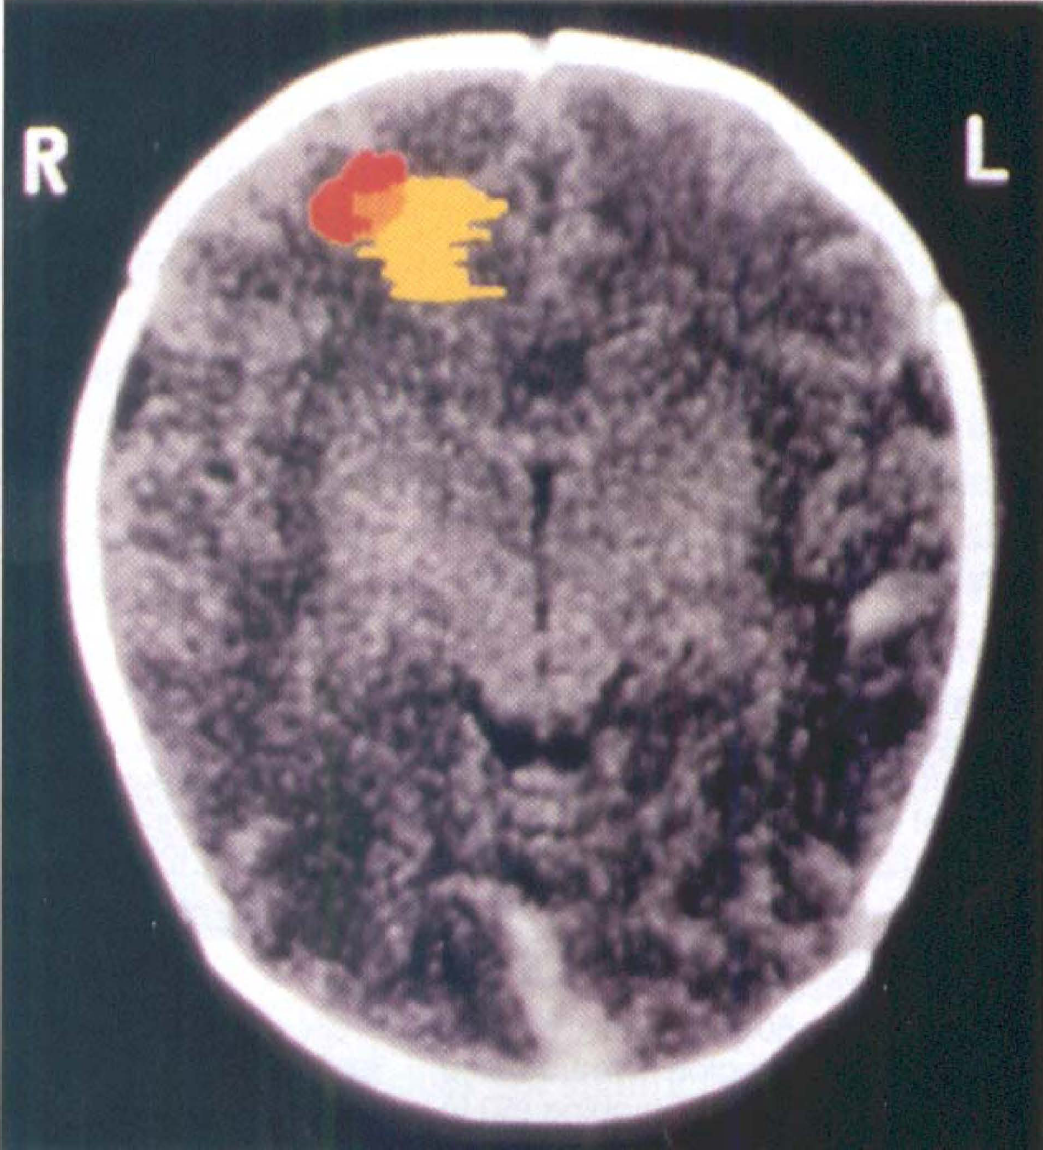
An overlay of optical and computed tomography (CT) images of a frontal lobe stroke. The optical image of the stroke (yellow) was reconstructed from a tomographic optical scan (n = 652 measures) and shows a focal area of mean hemoglobin saturation falling more than 2 SD below the nonstroke average; the CT image (gray) of the stroke (red) was collected in the same plane. There is spatial overlap in injury localization between the two methods, whereas the optical image was collected at the bedside during a period of critical illness.
DISCUSSION
With optical imaging methods using the technology of near-infrared spectroscopy, changes in cerebral hemoglobin saturation in response to motor activation or hypoxic—ischemic injury can be imaged at bedside noninvasively and quantitatively. In addition, early results indicate that functional activation can be optically imaged at bedside in near-real-time using a simple, low-cost, and nonquantitative device.
We observed a smaller change in hemoglobin saturation using the TOFA system during cortical activation than has been seen by previous invasive and noninvasive studies (Belliveau et al., 1991; De Blasi et al., 1995; Fox et al., 1984, 1986, 1987), perhaps because of our averaging over an extended period and measurement over larger surface areas, both of which could blunt maximal recorded changes. Expected optical changes were calculated assuming that CBF increases 30% to 50% during motor activation (Fox et al., 1987), and if venous saturation is 70% and arterial saturation is 95% at the onset of activity, venous fractional weighting r is 0.75, and oxygen consumption does not significantly change, then venous saturation should rise to 6% to 8% and regional optical saturation should increase 4% to 6% during activation. This is higher than the 2% to 3% values measured here, although increases in oxygen consumption with activity would lessen any observed rise. The focal signal supports a cortical rather than extracranial origin (Arridge and Schweiger, 1995, 1995; Okada et al., 1996), whereas the large area undergoing saturation increases is consistent with evidence that late-phase blood flow and volume changes are regulated on a coarse scale (Malonek and Grinvald, 1996). Such physiologic cortical changes have been measured previously using conventional continuous wave (CW) illumination sources, but absolute quantitation was not possible (Villringer et al., 1993; Hoshi and Tamura, 1993; Kato et al., 1993; Maki et al., 1995), and tomographic imaging is more difficult without the selective deeper brain sampling afforded by diffusion-based approaches.
With respect to measurement accuracy, there is no gold standard to which the in vivo optical hemoglobin saturation can be compared. In studies using inanimate model systems, we found the absorbance at each wavelength to have a measurement bias of 2% to 4% at 3-cm depth. It is reassuring that the measured baseline cerebral oxygenation in normal adult, control infant, and nonstroke regions of the infant with stroke by the TOFA system are consistent with physiologic expectations, whereas deviations from normal during pathologic changes, such as stroke or other models of ischemia, also follow expected trends in both magnitude and direction (De Blasi et al., 1995; Fishkin et al., 1995). Notice that measured changes in saturation from a local baseline, such as changes in oxygenation during cortical stimulation, do not appear to be biased. For example, the mean change in saturation with stimulation for brain outside of the motor cortex in this study was not statistically different than zero (−0.3 ± 0.4%). Thus, absolute saturation baseline values and changes appear to be optically measurable in vivo over a wide range of ages, tissues, and conditions using diffusion-based approaches, although a small bias in the absolute values cannot be ruled out.
With regard to reproducibility of the measurement (precision), measuring changes in saturation from a local baseline again eliminates many of the uncertainties from the calculations. For example, the mean absolute saturation of the adult brain before a functional task had a SD of 8.5%, whereas functional stimulation produced changes with a SD of only 0.4%, a 20-fold reduction in signal noise when a change is measured rather than an absolute saturation value. Thus, changes in oxygenation with functional activity on the order of only 2% to 3%—more than 2 SD or more away from the local baseline variation—are well above the noise and thus are detectable.
A key issue is the lack of a standard model system. In vitro models have been proposed (Kurth et al., 1995). We suggest that heart-lung bypass is an ideal optical oximeter calibration model because it allows independent variation of arterial oxygenation and cerebral blood flow, direct measurement of venous oxygenation, and can provide for separate variation of extracranial and intracranial oxygenation, or left and right hemispheric oxygenation, using more than one bypass pump and circuit. However, although a gold standard is not available, any bias present in the measurement of hemoglobin saturation is not necessarily incorrect. Optical measures of saturation are a new type of measurement that may or may not correlate with previously used standards and may be more predictive of clinical outcome than conventional saturation measures.
The correspondence between optical approaches, and CT or MRI, supports use as an imaging modality for the localization of tissue injury, although current technology requires hours of optical monitoring for quantitative functional image data collection. Pathologic cortical changes have been measured previously using conventional CW sources, but absolute quantitation again was not possible in the absence of diffusion-based monitoring (Jobsis, 1977; Kurth et al., 1993; Brazy et al., 1986; Wyatt et al., 1989). Such approaches may allow real-time monitoring of brain injury, particularly if enhanced by other signals, such as the appearance of reduced cytochrome aa3 or through use of a pH-sensitive signal (Cooper et al., 1994; Cheong et al., 1995; Inagaki and Tamura, 1993). Dyes and contrast agents may improve localization and sensitivity.
Electrical and vascular responses
Investigation of the temporal and spatial relationship of electrical and vascular responses in brain would aid understanding of brain function. In addition to the slow vascular changes in blood volume and oxygenation occurring over seconds with motor activity, fast optical changes also exist, occurring over hundreds of milliseconds. These fast component changes co-localize tightly, both spatially and temporally, with the electrical waveform (EEG) (Gratton et al., 1995a, b ). Fast changes likely result from alterations in optical scattering (Koeppe et al., 1987; MacVicar and Hochman, 1991), although the source of this change is not known. Taken together, these results suggest that optical techniques may allow for simultaneous co-localization of the vascular and electrical components of neural function, allowing the coupling of these events to be explored in humans.
Measurement of such coupling may be of clinical importance. Mismatching of electrical activation and blood flow occur in disease conditions, such as seizure or stroke (Villringer et al., 1994; Wolf et al., 1996). In acute stroke, there is often a penumbra of living tissue with both vascular and electrical instability. This tissue is at high risk for progression to irreversible injury during a critical early window of time. Application of optical methods to the monitoring of both electrical and vascular temporal characteristics during this period may permit early identification of these at-risk regions, allowing optimization of therapeutic and neuroprotective strategies while minimizing risk.
Identification of injury sites at critical times
The ability to monitor and localize regional hemoglobin saturation noninvasively may allow for identification of existing or impending brain injury, providing opportunity for intervention. All of subjects imaged in the current study reflect an application in which conventional methods are either invasive or are not quantitative. Currently, no method exists for quantitatively demonstrating focal or multifocal sufficiency of brain oxygen delivery during high-risk periods, such as during bypass surgery or cardiac failure, nor are there ways to monitor in real-time the efficacy of neuroprotective strategies during stroke. Even basic medical questions such as the extent to which a transfusion improves brain oxygenation have been made difficult because of an inability to noninvasively monitor the brain. Because treatment options vary based on the size, location, and nature of a problem, such as size of a stroke or the location of a hemorrhage, an ideal optical monitor also should image.
Bedside availability may be critical for identifying existing or impending injuries during therapeutic windows that last only a few minutes or hours and for making prognostic decisions that may affect care. Illness may preclude transport to a CT or MRI facility, since patients requiring such imaging are most likely to be those who are too ill for safe transport. In addition, critical illnesses are, by nature, unstable and evolving, which further advocates continuous bedside monitoring rather than intermittent imaging at a distant imaging center. The infant optical scans in this study were obtained at the bedside, during a period of potential critical illness for the neonates, without interrupting or interfering with clinical care. This approach may, therefore, lead to development of clinically relevant optically based devices that produce rapid, continuous, bedside measurements or images of oxygen sufficiency.
Bridges to cross for successful clinical application
Several issues remain to be resolved. First, the anatomic source of the signal is not clear. Although any blood vessel can contribute in theory to the measured signal, the relative contribution of each vascular compartment, as well as the stability of this contribution, are unknown. Uncertainty as to the site of origin of the vascular signal also exists in other forms of imaging, such as in fMRI, and so is not unique to optical methods. In optical imaging, larger blood vessels are thought to have minimal influence on detected signal (Liu et al., 1995), whereas smaller vessels (arterioles, capillaries, and venules) are believed to be relatively evenly weighted in their effective contribution to the measurement. Under normal conditions, the fall in oxygen tension along a capillary is rapid at the proximal (arterial) end, with the average saturation value close to venous values. As a result, optical measurement of the capillary, and thus the overall tissue measurement, is venous weighted.
Measured saturation can be modeled as a function of a variable distribution factor r, where r is the apparent, optically sampled fraction of arterial blood in the measurement as described in the equation So
Next, predicting where photons have been, an essential component of imaging, yields conflicting data. As a result, there is a lack of consensus as to the resolution limit of optical imaging in adult brain. In contrast to the neonatal brain in which deep penetration is feasible (and has been demonstrated in this report), deep penetration into the adult brain may not be possible because of the high degree of scattering in adult white matter (Schweiger et al., 1993; Arridge and Schweiger, 1995). The current study sets worst-case limits for the maximal depth of optical imaging in the adult, because if an optical barrier to deep study does exist, it does not appear to prevent cortical optical monitoring; in fact, if such reflections are occurring at the white-gray interface, the reflective optics may be facilitating a focus on gray matter function by reducing the contribution of the deep white matter to the optical signal. Functional optical imaging may help address this depth limit issue by providing means to activate tissue at various preselected depths, although imaging at deeper depths in adults may need to await more sophisticated imaging paradigms under development.
Last, there are parallels between optical imaging and MRI. Changes in local environment can alter the optical absorbance spectrum in a similar manner to the way they can affect the nuclear magnetic resonance relaxation rates that form the basis of MRI contrast (Richards-Kortum and Sevick-Muraca, 1996; Hutchinson et al., 1996; Sevick-Muraca et al., 1998). Differences in relaxation rate constants have already been used in the mid-infrared to detect low-level substances in a highly absorbing background by allowing for decay-based suppression of the dominant water signal. Fluorescence intensity and time constants also may be used to extract quantitative information from endogenous or exogenous fluorophores (Hutchinson et al., 1996; Sevick-Muraca et al., 1998). Thus, the development of optical imaging may parallel that of MRI, not only in the ability to perform conventional absorbance-based spectroscopy, but also in the ability to use locally varying features to create field-sensitive images.
Footnotes
Acknowledgments
The authors thank A. H. Schwettman and T. R. Machold for assistance with this project.