
Abstract
In acute stroke, the target of therapy is the severely hypoxic but salvageable tissue. Previous human studies using 18F-fluoromisonidazole and positron emission tomography (18F-FMISO PET) have shown high tracer retention indicative of tissue hypoxia, which had normalized at repeat scan >48 h later. In the only validation study of 18F-FMISO, using ex vivo autoradiography in thread middle cerebral artery occluded (MCAo) rats, there was unexpected high uptake as late as 22 h after reperfusion, raising questions about the use of 18F-FMISO as a hypoxia tracer. Here we report a pilot study of 18F-FMISO PET in experimental stroke. Spontaneous hypertensive rats were subjected to distal clip MCAo. Three-hour dynamic PET was performed in 7 rats: 3 normals, 1 with permanent MCAo (two sessions: 30 mins and 48 h after clip), and 3 with temporary MCAo (45 mins, n = 1; 120 mins, n = 2; scanning started 30 mins after clip removal). Experiments were terminated by perfusion—fixation for standard histopathology. Late tracer retention was assessed by both compartmental modelling and simple side-to-side ratios. In the initial PET session of the permanent MCAo rat, striking trapping of 18F-FMISO was observed in the affected cortex, which had normalized 48 h later; histopathology revealed pannecrosis. In contrast, there was no demonstrable tracer retention in either temporary MCAo models, and histopathology showed ischemic changes only. These results document elevated 18F-FMISO uptake in the stroke area only in the early phase of MCAo, but not after early reperfusion nor when tissue necrosis has developed. These findings strongly support the validity of 18F-FMISO as a marker of viable hypoxic tissue/penumbra after stroke.
Introduction
In acute stroke, the penumbra, that is, the severely hypoxic but potentially salvageable region surrounding the ischemic core, is the main target for therapy (Baron, 2001a, b ). It is characterized by reduced perfusion in the face of relatively maintained oxygen consumption, which translates as reduced tissue partial O2 tension, increased O2 gradient from capillary to tissue, and elevated O2 extraction fraction.
Using invasive devices such as oxygen electrodes or electron paramagnetic resonance, tissue pO2 has been directly measured in animal stroke models (Crockard et al, 1976; Liu et al, 2004). It has occasionally been possible to measure tissue pO2 directly in man by insertion of oxygen electrodes into the parenchyma during craniotomy (Dings et al, 1998), but this is not practical in the clinical setting.
Recently, the hypoxia-sensitive nitroimidazoles have been used for direct mapping of the hypoxic tissue after stroke (Nunn et al, 1995; Baron and Warach, 2005). Nitroimidazole compounds such as 18F-fluoromisonidazole (18F-FMISO) diffuse freely across cell membranes and in living cells are then reduced by intracellular reductases into a radical anion. In normoxic conditions, this compound is rapidly reoxidized and diffuses back out of cells. Under hypoxic conditions, that is, inadequate oxygen supply relative to demand, however, further reduction steps occur, and the reduced compound becomes irreversibly bound to intracellular macromolecules. Thus, reduced nitroimidazoles are supposed to be trapped within hypoxic cells, but not by necrotic or nonhypoxic cells (Nunn et al, 1995).
The Melbourne group have investigated the potential of 18F-FMISO for detecting in vivo the hypoxic area and convincingly showed areas of increased 18F-FMISO uptake in acute stroke patients up to 48 h after clinical onset, fulfilling the operational criteria for penumbra (Read et al, 1998, 2000; Markus et al, 2004). Further, abnormal 18F-FMISO trapping was not observed at follow-up 18F-FMISO scan 6 to 11 days after onset (Read et al, 1998). These results were entirely consistent with the biochemical behavior outlined above. In the only experimental study on 18F-FMISO, Saita et al (2004), using ex vivo autoradiography, showed the expected high uptake during occlusion (using a 120 mins occlusion time), but also reported residual areas of increased 18F-FMISO retention in the affected areas as late as 20 h after removal of the middle cerebral artery (MCA) thread occlusion. The finding of residual tracer trapping long after removal of the occluding device raised questions about the mechanism(s) of 18F-FMISO trapping and its use as a hypoxia marker, but the authors proposed periinfarct edema, small vessel occlusion, or the ‘no-re-flow' phenomenon as possible explanations for possibly persistent hypoxia. No in vivo study on 18F-FMISO in ischemic stroke models has been reported to date.
In the present study, we report pilot results of 18F-FMISO positron emission tomography (PET) in experimental stroke. Rats were subjected to clip MCA occlusion (MCAo), followed by full histopathology. Our primary aim was not to document trapping of 18F-FMISO in the situation of acute ischemia, which is well established (Read et al, 1998, 2000; Markus et al, 2004; Saita et al, 2004), but to investigate whether significant trapping would occur when the tissue is necrotic, for example, 48 h after permanent MCAo, or when it has been through a phase of severe ischemia but is neither necrotic nor hypoxic, for example, after brief MCAo.
Materials and methods
Animals and Experimental Design
All animal experiments were in accordance with UK Home Office guidelines, and were approved the University of Cambridge Animal Ethical Review Panel.
Seven male spontaneous hypertensive rats (Charles River Laboratory, Margate, UK) weighing 295 to 305 g were used. The experimental design, including the timing of 18F-FMISO injection relative to the start of MCAo, is shown in Table 1. In all rats, we implemented 3-hour 18F-FMISO dynamic PET scanning. Three normal rats were used as controls. One rat was subjected to permanent MCAo (2 PET sessions: 1 early after clip placement and the other 48 h later), and 3 rats to temporary MCAo (1 PET session each after 45- or 120-minutes temporary MCAo; n = 1 and n = 2 rats, respectively). Experiments were terminated by perfusion—fixation immediately after completion of the final PET session.
Experimental design
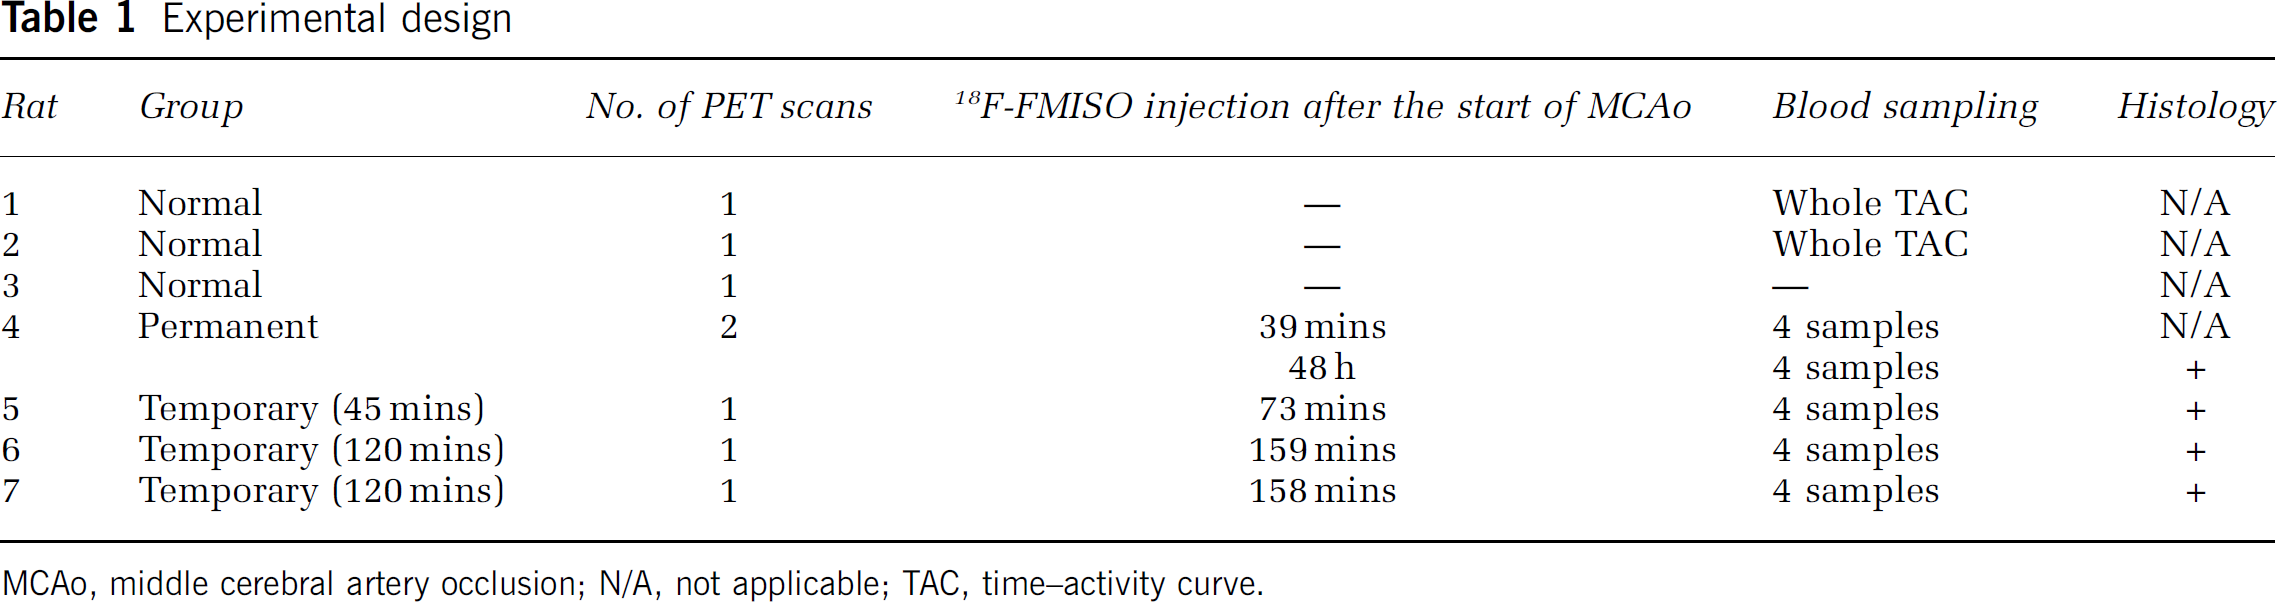
MCAo, middle cerebral artery occlusion; N/A, not applicable; TAC, time—activity curve
Anesthesia
Anesthesia was induced with 4% isoflurane administered in a 0.3 L/mins O2 and 0.7 L/mins N2O mix, and maintained with 2% isoflurane during all surgical procedures. The left femoral vein was cannulated for the injection of 18F-FMISO, and blood samples in both normal and stroke rats were obtained via right femoral artery cannulation. A heparinized saline flush was used to maintain the arterial line patency. Body temperature was maintained at 37°C throughout the surgery and PET scanning using a rectal temperature-regulated heating pad.
Focal Ischemia
Middle cerebral artery occlusion was performed using the method described by Buchan et al (1992). Briefly, the right common carotid artery was isolated through a ventral midline neck incision, and a 4-0 surgical silk ligature loosely placed around the artery. With the rat positioned onto its left flank, a 1-cm incision perpendicular to and bisecting a line between the lateral canthus of the right eye and the external auditory canal was made. The underlying temporalis muscle was excised, and under direct visualization, the right MCA was exposed through a 2-mm burr hole drilled 2 to 3 mm rostral to the fusion of the zygomatic arch with the squamosal bone. Drilling was performed under saline irrigation.
The MCA was visualized where it crosses the inferior cerebral vein, which lies within the rhinal fissure. The site of the occlusion is proximal to the MCA bifurcation, but distal to the origin of the lenticulostriate arteries. The dura overlying the MCA was cut and retracted. A #1 microaneurysm clip (Codman, Sundt AVM, Raynham, MA, USA) was placed on the MCA, the wound was closed, and then the right common carotid artery was ligated, as prepared beforehand.
In the permanent MCAo model (Rat #4), the microaneurysm clip remained in situ for the duration of the study until perfusion fixation. Positron emission tomography scanning was carried out twice, shortly after occlusion and 48 h later. In the temporary MCAo models, the clip was removed 45 mins (Rat #5) and 120 mins (Rat #6 and #7) after the start of MCAo. In each rat, effective recanalization of the MCA was visually verified.
Positron Emission Tomography Scanning
Animals were imaged using a micro-PET P4 scanner (Concorde Microsystems, Knoxville, TN, USA) (Tai et al, 2001). After the surgical procedures (described above), the animal was placed prone on the scanning bed, and located in a purpose-built plastic frame incorporating ear bars and a bite bar. In all cases, the brain was centered in the field of view of the scanner (78 mm axial × 200 mm diameter) to maximize sensitivity and resolution (~2 mm). Once positioned on the bed and for the duration of PET scanning, anesthesia was reduced to 1% to 1.5% isoflurane in 0.3 L/mins O2 and 0.7 L/mins N2O mix.
In the permanent MCAo rat, the first PET session commenced as quickly as possible after clip placement (39 mins later). In the temporary MCAo rats, scanning was also started as quickly as possible after clip removal (28 to 39 mins later) (Table 1).
In each rat, around 80 MBq of 18F-FMISO were injected intravenously as a bolus. The PET timeframes were as follows: 10 × 30 secs, 15 × 1 mins, 5 × 2 mins, and 30 × 5 mins (total: 60 frames, up to 180 mins after injection). The energy and timing windows used were 350 to 650 keV and 6 nsecs, respectively. Emission data acquisition was followed by transmission scans for attenuation correction (acquisition time: 20 mins) with a rotating germanium-68/gallium-68 point source. The transmission scans were performed after the emission scans to start the latter as soon as possible after clip placement/removal. Windowed coincidence mode transmission scanning was used to reduce emission contamination of the transmission data to < 1%.
Throughout the imaging protocol, SaO2 and heart rates were continuously monitored using noninvasive pulse oximetry. The latter were maintained at 96% to 98% and 350 to 360 beats/mins, respectively.
Blood Sampling
To determine arterial blood 18F-FMISO kinetics, two normal rats underwent serial blood sampling (Table 1). Blood samples were withdrawn every 3 secs for the first 3 mins, then every minute for the next 7 mins, every 5 mins for 20 mins, and every 30 mins for the final 150 mins. To limit blood loss, blood samples were taken at 30, 60, 120, and 180 mins after tracer injection from the MCAo rats. These samples were used to scale an input function determined from a control rat.
All samples were stored in 0.2 mL microcentrifuge tubes in ice-cold water. The radioactivity concentration of each sample (in kBq/mL) was measured using a sodium iodide well counter (Canberra Harwell, Didcot, UK). To study the distribution of 18F-FMISO in blood, immediately after radioactivity counting in whole blood, the samples were centrifuged and the radioactivity concentration in plasma was measured.
Image Analysis
The images were reconstructed using the PROMIS 3D filtered backprojection algorithm (Kinahan and Rogers, 1989), adapted in-house to work with data from the micro-PET P4 scanner.
Corrections for randoms, dead time, background, normalization, attenuation, sensitivity, and decay were applied to the data during reconstruction. Images were reconstructed into 0.5 × 0.5 × 0.5 mm3 voxels in an array of 180 × 180 × 151 and a Hanning window cutoff at the Nyquist frequency was incorporated into the reconstruction filters to give an image resolution of ~ 2.3 mm full-width at half-maximal.
The acquired data were transformed and analyzed using the software package Analyze 6.0 (AnalyzeDirect Inc., Lenexa, KS, USA). First, the 0 to 180 mins added PET image sets from all rats were coregistered to a magnetic resonance imaging (MRI) T1 template of a healthy spontaneous hypertensive rat rat of similar age and weight, using a six-parameter rigid manual coregistration as previously reported by Hughes et al (2005) in our laboratory using the same rat MCAo model. An ‘affected cortex region of interest (ROI)‘ was defined across 36 contiguous coronal slices as the intersection between the upper 80% threshold of the 18F-FMISO added scan of the first PET session of the permanent MCAo rat (where hypoxia and thus tracer trapping were expected), and the borders of the cortex as defined on the coronal MRI (see Figure 2E for illustration). A mirror ROI was then generated on the unaffected cortex.
Blood tracer kinetics and PET data in a normal rat (#1). (
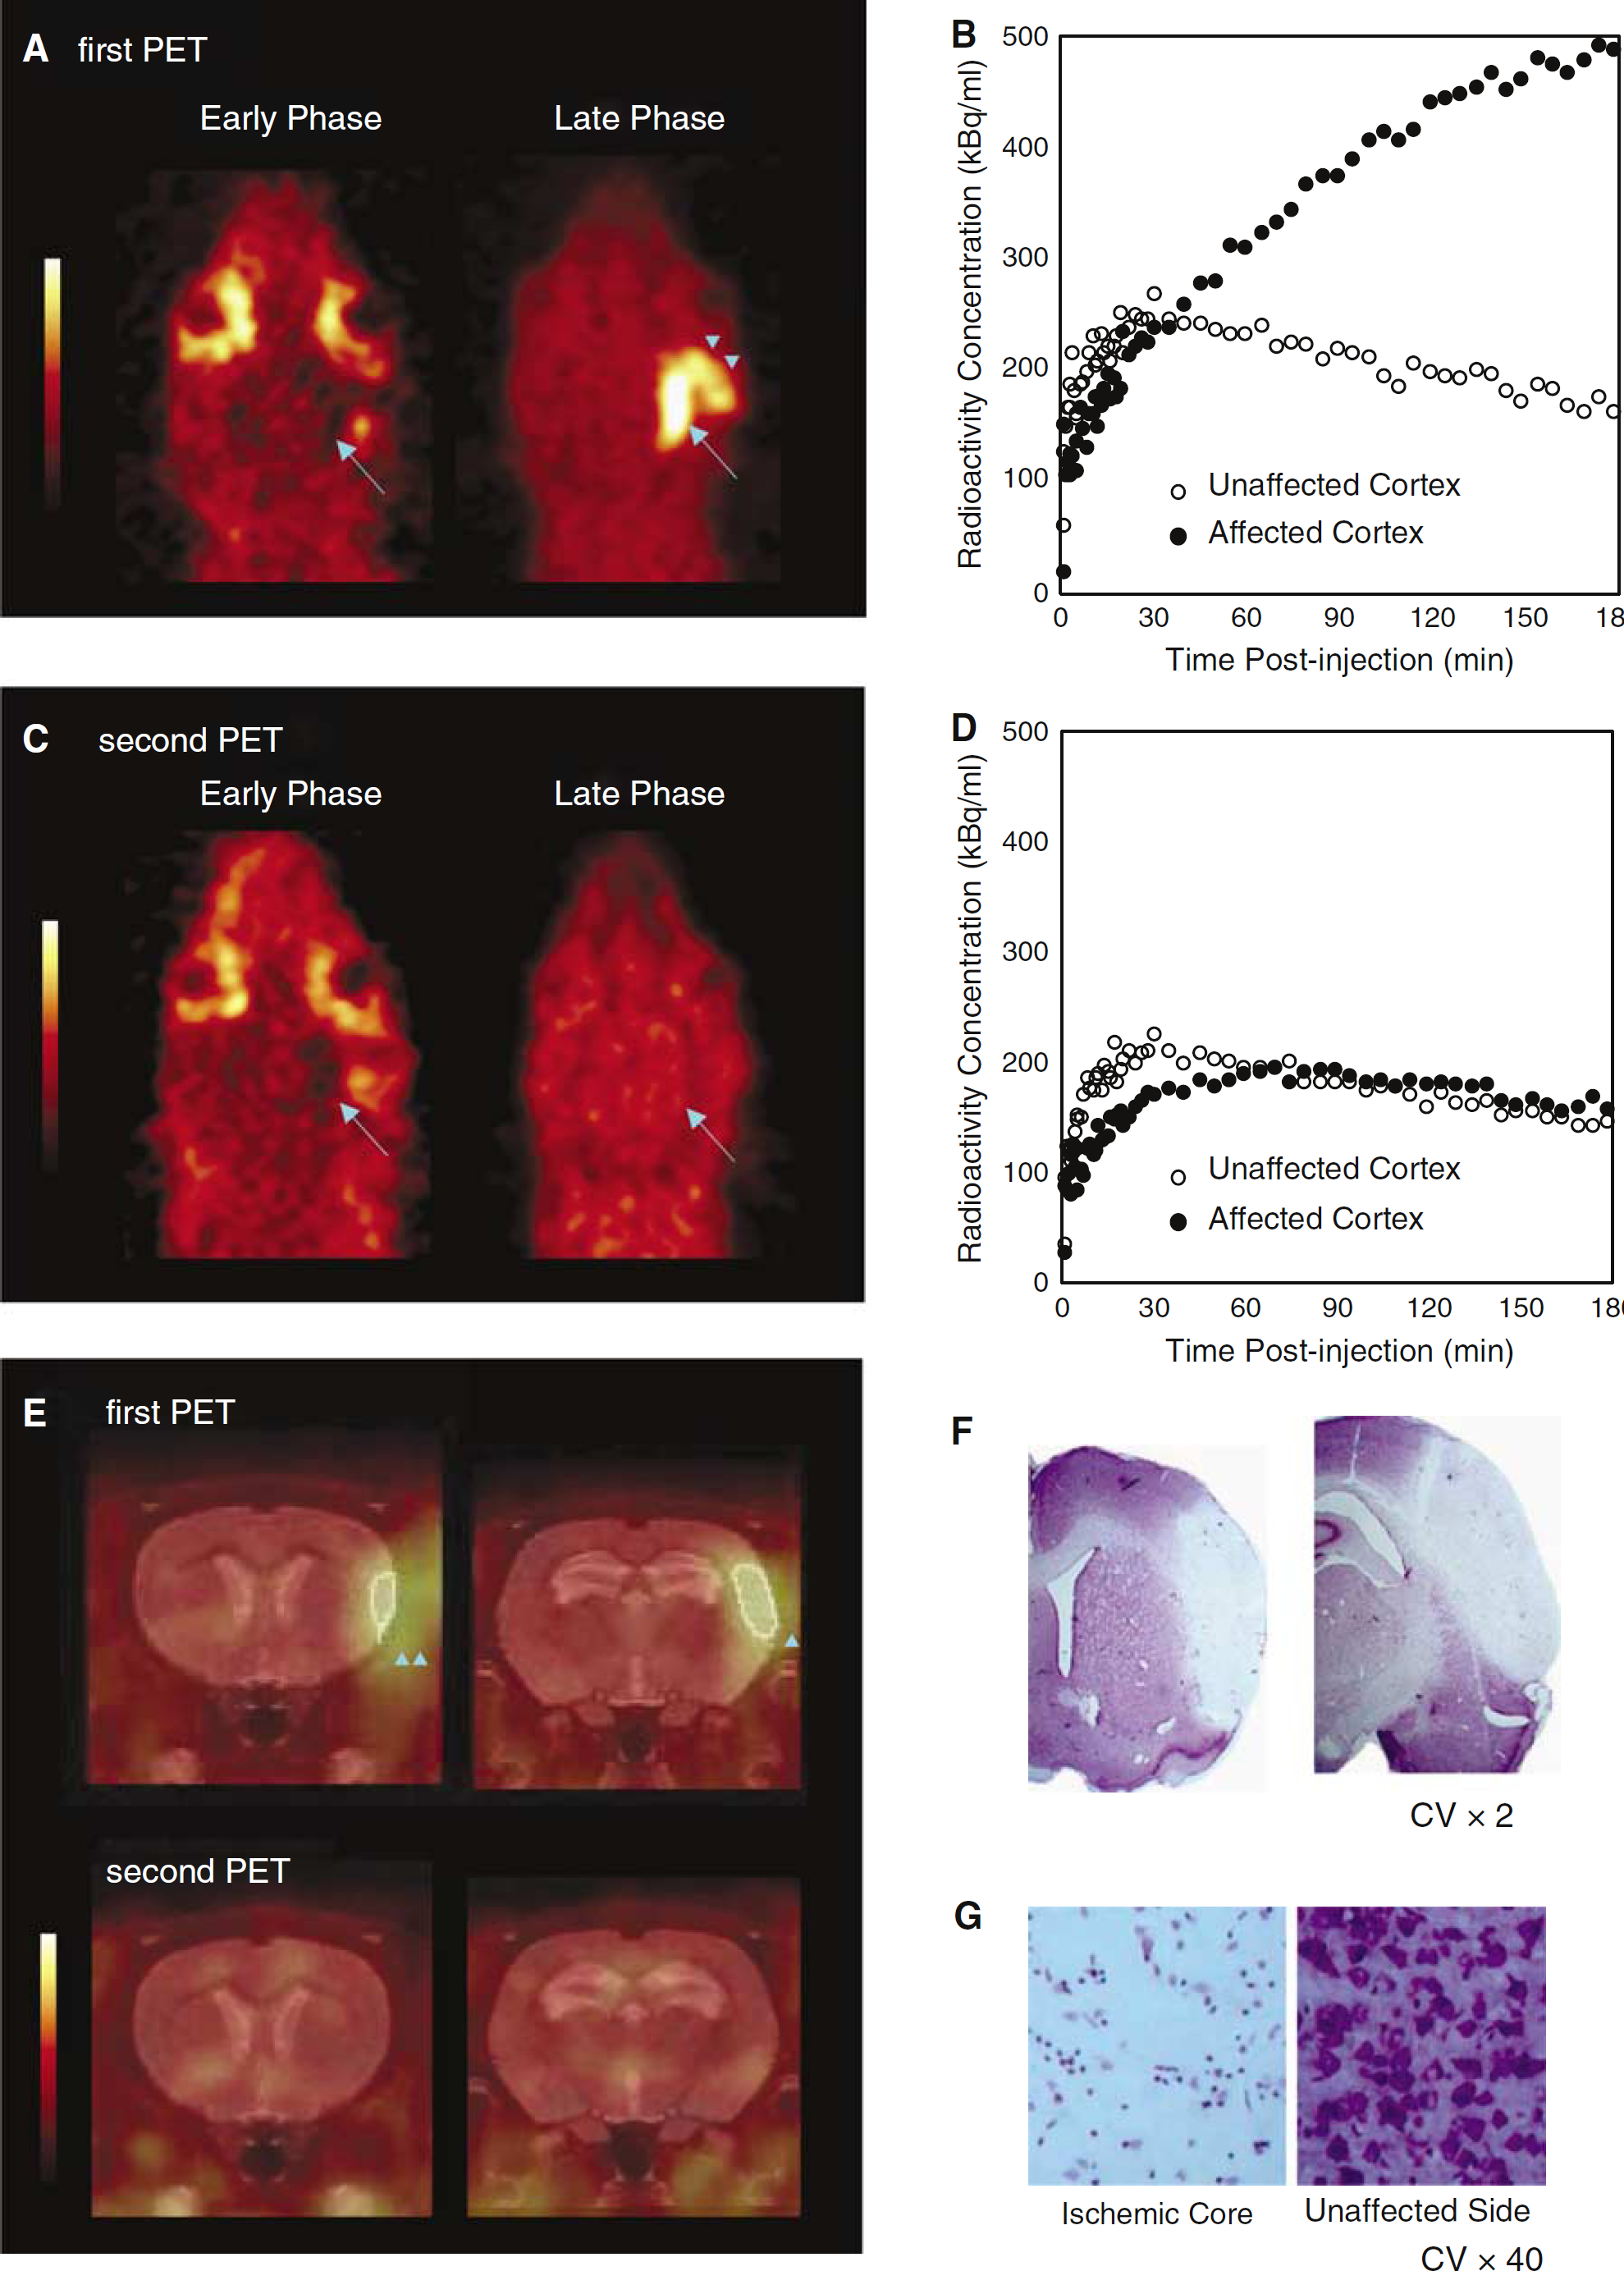
Positron emission tomography data and histology in the permanent MCAo rat (Rat #4). (
This set of ROIs (with their mirrors) was then applied to the resliced dynamic PET data of all the rats. The weighted mean radioactivity concentration (in kBq/mL) in the set of ROIs on each side was then calculated to produce a mean time—activity curve (TAC) for each side.
Kinetic Modelling
Based on the biochemical behavior of 18F-FMISO, an irreversible two-tissue compartmental model was used in this study. The arterial input function for rats other than Rat #1 was approximated by scaling the arterial input function from Rat #1 through least-squares fitting with the four discrete blood samples (Hughes et al, 2005).
K1 (transport rate from plasma to the ‘free’ tissue compartment) and Ki (influx rate from plasma to the ‘bound' compartment) were computed from the mean TACs (one for each hemisphere) and arterial input function using in-house compartmental modelling software. Ki was determined from [K1 · k3/(k2 + k3)], where k2 indicates the transport rate from the ‘free' compartment to plasma and k3 describes the influx rate constant from the ‘free' to the ‘bound' compartment. The rate constant k4 was assumed to be zero because of the chemically covalent binding in hypoxic tissue. Fitting for K1, k2, and k3 used iteratively reweighted least squares, which adjusts the weighting factors according to noise estimation (Muzic and Christian, 2006). Right/left (controls) or affected/unaffected side (MCAo) ratios for K1 and Ki were then calculated.
In addition, the right/left or affected/unaffected ratios of radioactivity concentrations (to be referred to as AR) were also computed, for the first 10 PET frames (0 to 5 mins) to obtain an index of perfusion, and for the last 10 frames (130 to 180 mins) to assess late uptake/retention. The right/left or affected/unaffected ratios of radioactivity concentrations were obtained as they can be less prone to calculation errors than K1 and Ki, and also because only late scans ARs have been reported in previous publications on 18F-FMISO in stroke (Read et al, 1998, 2000; Markus et al, 2004; Saita et al, 2004).
Histology
In the MCAo rats, immediately after the completion of the PET scanning protocol (Table 1), the rat was transcardially perfused with 4% paraformaldehyde, the brain harvested and postfixed in paraformaldehyde overnight. The following day, the brain was immersed in 30% sucrose solution until it sank to the bottom of the vial, then 40-μm-thick coronal sections were cut on a cryostat, mounted on poly-
The mounted sections were carefully dehydrated in 70%, 95%, and 100% ethanol for 15 mins, and then immersed back through 95%, 70% ethanol and distilled water. The slides were immersed in Cresyl Violet (CV) solution for 30 mins. They were briefly washed in distilled water, 70%, 95%, and 100% ethanol, cleared with xylene, and then coverslipped (Tureyen et al, 2004). Cresyl Violetstained tissue was evaluated by light microscopy.
Results
Normal Rats
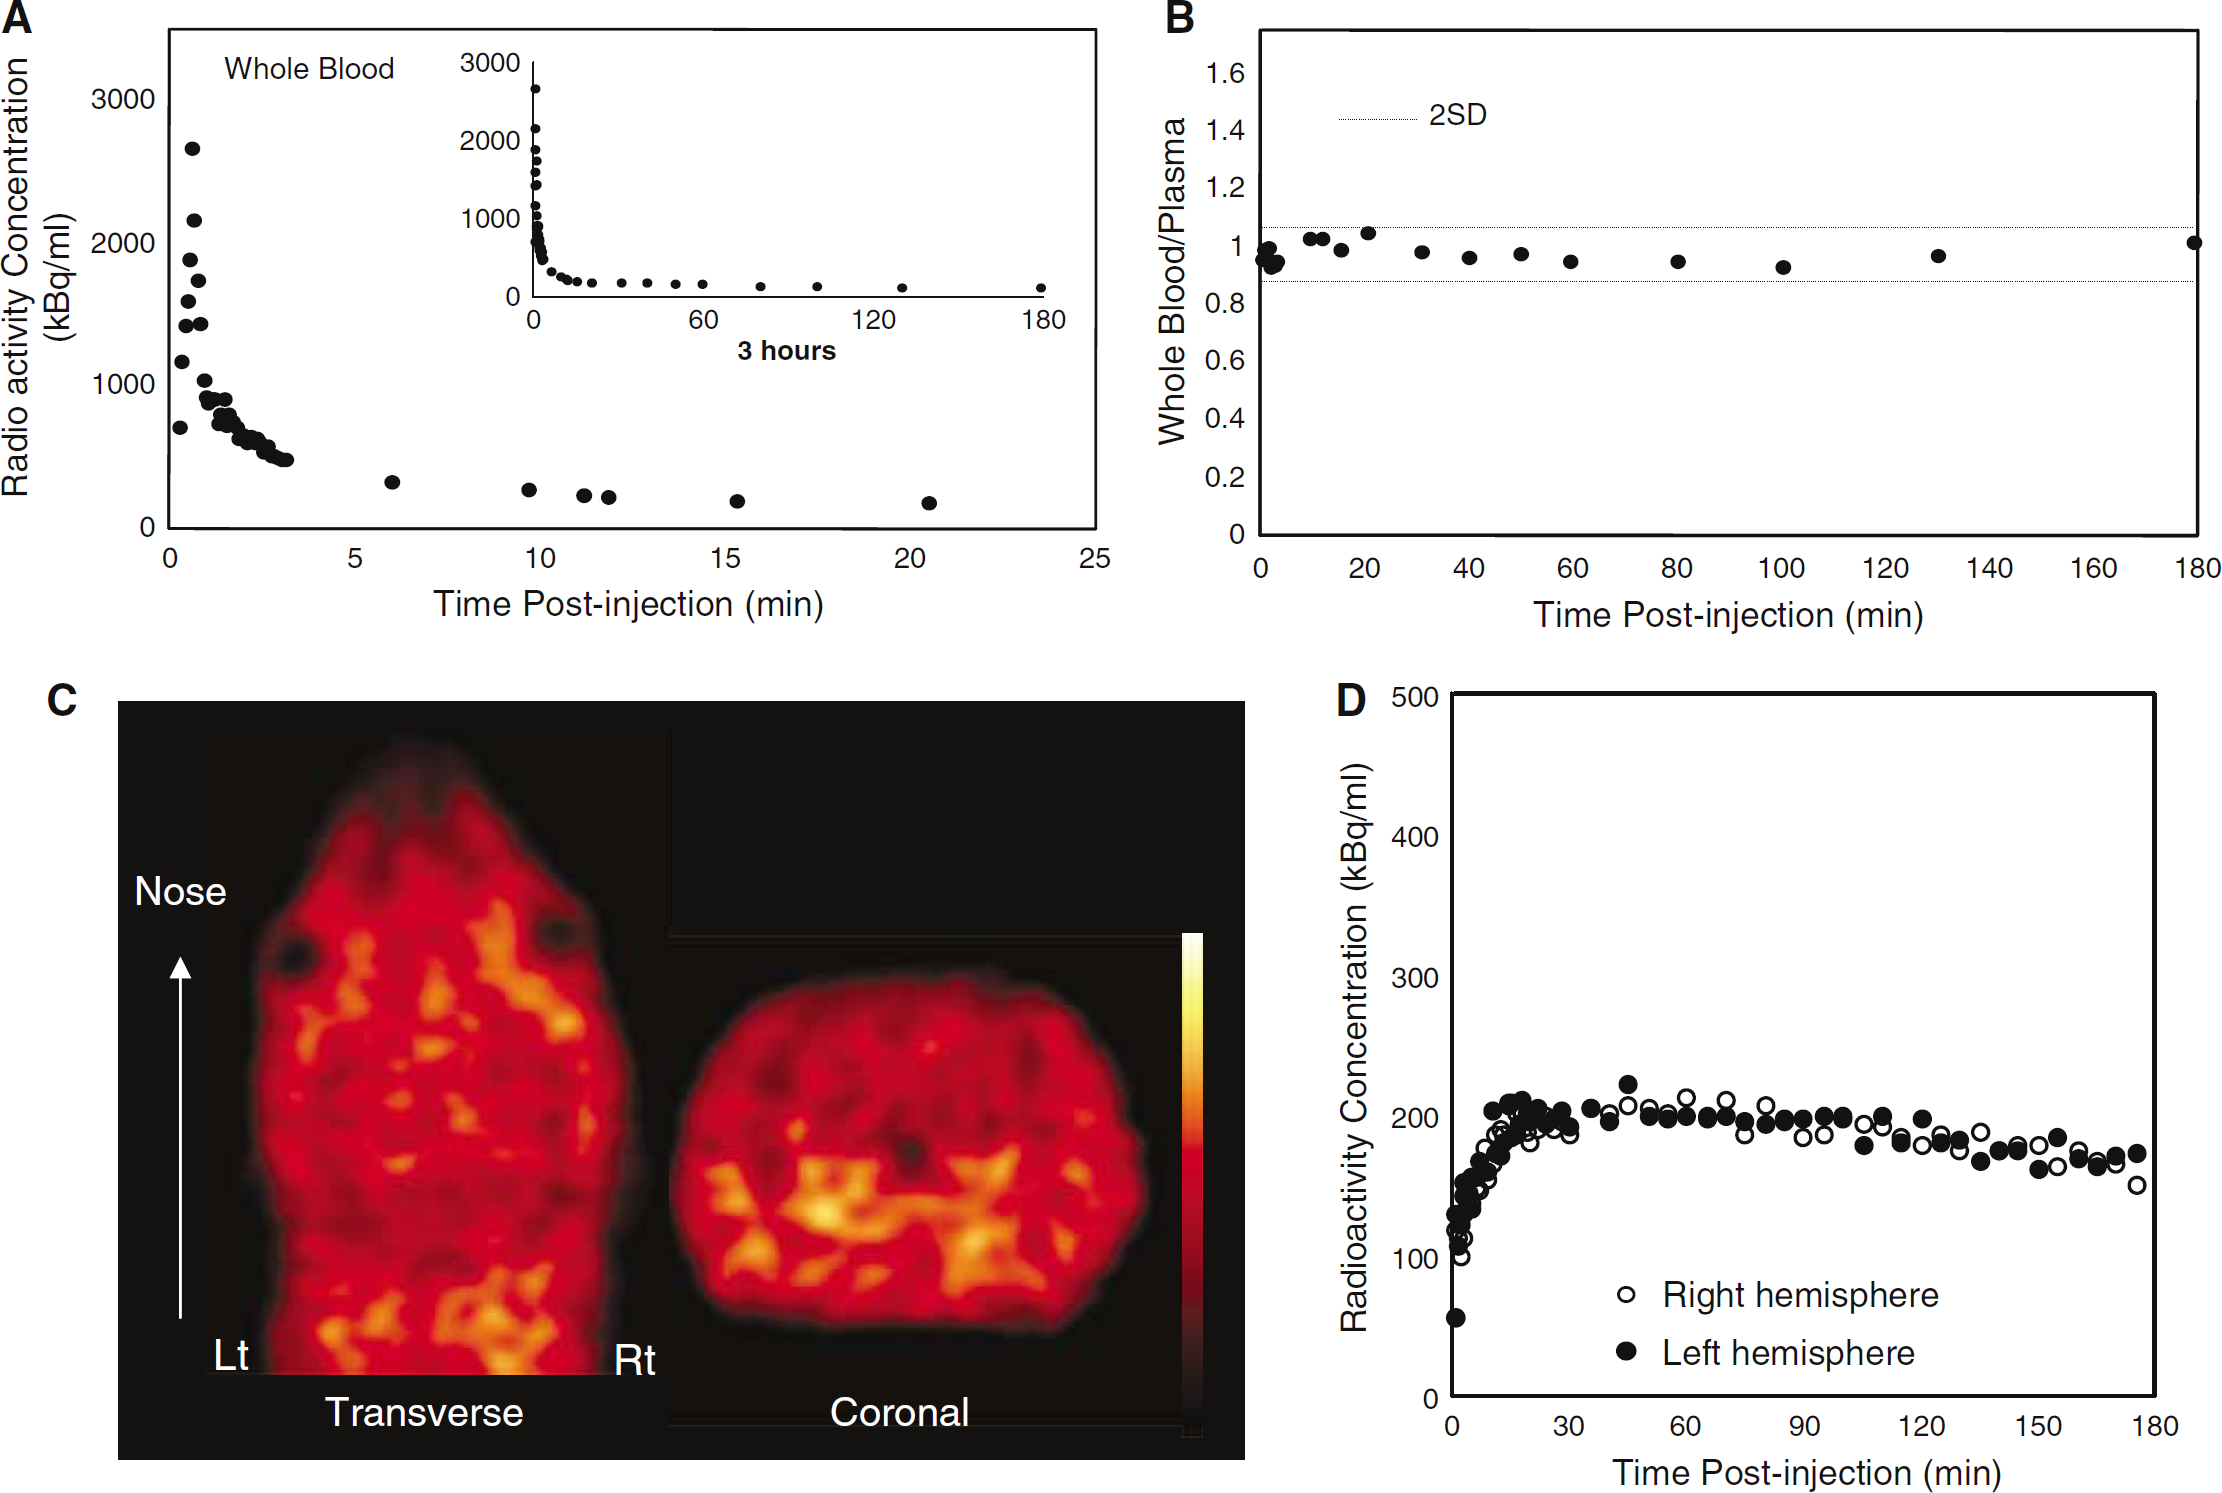
The TAC of the whole blood in a normal rat is illustrated in Figure 1A. The whole blood/plasma radioactivity ratio was essentially stable throughout the experiment (1.06 ± 0.05, mean value ± 1 s.d.) (Figure 1B). The results in the other rat were very similar, with a whole blood/plasma ratio of 0.98 ± 0.04.
18F-fluoromisonidazole distribution (weighted sum across the entire 60 frames) is illustrated in Figure 1C. The brain was well delineated, but summed uptake was higher in some extracerebral tissues. Time—activity curves for both cerebral hemispheres are illustrated in Figure 1D. Activity peaked around 30 mins after tracer administration, followed by a gradual decline. The results for the other rats were very similar.
Results for K1, Ki, their ratios, and AR are shown in Table 2. The values for both hemispheres were similar for all variables.
PET results and histology
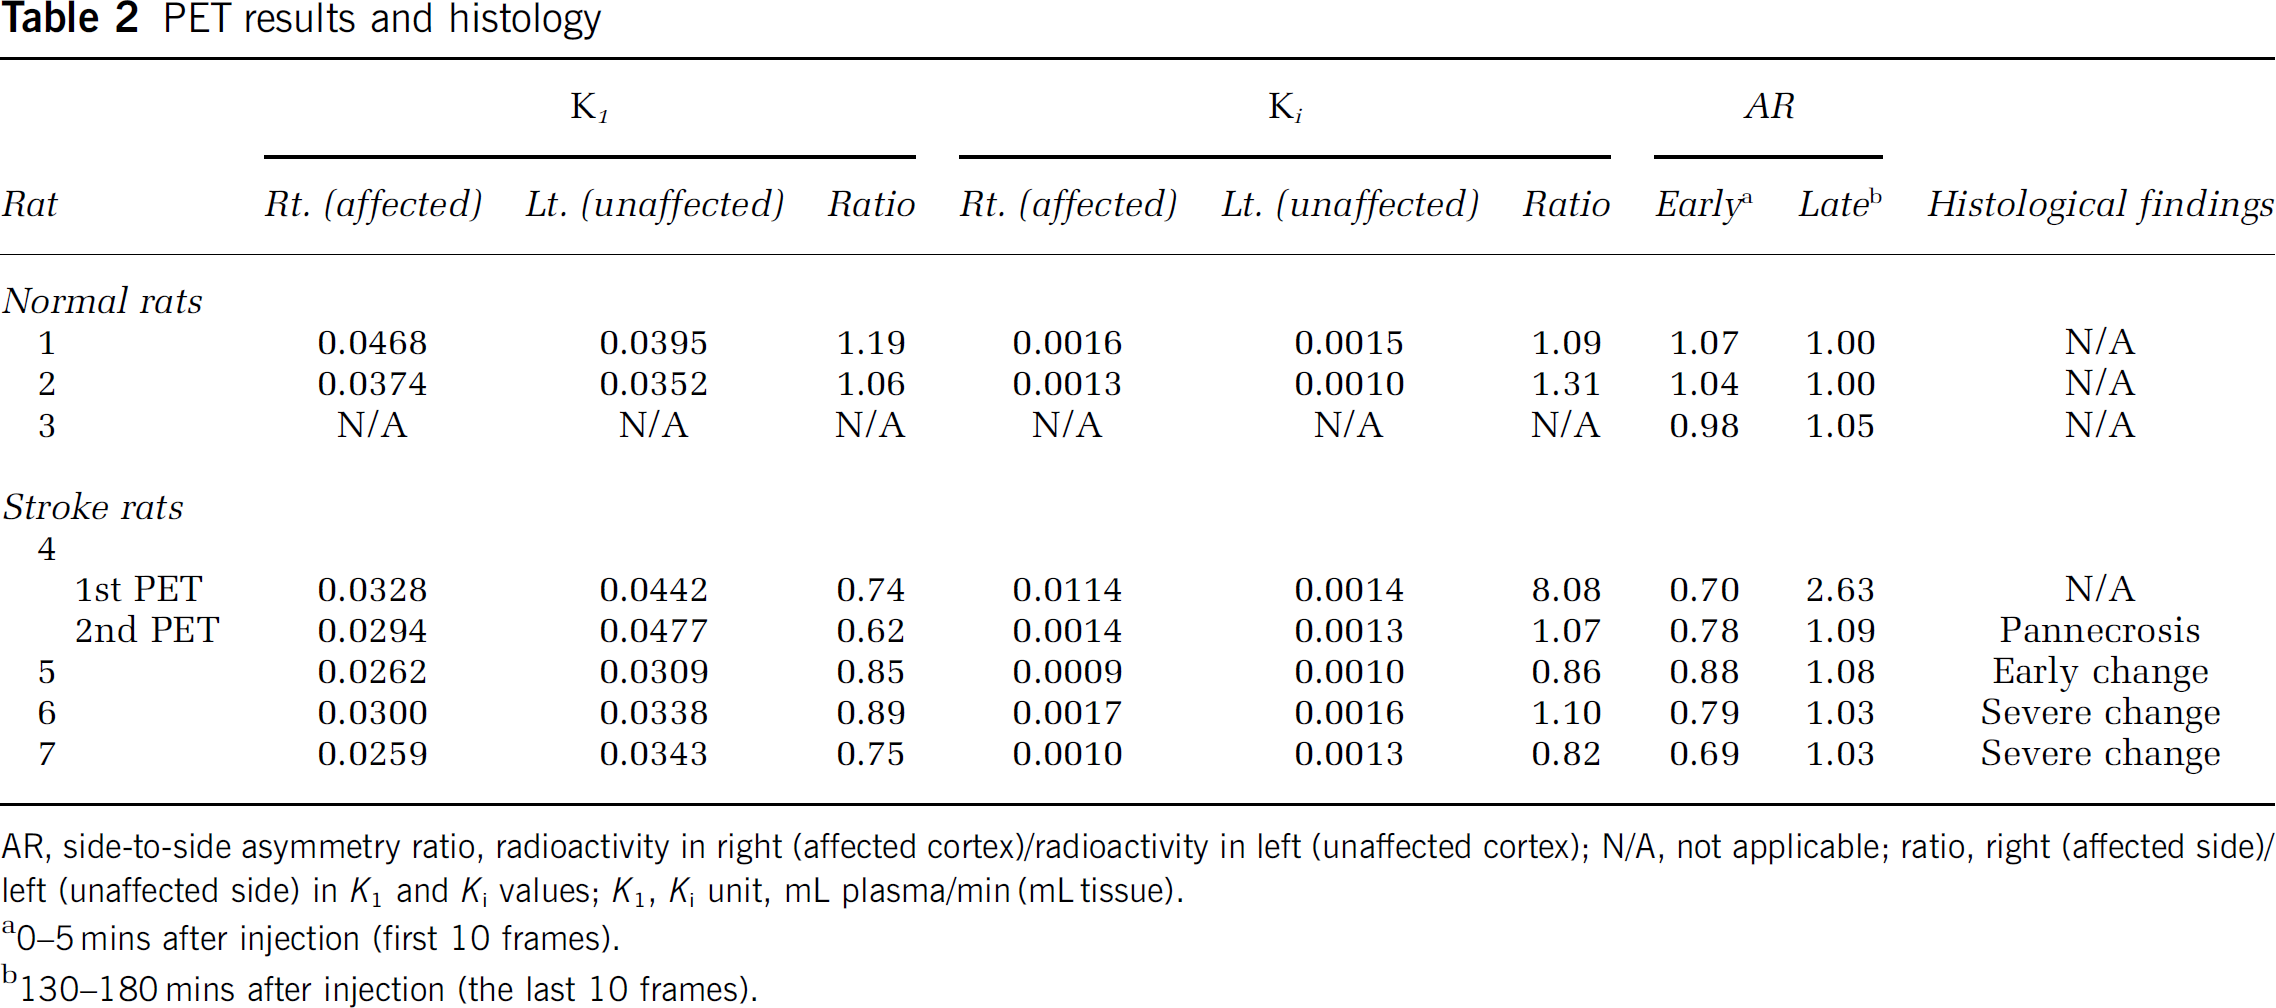
AR, side-to-side asymmetry ratio, radioactivity in right (affected cortex)/radioactivity in left (unaffected cortex); N/A, not applicable; ratio, right (affected side)/left (unaffected side) in K1 and Ki values; K1, Ki unit, mL plasma/min (mL tissue).
0–5 mins after injection (first 10 frames).
130–180 mins after injection (the last 10 frames).
Permanent Middle Cerebral Artery Occlusion
The quantitative values are shown in Table 2 and the TACs and PET images illustrated in Figure 2.
In the first PET session, early uptake in the affected hemisphere was lower than in the unaffected hemisphere (Figure 2A, left panel; Figure 2B; early AR = 0.70). Subsequently, there was gradual retention of the tracer on the affected side, reaching greater than twice that in the unaffected side near the end of scanning (Figure 2A, right panel; Figure 2B; late AR = 2.63). The PET images fused to the MRI template illustrate that the high tracer uptake centered on the cortical ribbon, as expected with this MCAo model (Figure 2E, top row). There was also some 18F-FMISO accumulation in the overlying surgically damaged temporalis muscle (Figure 2A).
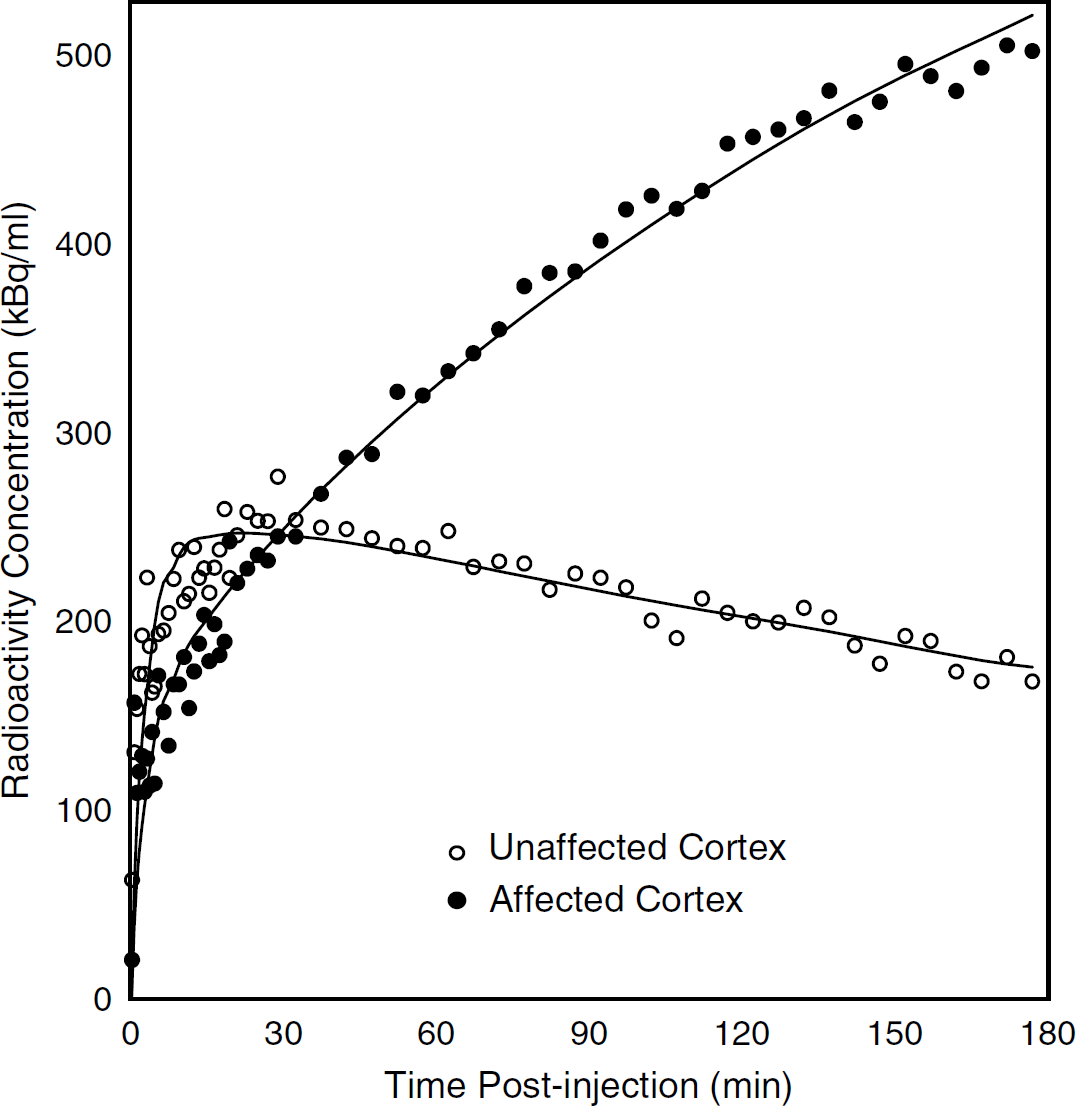
In the second PET session (48 h later), early tracer uptake in the affected hemisphere was again lower than in the unaffected hemisphere (Figure 2C, left panel; Figure 2D; early AR = 0.78). However, there was no subsequent tracer retention in the affected side, nor in temporalis muscle (Figure 2C, right panel; Figure 2E, lower row). The TAC for the affected side displayed a slow upslope during the early phase, which then reached a plateau to superimpose onto the unaffected side at the end of scanning (Figure 2D; late AR = 1.09). Both the K1 and Ki values for the unaffected side were similar to those of the two normal rats (Table 2). In the affected cortex, there was a markedly increased Ki value in the first PET session (Ki ratio = 8.08), which was back within the normal ranges for the second session. The K1 ratio was decreased at both first and second PET sessions (ratio = 0.74 and 0.62; Table 2). Figure 3 illustrates the results of the fitting procedure for the affected-side and unaffected-side TACs of first PET session.
This illustrates the results of the fitting procedure (continuous line) for the affected- and unaffected-side TACs for Rat # 4, first PET session. As can be seen, the fit was satisfactory for both TACs.
Histopathology revealed tissue infarction with clear pannecrosis (Figures 2F and 2G).
Temporary Middle Cerebral Artery Occlusion
The quantitative values are shown in Table 2 and the TACs and PET images are given in Figures 4 and 5.
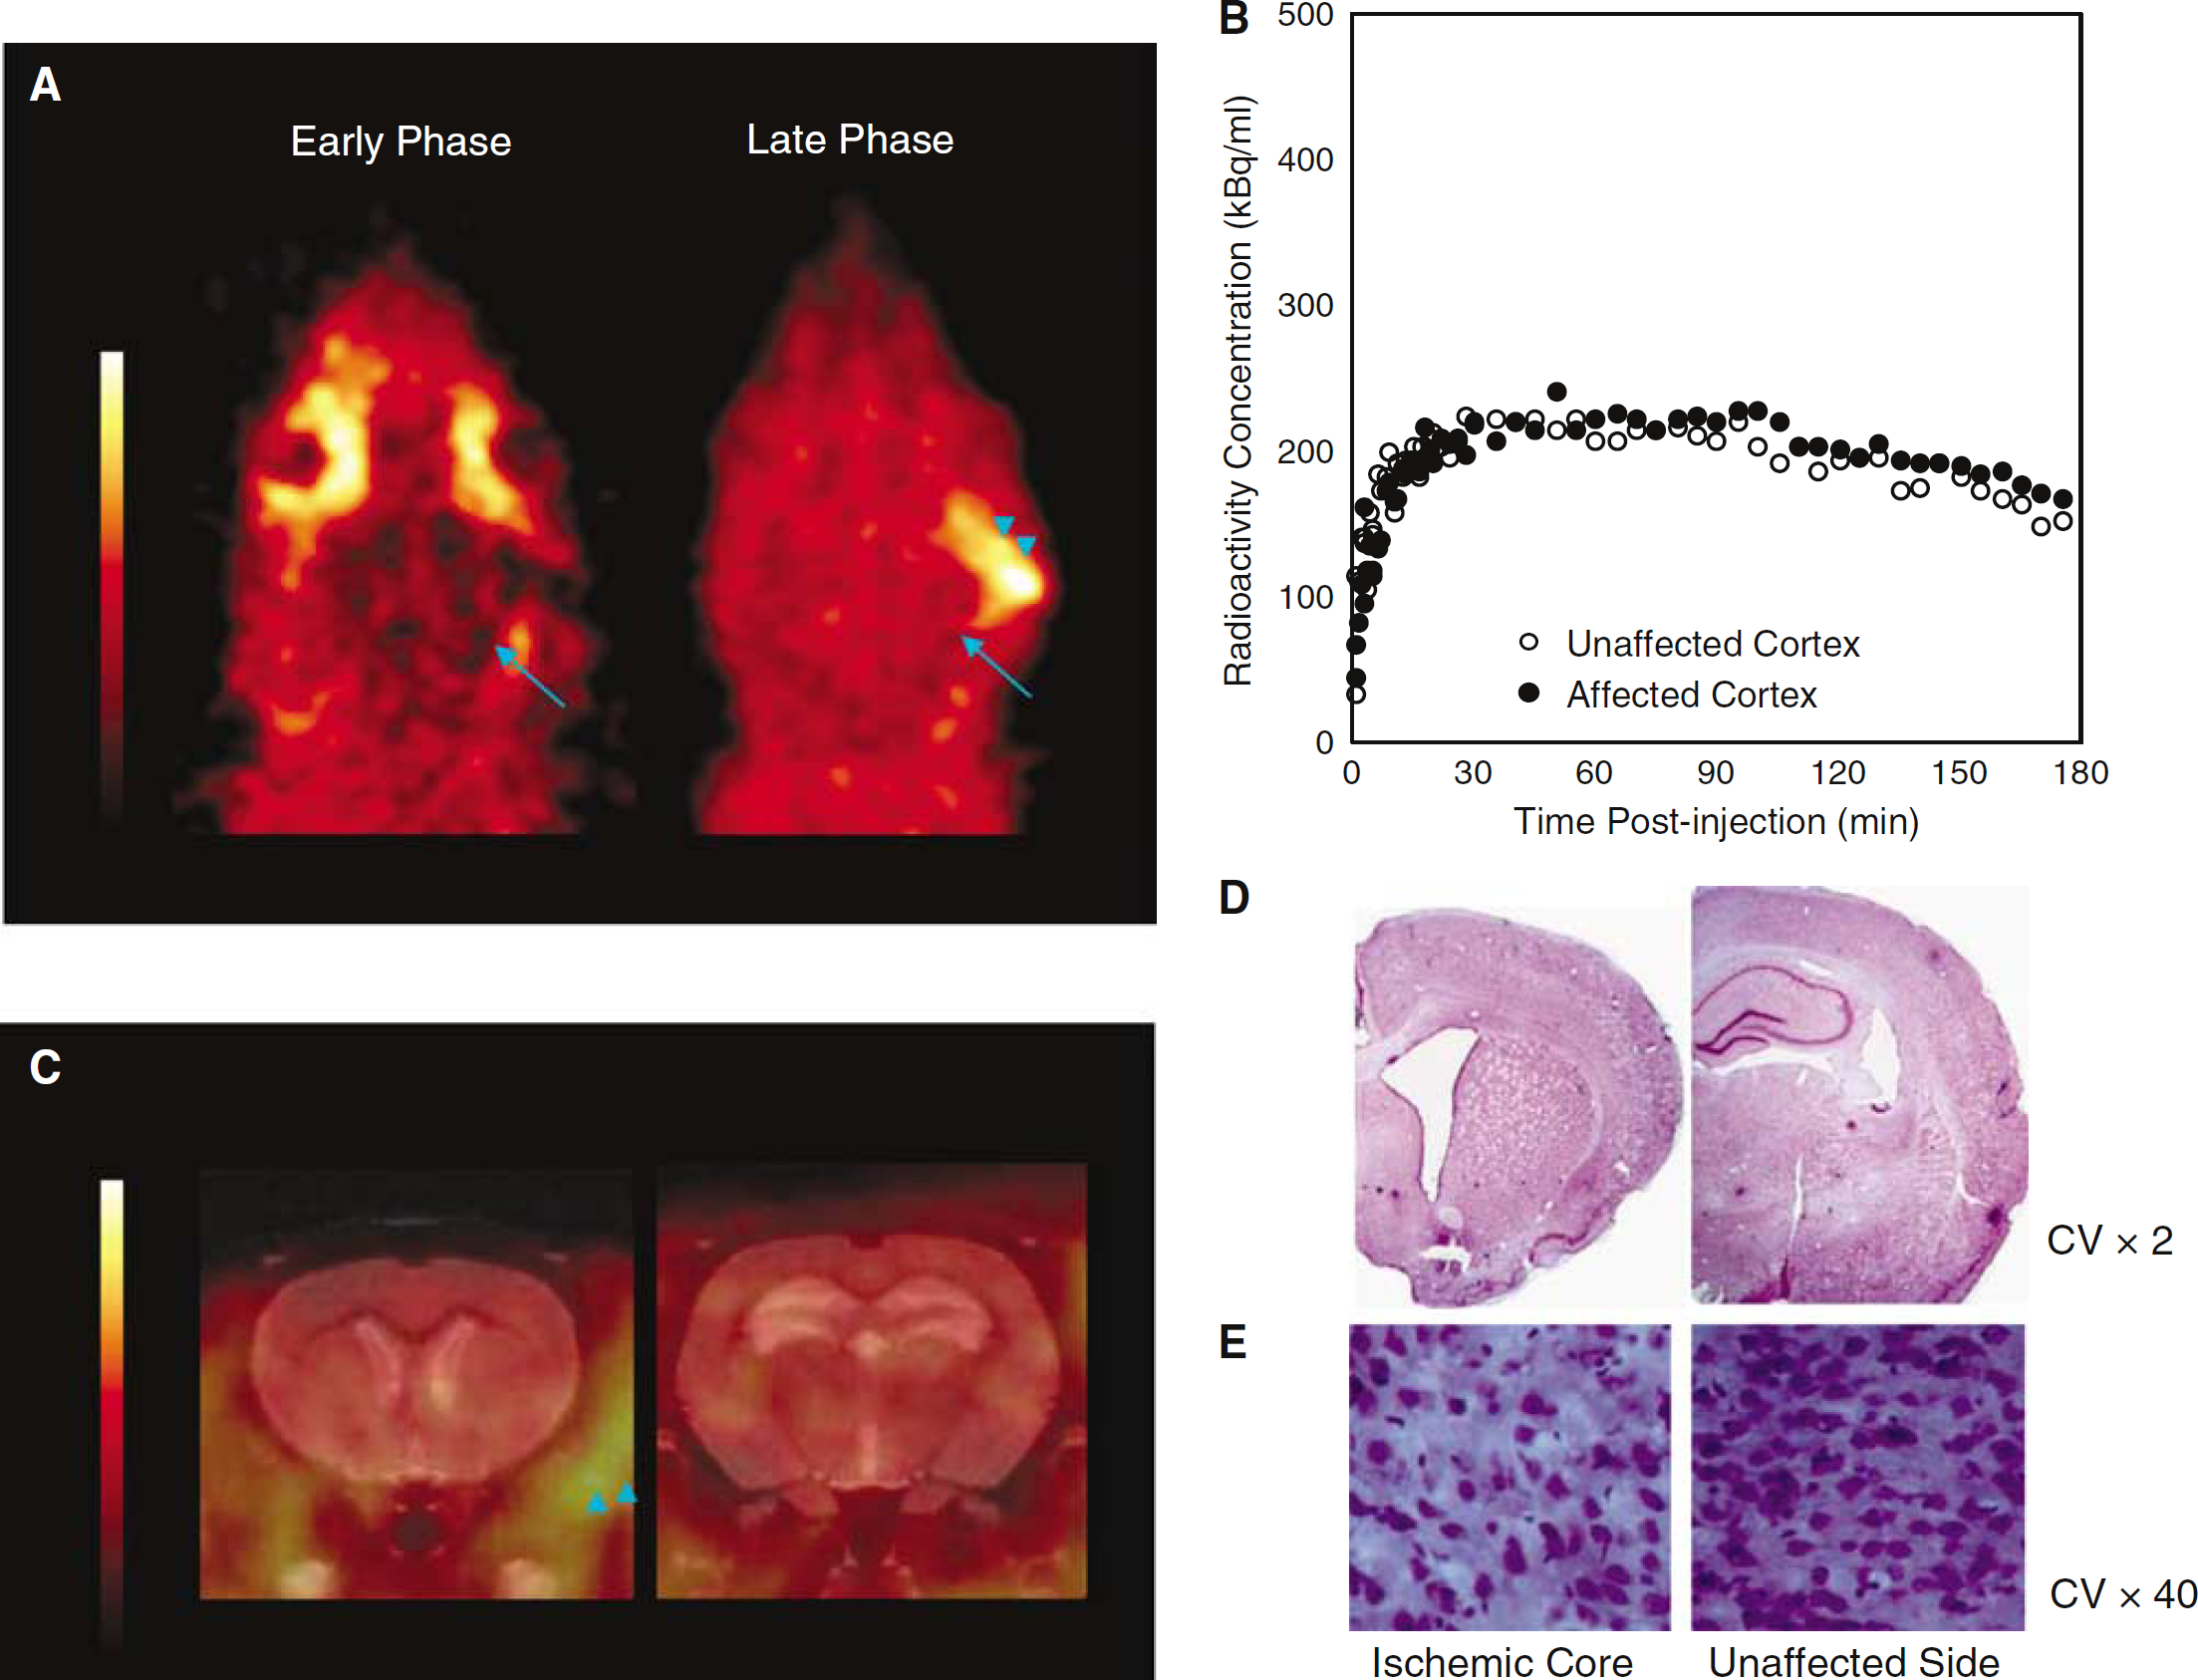
Positron emission tomography data and histology in the 45-minute temporary MCAo rat (Rat #5). The same layout as in Figure 2. (
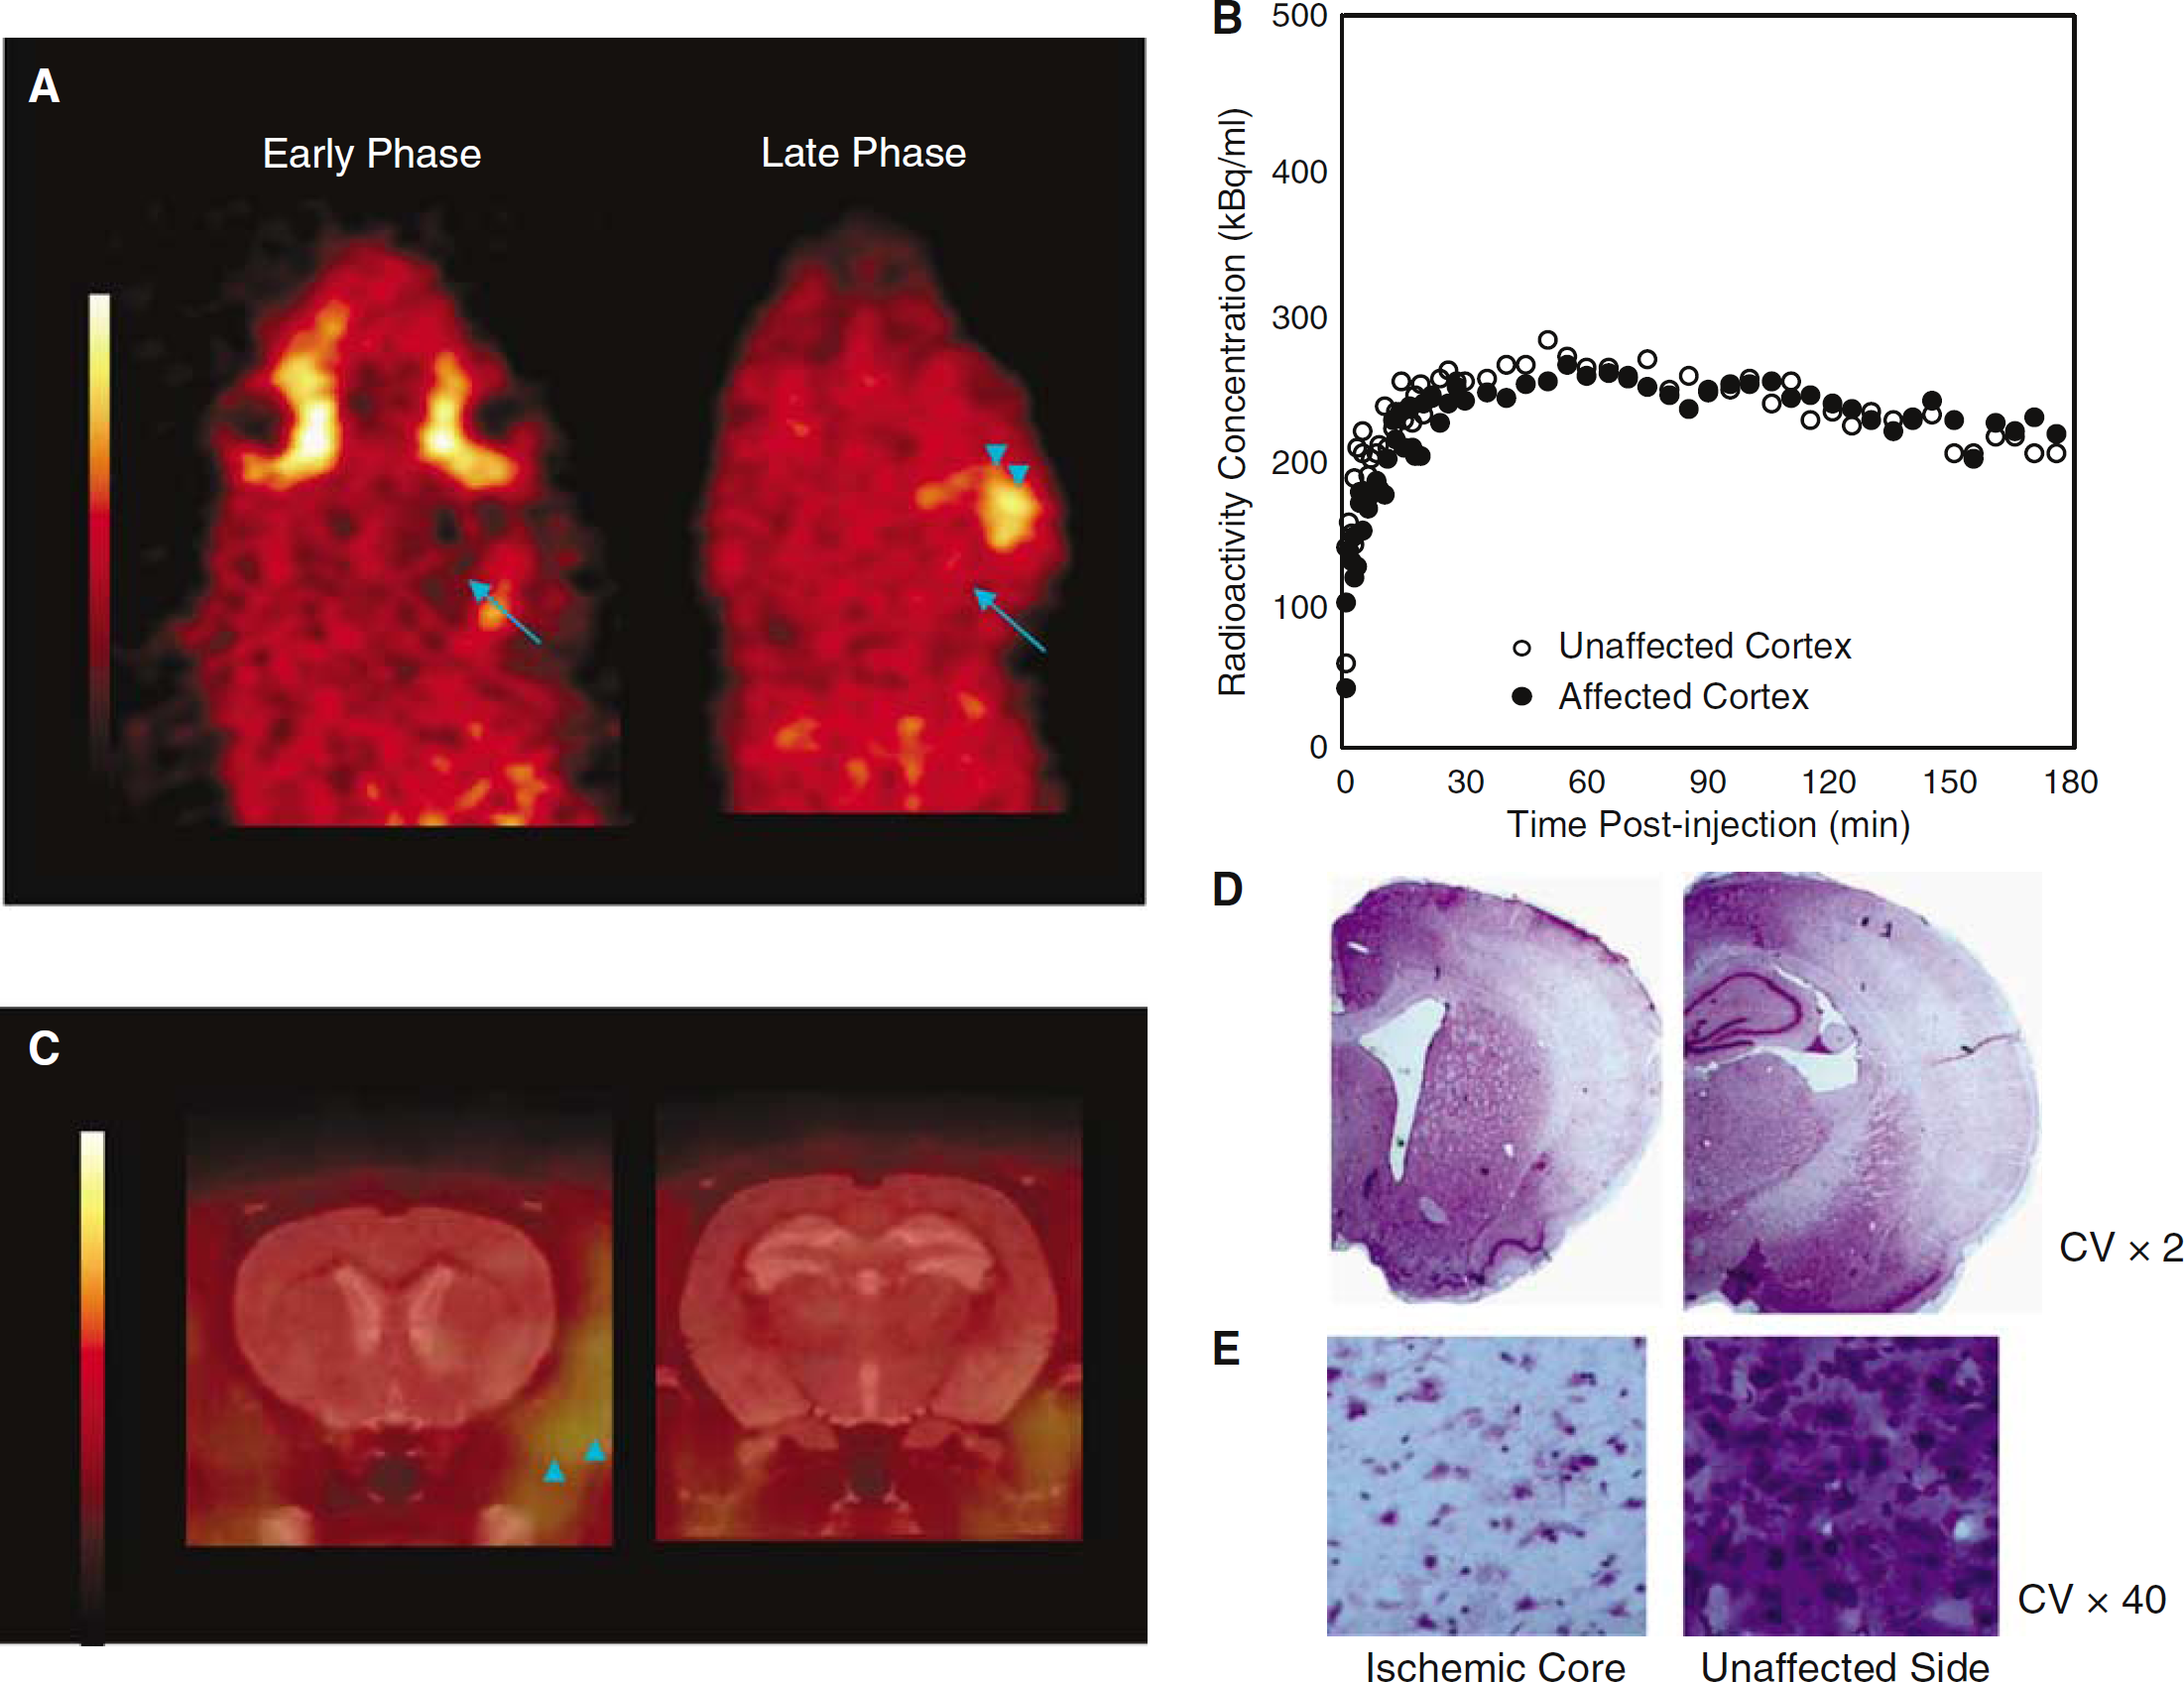
Positron emission tomography data and histology in one 120-minute temporary MCAo rat (rat #6). The same layout as in Figure 2. (
In the 45 mins MCAo rat (#5), no significant tracer retention was detected in the affected MCA territory (Figures 4A and 4C). However, there was some tracer accumulation in the surgically damaged temporalis muscle (Figure 4A). The TACs (Figure 4B) showed slightly lower initial uptake in the affected as compared with unaffected side (early AR = 0.88), but subsequently the tracer kinetics became virtually identical in both hemispheres (late AR = 1.08). Kinetic analysis showed slightly reduced K1 in the affected cortex, but essentially symmetrical Ki values (Table 2). Histopathology revealed no clear area of infarction (Figure 4D), but early ischemic changes such as irregular shape and triangulation of neurons (Figure 4E).
The findings in the 120-minute MCAo rats are illustrated for Rat #6 in Figure 5. Again no significant 18F-FMISO brain trapping was shown (Figures 5A and 5C), but there was some tracer retention in the temporalis muscle (Figure 5A). The TACs were similar to those obtained for the 45-minutes MCAo rat (Figure 5B and Table 2; early AR = 0.79, late AR = 1.03). Histopathology (Figure 5D) revealed severe ischemic changes with diffuse neural cell loss (Figure 5E). Rat #7 showed very similar results (Table 2).
The K1 and Ki values (Table 2) were essentially symmetrical in Rat #6 and slightly decreased in the affected cortex in Rat #7.
Discussion
This is the first study to investigate the use of 18F-FMISO PET in vivo to assess the hypoxic brain during and after MCAo in the small animal. The results show the expected trapping in the affected cortex early after MCAo, that is, when hypoxia is prominent, and the lack of demonstrable trapping both when ischemic necrosis has fully developed 48 h after permanent MCAo, and when tissue is not necrotic and has been reperfused after brief MCAo, that is, when hypoxia is not expected on pathophysiologic grounds.
Although a small sample of animals could be investigated in this study, these were complex experiments and their results were clear. Furthermore, this is the first study to report 18F-FMISO tissue kinetics after stroke either in human or the animal, providing much-awaited information relative to previous work where late ARs only have been reported (Read et al, 1998, 2000; Markus et al, 2004; Saita et al, 2004). Finally, because of the slow kinetics of 18F-FMISO (see below), it was not possible to assess hypoxic trapping during temporary MCA occlusion.
Findings in Normal Rats
This is the first study to show the 18F-FMISO kinetics in blood and brain in the normal rat (Figure 1). In the brain, the TACs peaked around 30 mins after injection, followed by a gradual decline. These brain kinetics are similar to, although faster than, normal human data, which show a gradual increase until 60 to 90 mins after intravenous injection (Valk et al, 1992; Bruehlmeier et al, 2004). In addition, we show here that the radioactivity in plasma and whole blood were very similar and their ratio did not significantly change over time (within 2 s.d.) (Figure 1B). These novel findings suggest that the distribution of 18F-FMISO is nearly equal in blood cells and plasma and is stable after tracer administration.
Findings in Permanent Middle Cerebral Artery Occlusion
In the rat with permanent MCAo, striking changes were obtained at the first PET session. There was reduced initial uptake in the affected area (early AR = 0.70; K1 ratio = 0.74), consistent with the expected reduced perfusion during occlusion. This was followed by continuous tracer accumulation in the affected area, quite distinct from the washout observed in the unaffected side and in normal rats, with an AR of 2.63 in the final 50 mins (Figure 2A). Accordingly, kinetic modelling showed a Ki > 8 times the mirror ROI value. These findings are clearly indicative of severe tissue hypoxia, which is entirely expected early after MCAo (Crockard et al, 1976; Liu et al, 2004). They are also consistent with 18F-FMISO human studies performed early after stroke (Read et al, 1998; Markus et al, 2004), and with the findings of Saita et al (2004), who reported high ex vivo 18F-FMISO uptake 2 h after tracer injection administered 0.5 and 1 h after onset of a 2-h thread-up temporary MCAo. However, the present study is the first to document in the living rat that this increased uptake during occlusion reflects abnormal dynamic trapping of 18F-FMISO.
In previous rat studies, the assessment of tracer trapping has been delayed at least 2 h (Saita et al, 2004) because of the slow brain kinetics and long equilibration time of 18F-FMISO (Bruehlmeier et al, 2004). This in principle precludes the use of 18F-FMISO to assess tissue hypoxia during MCAo of less than 3 h duration (taking into account the inevitable time needed to position the animal inside the scanner after clip placement, typically around 30 mins). However, the TACs (Figure 2B) suggest that it may be possible to assess 18F-FMISO trapping even before 2 h, which may have practical implications.
At the second PET session, performed 48 h after ictus, there was no evidence of 18F-FMISO trapping (Figure 2C). Despite mildly reduced perfusion, as suggested by decreased early uptake and K1, the tracer did adequately reach the affected tissue. Subsequently, the TACs in the affected and unaffected areas became superimposed until the end of scanning, that is, there was no demonstrable tracer trapping in the affected area, as also supported by the kinetic modelling. These novel findings from kinetic 18F-FMISO data are entirely consistent with human reports (Read et al, 1998) showing normalization of 18F-FMISO uptake at follow-up PET performed 6 to 11 days after stroke onset, while the latest observed high 18F-FMISO uptake was 47.5 h after onset (Markus et al, 2004). Histopathology of this rat obtained immediately after the second PET session revealed pannecrosis in the affected MCA area. Thus, complete infarction may induce a loss of the biochemical processes that underlie nitroimidazole binding in hypoxic conditions, principally the nitroreductase enzymes that reduce 18F-FMISO intracellularly (Nunn et al, 1995). An alternative, but not mutually exclusive, hypothesis is that there is normoxia in the necrotic tissue 2 days after stroke, because of wreckage of the respiratory chain processes with very little oxygen consumption.
Findings in Temporary Middle Cerebral Artery Occlusion
In this investigation, we administered 18F-FMISO within 40 mins after clip removal. There was no demonstrable tracer trapping in the affected cortex in any subject, despite differences in the degree of histologic damage. In the 45-minutes MCAo rat, there was reduced initial uptake, suggestive of moderate hypoperfusion, consistent with [14C]iodoantipyrine autoradiography results in independent spontaneous hypertensive rats subjected to the same model (JL Hughes et al, unpublished). There was also reduced initial uptake in the 120-minute MCAo rats. In all rats, however, tracer concentration later became identical between the affected and unaffected sides. These results are consistent with earlier studies showing normal or increased tissue pO2 early after reperfusion (Crockard et al, 1976; Liu et al, 2004). In the Saita et al (2004) study, 18F-FMISO was administered intravenously at various times after withdrawal of the occluding thread. These authors report persistent cortical 18F-FMISO retention up to 4 h after thread removal, and up to 20 h in the striatum. To explain these unexpected results, the authors proposed persistent tissue hypoxia despite MCA recanalization, because of, for example, periinfarct edema, small vessel occlusion, or the ‘no-reflow' phenomenon (del Zoppo and Mabuchi, 2003). Although CBF using, for example, laser Doppler could not be implemented in the present study because of the PET set up, early 18F-FMISO kinetics consistently documented adequate tracer delivery to the affected tissue, ruling out complete ‘no-reflow' even after 120-minute MCAo.
General Comments
The present study highlights two distinct mechanisms leading to lack of 18F-FMISO trapping after stroke, namely early reperfusion restoring tissue oxygenation, and subsequent tissue necrosis removing the cellular processes responsible for reduction and binding of the tracer, regardless of the oxygenation level. Our findings have clinical relevance as they probably explain why 50% of the patients studied with 18F-FMISO within 48 h of stroke onset by Markus et al (2004) did not exhibit high tracer uptake. It would obviously be of considerable interest to measure tissue pO2 directly in conjunction with 18F-FMISO PET to refine these notions.
Preliminary modelling of 18F-FMISO kinetics in normal and tumoric brain tissue has been reported (Bruehlmeier et al, 2004). However, the biochemical processes underlying 18F-FMISO trapping are complex (Casciari et al, 1995; Nunn et al, 1995; Thorwarth et al, 2005), suggesting accurate quantification of the 18F-FMISO trapping process in brain hypoxia might prove challenging. In this study, we used the irreversible two-tissue compartment model as a first approach. Our preliminary results are encouraging. Firstly, consistently good fitting was obtained (see Figure 3 for illustration), and secondly, the data were consistent with the simple asymmetry ratio method. There was, however, higher sensitivity of the modelling method to tracer trapping in hypoxic tissue, with an eight-fold increase in Ki as compared with an AR of 2.63 in the first session of the permanent MCAo rat; the results both for K1 and Ki for the other stroke studies were also consistent with the asymmetry ratios. However, these results should be considered preliminary pending development of a validated compartment model.
Some 18F-FMISO accumulation was also seen in the temporalis muscle early after MCAo (see Figures 2A, 4A and 5A, arrowheads). This muscle is transected during the surgical exposure of the MCA and is therefore potentially hypoxic acutely. Accumulation of 18F-FMISO in abnormal muscle has been reported in sarcoma of the extremities (Bentzen et al, 2003).
In conclusion, our results show trapping of 18F-FMISO in the stroke area only in the early phase of MCAo, but not when tissue necrosis has developed or if early reperfusion has occurred. These findings strongly support the validity of 18F-FMISO as a specific marker of the viable hypoxic brain/penumbra after stroke.