
Abstract
To date, functional 1H NMR spectroscopy has been utilized to report the time courses of few metabolites, primarily lactate. Benefiting from the sensitivity offered by ultra-high magnetic field (7 T), the concentrations of 17 metabolites were measured in the human visual cortex during two paradigms of visual stimulation lasting 5.3 and 10.6 mins. Significant concentration changes of approximately 0.2 μmol/g were observed for several metabolites: lactate increased by 23% ± 5% (P < 0.0005), glutamate increased by 3% ± 1% (P < 0.01), whereas aspartate decreased by 15% ± 6% (P < 0.05). Glucose concentration also manifested a tendency to decrease during activation periods. The lactate concentration reached the new steady-state level within the first minute of activation and came back to baseline only after the stimulus ended. The changes of the concentration of metabolites implied a rise in oxidative metabolism to a new steady-state level during activation and indicated that amino-acid homeostasis is affected by physiological stimulation, likely because of an increased flux through the malate—aspartate shuttle.
Introduction
Understanding the role of metabolites in the living, working brain is currently at the center of many considerations (Attwell and Laughlin, 2001; Aubert and Costalat, 2005). In vivo 1H NMR spectroscopy allows noninvasive quantification of brain metabolites and their changes during brain activation. Previous NMR studies of the activated human brain mainly focused on lactate (Lac) (reviewed in Mangia et al, 2006). Changes in Lac levels during sustained visual stimulation were reported for the first time by Prichard et al (1991), who detected on average a 60% increase in the primary visual cortex during the first several minutes of prolonged stimulation, followed by a decline toward the baseline that started during the stimulation. Sappey-Marinier et al (1992) measured up to 250% increase of Lac in the primary and associative visual cortex relative to the basal Lac level. A transient increase of Lac in the primary visual cortex was subsequently reported by Frahm et al (1996), who observed a 68% increase during the first half of 6 mins stimulation period, followed by a decrease to the basal level during ongoing stimulation. No evidence of Lac accumulation during prolonged visual stimulation were recently reported by Tuunanen et al (2006), who investigated the metabolic response in the human visual cortex in conditions of normoxia and hypoxia.
Increases in Lac have been tentatively proposed to reflect anaerobic metabolism (Prichard et al, 1991) after a hypothesis initially suggested by Fox et al (1988). Transient increases in Lac (Frahm et al, 1996) have been later suggested to support the astrocyte—neuron Lac shuttle (ANLS) hypothesis, introduced by Pellerin and Magistretti (1994). Nevertheless, given that in vivo 1H NMR spectroscopy cannot differentiate between cellular compartments, modeling of the involved metabolic pathways is needed to explain Lac changes in the context of the ANLS hypothesis. Aubert and Costalat (2005) developed a mathematical model that has the potential to accomplish this goal. However, when assuming an activation of both astrocytes and neurons under the ANLS hypothesis during the entire stimulation, Lac was found to constantly (and not only transiently) increase for the entire on-going stimulation period, in disagreement with the available experimental evidences regarding Lac time course during activation (Prichard et al, 1991; Frahm et al, 1996).
The accurate quantification of metabolite concentrations during functional paradigms is challenged by changes in signal linewidth. Indeed, the blood oxygenation level dependent (BOLD) effect alters the T2* of both water and metabolite signals (Zhu and Chen, 2001). This phenomenon results in a small narrowing 0.2 to 0.3 Hz at 4 T of all signals in the spectrum during brain activation, which is mostly discernible on the strongest singlets of the methyl group of N-acetylaspartate (2.01 p.p.m.) and of total creatine (3.03 p.p.m.).
Until now, observations of activation induced signal changes have been limited to a few metabolites. The increased sensitivity and spectral resolution of ultra-high magnetic fields (Gruetter et al, 1998a; Tkac et al, 2001) allowed the reliable quantification of multiple brain metabolites (Bartha et al, 2000; Tkac and Gruetter, 2005). Results from a previous pilot study (Mangia et al, 2006) have shown that changes in concentrations of NMR detectable metabolites induced by visual stimulation are very small, probably not larger than ± 0.2 μmol/g. The aim of the present study was to quantify the time courses of metabolite concentrations in the human visual cortex, using two paradigms of sustained visual stimulation and a large number of subjects.
Materials and methods
Measurements were performed on a 7 T/90 cm horizontal bore magnet (Magnex Scientific, UK) interfaced to Varian INOVA console. The system was equipped with a head gradient coil (40 mT/m, 500 μs rise-time) and strong custom designed second-order shim coils (shim strengths are reported in Tkac and Gruetter, 2005). A shielded quadrature transmit/receive half-volume radiofrequency (RF) coil consisting of two geometrically decoupled single-turn coils with a diameter of 12 cm was used to measure spectra from the occipital lobe. All first and second-order shim terms were automatically adjusted using FASTMAP with EPI readout (Gruetter and Tkac, 2000). In vivo 1H NMR spectra were acquired using ultra-short echo time STEAM (TE = 6 ms, TM = 32 ms, TR = 5 secs) as described previously (Tkac et al, 2001; Tkac and Gruetter, 2005).
Twelve healthy volunteers (age 19 to 26 years) gave informed consent according to the procedures approved by the Institutional Review Board and the FDA. Each subject was studied twice during different visual stimulation paradigms, which were projected on a mirror fixed to the RF coil. The stimulus consisted of a radial red/black checkerboard covering the entire visual field and flickering at a frequency of 8 Hz. A dark background was presented during rest periods. A small red cross in the center of the field of view was used as fixation point. To monitor the attention status throughout the whole session, subjects were instructed to press a button whenever the small cross in the fixation point randomly changed orientation.
Functional magnetic resonance imaging (FMRI) based on GE-BOLD contrast was used to guide the selection of the volume of interest (VOI = 20 × 22 × 20 mm3) in the activated region of the visual cortex. FMRI measurements were performed with the following acquisition parameters: single-shot gradient echo planar imaging (GRE-EPI), 16 sagittal slices, TE = 22 ms, spatial resolution = 2.5 × 2.5 × 2.5 mm3, TR = 2.5 secs; functional paradigm: 8 trials with 5 secs stimulation ON and 22.5 secs stimulation OFF. Activation maps were produced by calculating pixel-wise cross correlation coefficients between the hemodynamic reference waveform and the functional magnetic resonance imaging time series; only pixels with cross correlation coefficients ≥ 0.3 were considered activated and a cluster filter with cluster-size ≥ 6 contiguous pixels was applied. Functional maps were finally overlaid on sagittal anatomical images obtained using T1-weighted TurboFLASH sequence.
Two protocols of prolonged stimulation were designed. At the beginning of each session, 32 scans were acquired without stimulation. These data were later used as a baseline reference. The first paradigm consisted of four 5.3-mins periods (64 scans, TR = 5 secs) with the stimulation ON—OFF—ON—OFF. The second paradigm consisted of two 10.6-mins periods (128 scans, TR = 5 secs) with stimulation ON and OFF. The total duration of the functional session was 24 mins, which ensured reasonable stability, attention and comfort of the volunteers.
Data (FIDs) of each single scan were saved separately. Data processing included frequency and phase corrections of each single scan, FID summation in blocks, and removal of residual eddy currents using a reference water signal. FIDs acquired from each session were summed in blocks of 32 scans and a moving averaging (sliding offset = 8 scans) was performed to increase the nominal time resolution up to 40 secs in single subject studies. A time resolution of 20 secs, without introducing any moving averaging, was achieved by combining data from all 12 subjects (4 scans per each subject, resulting in averaged spectra of 48 scans).
LCModel analysis (Provencher, 1993) was used for metabolite quantification. The LCModel basis set included the simulated spectra of 21 metabolites and the spectrum of fast relaxing macromolecules experimentally measured from the human brain using an inversion-recovery experiment (TR = 2 secs, IR = 0.675 secs). Only metabolites quantified with Cramer Rao Lower Bounds (CRLB) < 30% were used for further analysis. The unsuppressed water signal measured from the same VOI was used as an internal reference for quantification assuming brain water content of 80%. Time courses of metabolites in moving averages were obtained for both functional paradigms in all single-subject studies, and averaged inter-subject trajectories of metabolites were calculated (inter-subject analysis). In addition, quantification of metabolites was performed at high temporal resolution, obtained by summing data from all subjects (group analysis).
Finally, a difference spectrum was generated using data from all subjects and both stimulation paradigms. Specifically, all FIDs acquired during the second half of the stimulation periods (1536 scans) and rest period (1536 scans) were summed accordingly and then subtracted. Exponential multiplication corresponding to 0.48 Hz line-broadening was applied to the summed FIDs acquired during stimulation to match the linewidth of both spectra before subtraction (the optimal value of line-broadening was found minimizing the residual signal of N-acetylaspartate in the difference spectrum). The resulting ‘BOLD-free’ difference spectrum was analyzed by LCModel with a basis set that allowed detection of positive as well as negative concentration changes.
Results
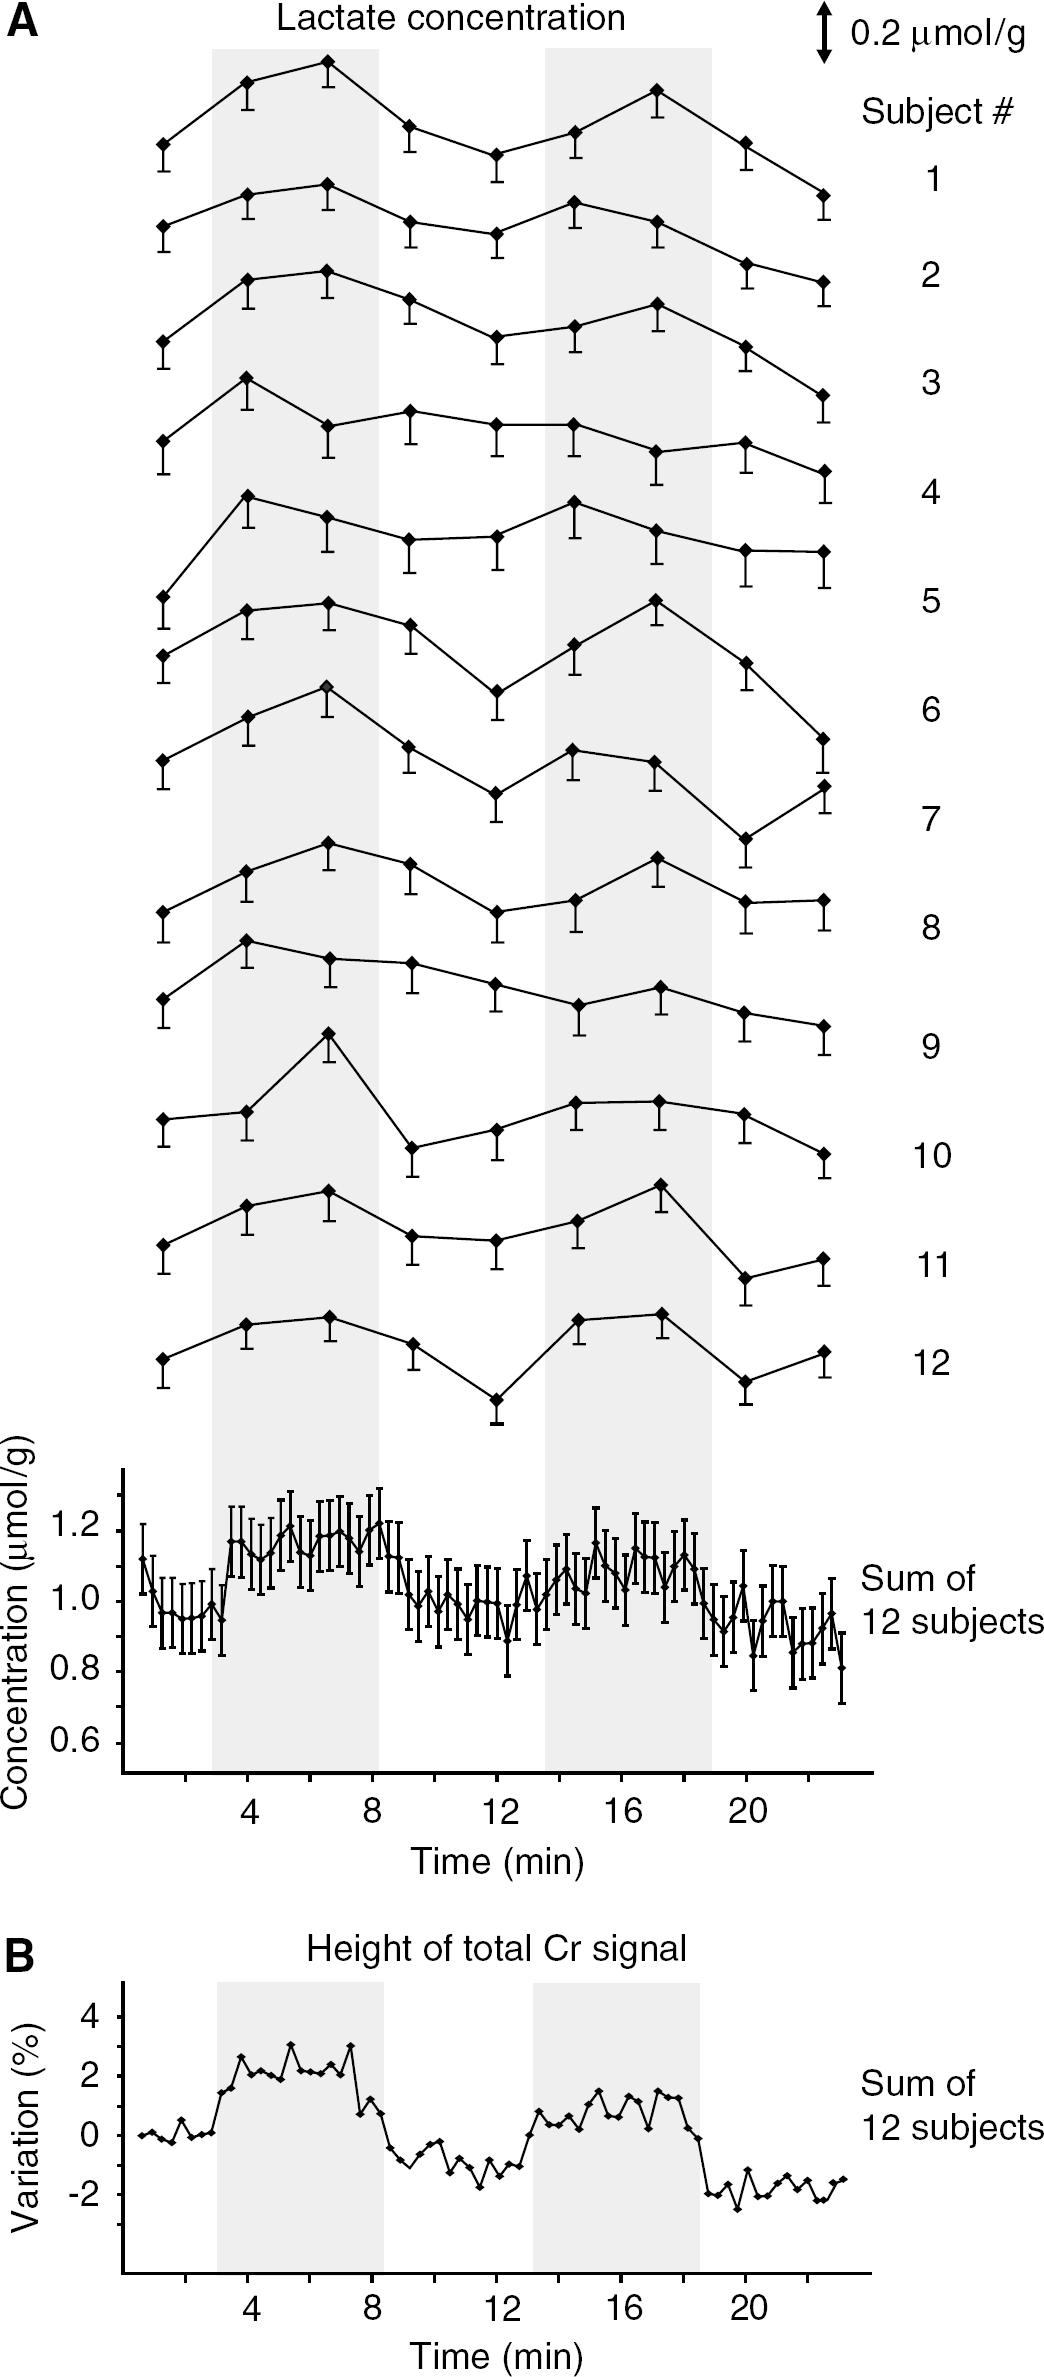
In vivo 1H NMR spectra acquired from the visual cortex during stimulation and rest periods (Figure 1) represent the quality that was routinely achieved throughout the whole study. Shimming resulted in water linewidths around 13 to 14 Hz with concomitant creatine linewidths of 11 to 12 Hz. Signal-to-noise ratio of N-acetylaspartate (acquisition time = 0.17 secs, FT) in single scan spectra was typically between 20 and 25. Acquired spectra were artifact free in the entire chemical shift range, and contamination by signals from extracerebral lipids was not detectable in spite of the very short echo time (TE = 6 ms). Spectra were highly reproducible within each session, between different sessions of the same subject as well as between subjects. The difference between spectra (average of 32 scans) obtained during stimulation and rest periods in single subject studies revealed only minimal residuals above the noise level (Figure 1). Narrow small signals (linewidth around 6 Hz) were discernible in the difference spectra at the positions of the strong singlet resonances of N-acetylaspartate (2.01 p.p.m.) and total creatine (3.03 p.p.m.), which were attributed to linewidth changes caused by the BOLD effect on metabolite resonances (Zhu and Chen, 2001; Mangia et al, 2006). In fact, an ~2% increase of the signal height of these resonances was observed during the entire duration of stimulation periods (as shown for total creative in Figure 2B), further confirming that the voxel was positioned in the activated visual cortex during the entire experimental session.
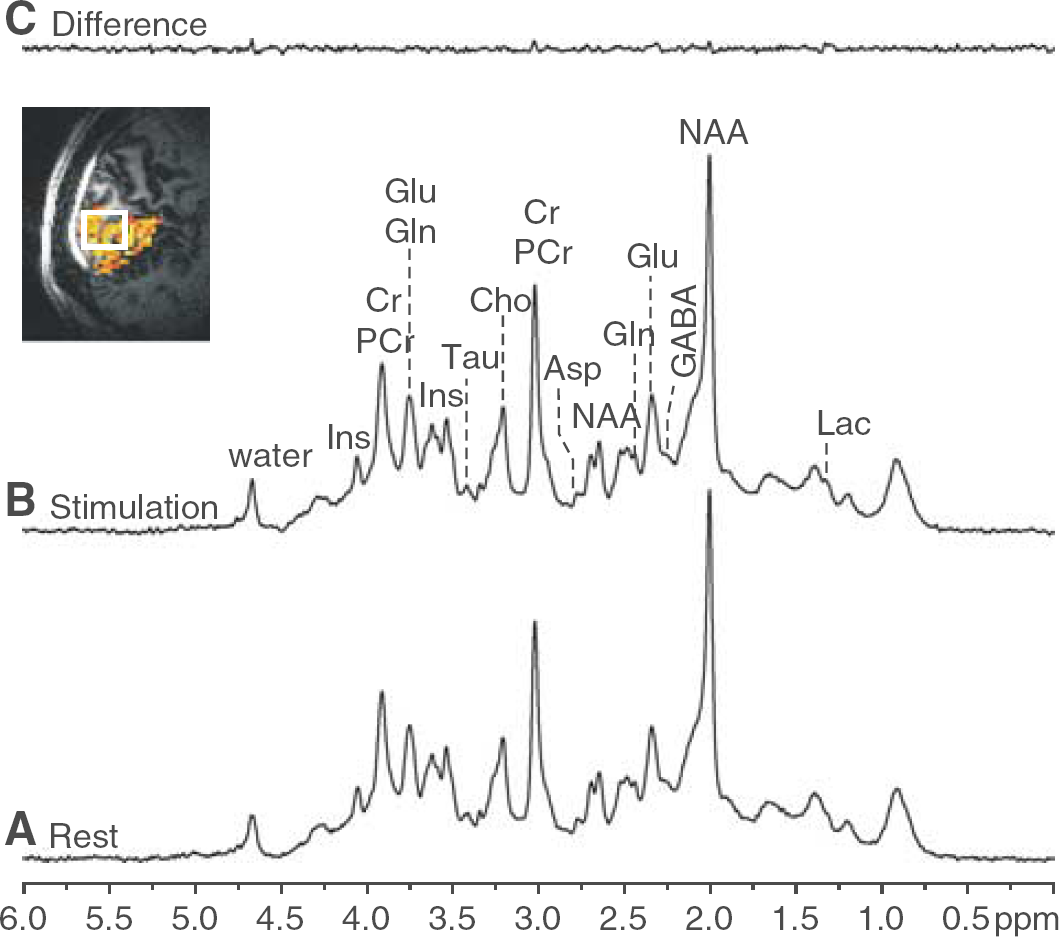
Representative 1H NMR spectra during the rest period (
(
Spectra obtained by averaging 32 scans allowed the determination of the concentrations of creatine (Cr), phosphocreatine, glutamate (Glu), glutamine, myo-inositol, Lac, N-acetylaspartate, N-acetylaspartylglutamate and choline quantified by LCModel with CRLB <10%; ascorbate, aspartate (Asp), γ-aminobutyric acid, glutathione, and taurine quantified with CRLB <20%; glucose (Glc), phosphorylethanolamine and scyllo-inositol quantified with CRLB < 30%. These values corresponded to CRLB below 0.2 μmol/g for most of the quantified metabolites. In particular, the average CRLB for Lac was 9%, which amounted to an estimated error of 0.1 μmol/g. These CRLB were comparable to those obtained when quantifying spectra averaged across subjects (group analysis, 48 scans).
Increases in Lac concentration were detectable in most subjects (Figure 2A). The group analysis with high temporal resolution revealed that Lac increased by ~0.2 μmol/g within the first minute of activation, reached a new steady state, and returned to baseline only after the end of the stimulation period (Figure 2A, lower trace). The inter-subject analysis of all metabolite trajectories showed that concentration changes between stimulation and followed resting periods were observed not only for Lac (+23% ± 5%, P < 0.0005), but also for Glu (+3% ± 1%, P < 0.01) and Asp (–15% ± 6%, P < 0.05), as shown in Figure 3A. Glu exhibited a delayed response compared with Lac and manifested a general tendency of decreasing over time. Changes in Asp were opposite to those of Glu, Asp indeed decreased during stimulation periods and increased during resting periods. The concentration of Glc manifested a tendency to continuously decrease over time for the entire duration of the stimulus, without reaching a new steady state, and returned to baseline after the end of stimulation (Glc decreased by 12% ± 7%, but did not reach statistical significance because of higher CRLB) (Figure 3A). Changes in concentrations of these four metabolites were approximately 0.2 μmol/g.
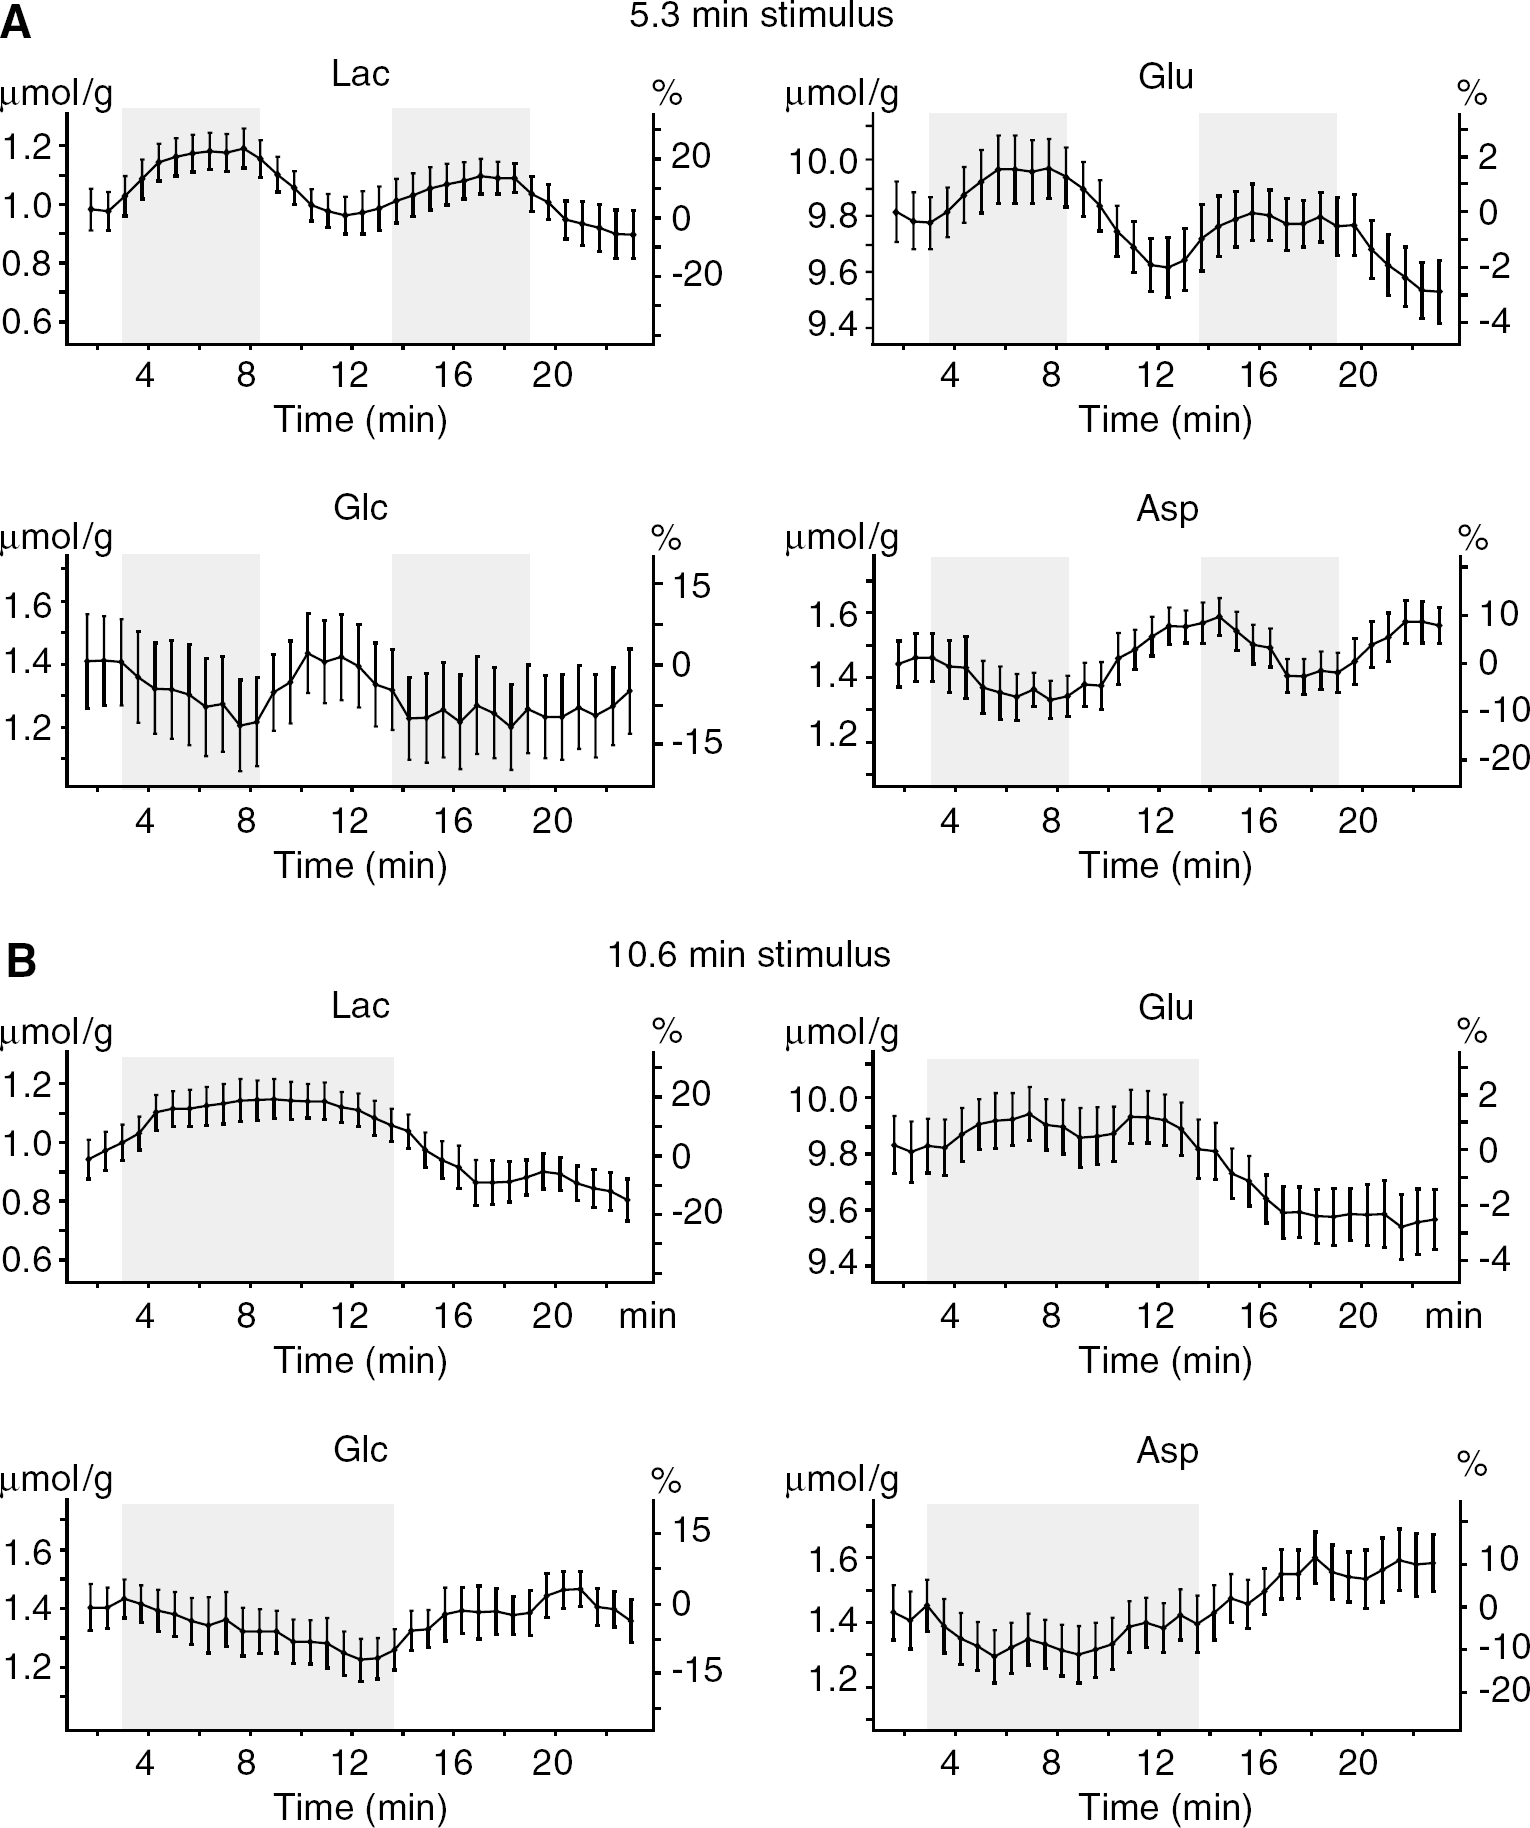
Time courses of selected metabolites during paradigms of prolonged visual stimulations, lasting 5.3 mins (
Time courses of metabolite changes observed with the 10.6-mins stimulation paradigm were consistent with those observed with the 5.3-mins stimulation (Figure 3): during the stimulation period concentrations of Lac and Glu reached new steady-state levels, which remained unchanged until the end of the stimulation period.
Based on the estimated errors in LCModel quantification and overall spectra stability and reproducibility, it was possible to obtain the difference spectrum between the stimulation and the rest spectra averaged across all studies (Figure 4). The peaks in this difference spectrum (Figure 4C) were attributed to concentration changes of metabolites as well as to linewidth changes ascribed to the BOLD effect. The effects of linewidth changes were minimized by applying appropriate line-broadening to the stimulation spectrum before subtraction (Figure 4D). LCModel quantification of the remaining signals of this linewidth-matched difference spectrum (Figure 4E—L) provided concentration changes of Lac, Glu, Asp, and Glc between stimulation and rest periods (Table 1). In relative terms, these concentration changes were in excellent agreement with those estimated by the inter-subject analysis of metabolite time courses (see above). It is of interest to note that no major signals above the noise level are present in the fit residual (Figure 4L), which rules out substantial changes of the other metabolites.
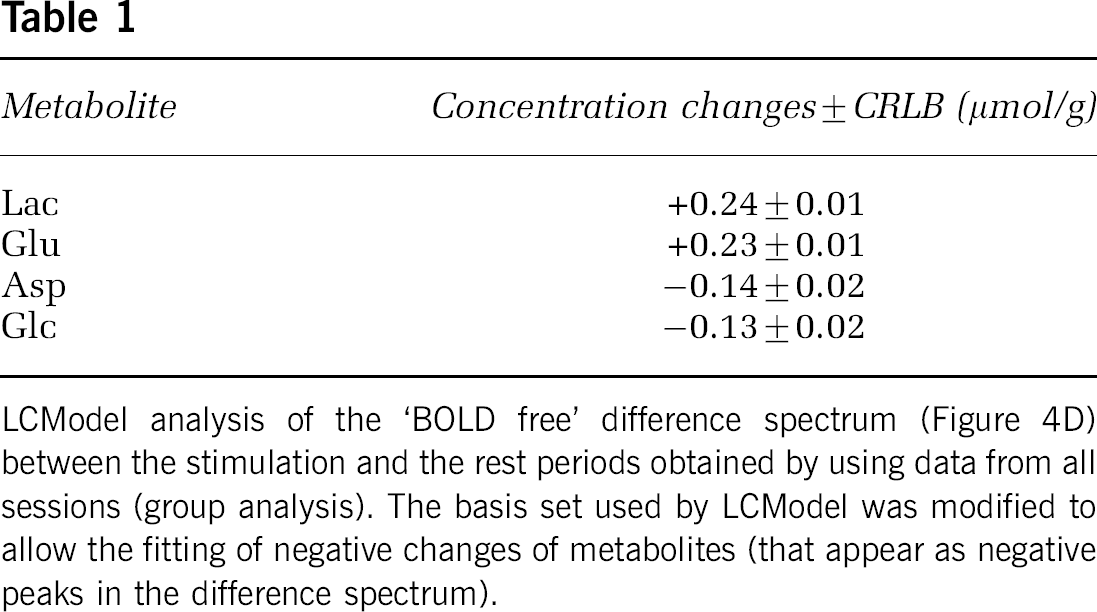
LCModel analysis of the ‘BOLD free’ difference spectrum (Figure 4D) between the stimulation and the rest periods obtained by using data from all sessions (group analysis). The basis set used by LCModel was modified to allow the fitting of negative changes of metabolites (that appear as negative peaks in the difference spectrum).
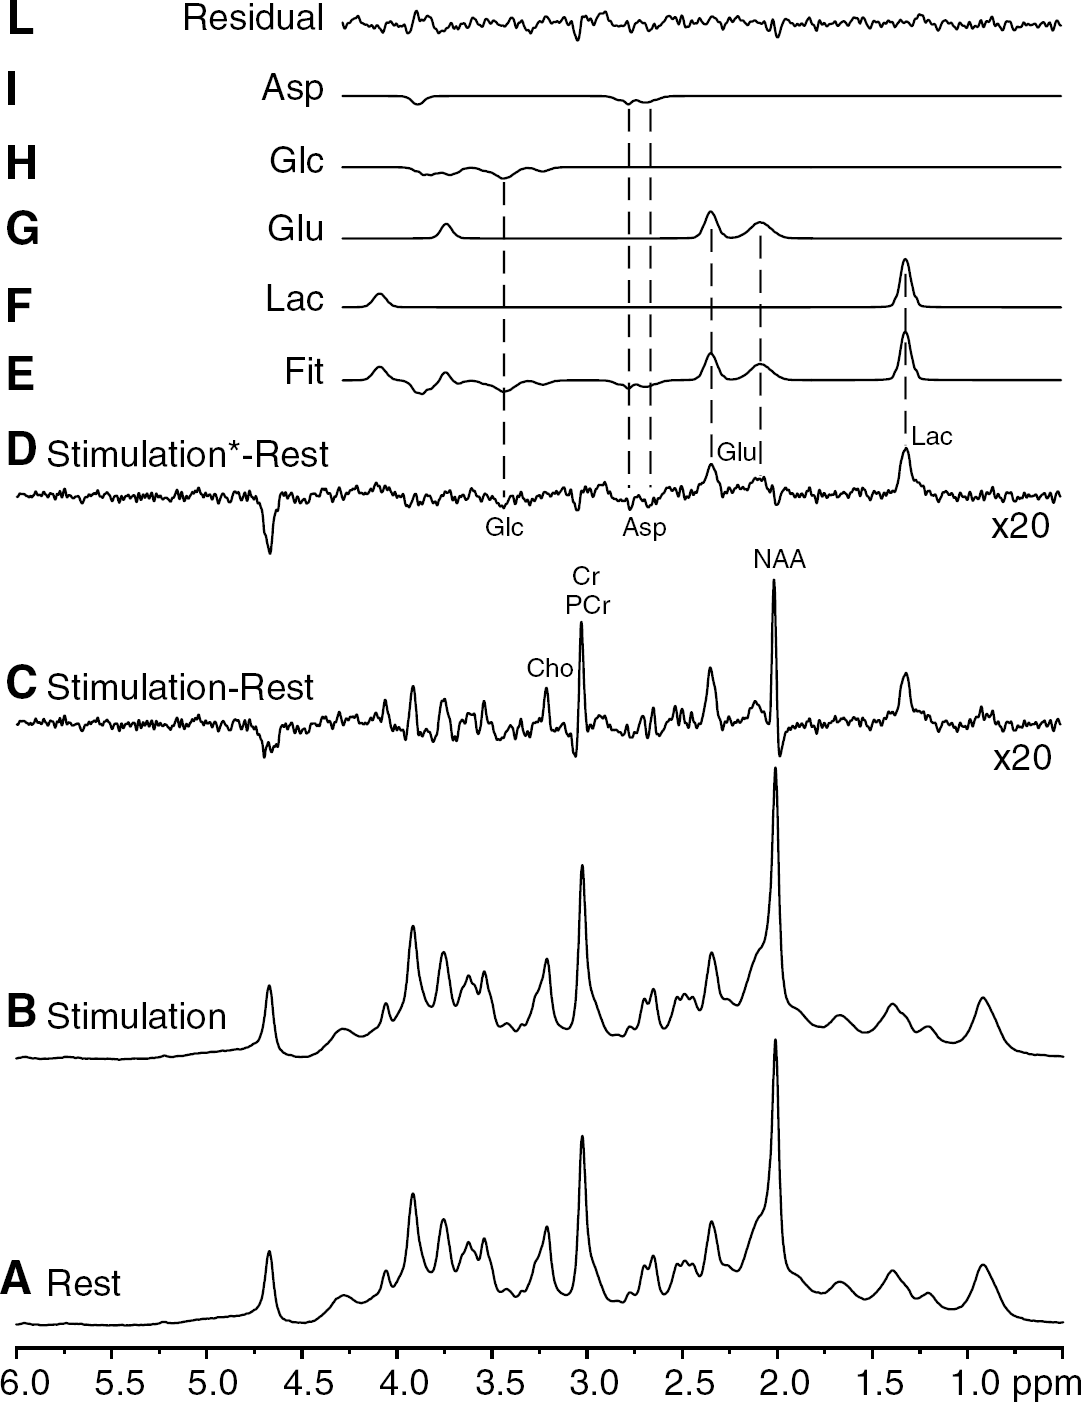
Analysis of difference spectra between stimulation and rest periods, using data from all subjects and both paradigms. (
Discussion
The reliable quantification of metabolite concentrations during functional experiments is very demanding. Exceptional sensitivity (S/N = 20 to 25 of NAA resonance in single scan spectra) was achieved in this study by using ultra-high magnetic field (7 T) and a half-volume RF coil with increased local sensitivity in the visual cortex. High inter-subject reproducibility was facilitated by fully automatic shimming and parameter adjustment. Small fluctuations in frequency and phase of signals resulting from the physiological motion were eliminated by the post-processing of the single-scan data. Excellent localization performance of the pulse sequence and water suppression enabled the reliable detection of metabolite signals in the whole chemical shift range (Figure 1). In addition, the ultra-short TE and long TR used in STEAM localization sequence minimized T1 and T2 relaxation effects on the quantification. It is worth noting that different Lac changes reported in previous studies during prolonged visual stimulation could result from relaxation effects when long TW was used (Prichard et al, 1991; Sappey-Marinier et al, 1992). Changes of Lac signal intensity at long TE may correspond predominantly to Lac changes in the extracellular space and/or changes in its relaxation properties, rather than to changes in the total concentration of Lac as revealed by ultra-short TE experiments. This idea is supported by several experimental evidences, which suggested approximately uniform distribution of Lac between intra- and extracellular space (Pfeuffer et al, 2000), relatively slow exchange rate of Lac (compared with NMR time scale) between intra- and extracellular compartments (Hertz and Dienel, 2005), and different relaxation properties of intra- and extracellular Lac (Jouvensal et al, 1999).
High spectral resolution, sensitivity, and reproducibility of 1H NMR spectra (Figures 1 and 4) resulted in unprecedented sensitivity to detect time courses of 17 brain metabolites during visual stimulation. The observed concentration changes of Lac (Figures 2 and 3), Glu, Asp, and Glc (Figure 3) were approximately 0.2 μmol/g, which corresponded to approximately 20% concentration change in Lac, but only 3% in Glu. LCModel quantification (Table 1) of the difference spectrum shown in Figure 4D confirmed that the detected concentration changes between stimulation and resting periods did not result from artifacts related to linewidth changes induced by the BOLD effect.
The trajectory of Lac with high temporal resolution (Figure 2A, lower trace) revealed that Lac increased by ~0.2 μmol/g from the resting level to a new steady-state level within the first minute of the stimulation period. The steady-state concentration of Lac remained elevated until the end of the stimulation in studies with 5.3-mins as well as with 10.6-mins stimulation periods (Figure 3A and 3B). Lac reached a new steady-state concentration slower than the BOLD effect on the signal of total Cr (Figure 2B).
The observed small increase in steady-state Lac concentration implies a predominantly oxidative source of energy that fuels activated brain cells, for the following reasons. First of all, it is well known that activation leads to hyperoxygenation in blood, thus the Lac increase is unlikely to reflect anaerobic glycolysis. However, it is in principle possible that the cellular oxygen tension could become insufficient to sustain respiration. In this case, the increased oxygen concentration gradient between blood (increased) and brain cells (decreased) would unavoidably imply significantly increased net oxygen consumption, since Fick's law applies to the freely diffusible oxygen. In fact, oxidative metabolism has been reported to increase during activation in several human studies (Katayama et al, 1986; Marrett and Gjedde, 1997; Kim et al, 1999; Hoge et al, 1999, 2006; Gjedde and Marrett, 2001). Secondly, the increase in the steady-state concentration of Lac implies an increase in pyruvate (Pyr), based on the dynamic equilibrium between the steady-state concentrations of Lac and Pyr (for a given cytosolic redox potential and pH). A rise of Pyr has been suggested to occur with an increased flux into the oxidative pathway (Gjedde and Marrett, 2001; Dienel and Cruz, 2003). Therefore, assuming pseudo first-order rate kinetics, the ~20% Lac increase implies an ~20% increase in oxygen metabolism, which is in excellent agreement with reported changes in oxygen consumption (ΔCMRO2) of 20% ± 13% (average value from Shulman et al, 2001). Thirdly, the steady-state concentration of Lac can be affected by the cytosolic redox potential, because of the near equilibrium relationship between cytosolic NADH/NAD+ and the Lac/Pyr ratios. However, with an estimated equilibrium constant of the lactate-dehydrogenase system of K = 1.1 × 10⁻⁴ (pH = 7.0, T = 38°C, Williamson et al, 1967), a Lac/Pyr ratio in the human brain of ~20 (Gjedde and Marrett, 2001), and taking into account mass balance between Pyr and Lac, a 100% increase in NADH should increase Lac not more than ~3%. It is of interest to note that the increase in total NADH reported in activated hippocampal slices, without distinguishing between cytosolic and mitochondrial NADH, was on the order of a few percent (Kasischke et al, 2004). Fourthly, because of the permeability of the blood—brain barrier (BBB) to Lac, the increased brain Lac concentration (Δ[Lac] = 0.2 μmol/g) during stimulation may result in a net Lac efflux, considering that the plasma Lac concentration is unlikely to change (a dilution effect is expected to occur because of the small volume of the activated visual cortex compared with the total blood volume in the body). Assuming a brain Lac concentration of 1 μmol/g, a pseudo first-order rate constant kLac = 0.09 min−1 can be estimated from the reported exchange rate of 0.09 μmol/g/min (Knudsen et al, 1991). The maximal Lac efflux is thus kLac*μmol/g/min, which corresponds to 8% of the increased Pyr derived from Glc. This estimate is based on a basal Glc consumption (CMRglc) of 0.4 μmol/g/min (Gruetter et al, 2001 and references therein) and an increase of CMRglc (ΔCMRglc) of ~30% during visual stimulation (Marrett and Gjedde, 1997; Newberg et al, 2005). An export of Lac corresponding to ~8% of ΔCMRglc implies that ~99% of the increased ATP synthesis during activation is powered by oxidative processes, given the much higher efficiency of the TCA cycle and electron transport chain (~30 ATP) compared with anaerobic glycolysis (2 ATP). Even when assuming that all Pyr not converted to Lac is used in anaplerotic reactions (Oz et al, 2004), providing ~10 ATP, this calculation results in more than 97% of ATP synthesis increase being through oxidative processes. While the above considerations emphasize the predominantly oxidative fate of Glc during activation (whether in astrocytes or neurons), such a Lac efflux is consistent with a drop of the oxygen to glucose index (OGI) from 5.5 to 5.1 (Shulman et al, 2001).
It is worth noting to remind that our data about Lac cannot either support or disproof the ANLS hypothesis (Pellerin and Magistretti, 1994) because of the inability of in vivo 1H NMR spectroscopy to differentiate the contributions of the neuronal and astrocytic compartments. However, the mathematical formulation of the ANLS hypothesis (Aubert and Costalat, 2005) fails in predicting the Lac time course observed in the present study. This implies that either the ANLS hypothesis or its mathematical modeling needs revisions. Finally, a previous study by Mangia et al (2003a) reported an initial decrease of Lac 5 secs after a short visual stimulus of 1 sec, followed by a return to a baseline within 12 secs. That finding was also interpreted as a consequence of upregulated oxidative metabolism (Mangia et al, 2003b). The present work cannot provide any information about the time course of Lac within the first 20 secs of activation; therefore, the findings of these two studies cannot be related to each other. Nonetheless, both an early dip of Lac and a subsequent sustained Lac increase may occur during prolonged stimulations in a context of upregulated oxidative metabolism without any conceptual contradictions. The scenario of metabolic events we suggested above, in fact, refers to steady-state conditions and does not necessarily apply to the early transient phase of activation, where the different initial conditions of the involved physiological parameters could lead to different outcomes.
Whereas Lac rose rapidly, Glc concentration showed a gradual decrease trend (~0.04 μmol/g min) during sustained stimulations (Figure 3), without reaching a new steady state, in good agreement with previously published results (Frahm et al, 1996). The maximum rate of Glc decrease is theoretically given by the difference between Glc utilization under stimulation and rest, ΔCMRglc. Taking into account that CMRglc = 0.4 μmol/gmin (Gruetter et al, 2001 and references therein) in basal condition and assuming an increase by ~30% during visual stimulation (Marrett and Gjedde, 1997; Newberg et al, 2005), brain Glc concentration cannot decrease faster than ~0.1 μmol/g min, which was consistent with our data. Reversibility of Glc transport (Gruetter et al, 1998b) through the blood—brain barrier suggests that the rate of approaching the new steady state of the brain Glc concentration depends on the rate constant of the reverse Glc transport from the brain to plasma. Decrease in brain Glc concentration slows down the reverse transport until new steady state is reached, where Glc net influx through blood—brain barrier is equal to CMRglc. Constant Glc steady-state concentration was not observed in this study, which can be explained by the insufficient duration of the stimulation epoch or by insufficient sensitivity of the measurement to determine the Glc trajectory more precisely.
Concentration changes of Glu (increase by 3% ± 1%) and Asp (decrease by 15% ± 6%) were observed in this study (Figure 3). Similar changes (6% increase in Glu, 18% decrease in Asp) have been reported during sensory stimulation of conscious rats using brain extraction techniques (Dienel et al, 2002), but to the best of our knowledge have not been reported in the functional studies of humans. Opposite changes in Glu and Asp indicate that those variations might be linked to the transamination reaction between Glu and Asp, a critical step in the malate—aspartate shuttle (MAS) (McKenna et al, 2006). Increase in CMRglc requires increased flux through the MAS to maintain the cytosolic redox potential NADH/NAD+ by recycling NADH generated by glycolysis (Figure 5). Since most of the tissue Glu is in the cytosol, the increased Glu concentration (together with a similar decrease in Asp) is consistent with an increased flux through the MAS and the fact that the Glu—Asp antiporter at the inner mitochondrial membrane is rate limiting (LaNoue and Tischler, 1974). An increased flux through the MAS implies an increase in oxidative metabolism. Our results indicate that both Glu and Asp overshoot their resting steady-state values after the end of stimulation (Figure 3). This observation may be linked with a delayed decrease in oxidative metabolism after the end of the stimulation, which was proposed to explain the poststimulus BOLD under-shoot in functional magnetic resonance imaging studies based on oxygen electrode measurements and some optical studies (reviewed in Yacoub et al, 2006).
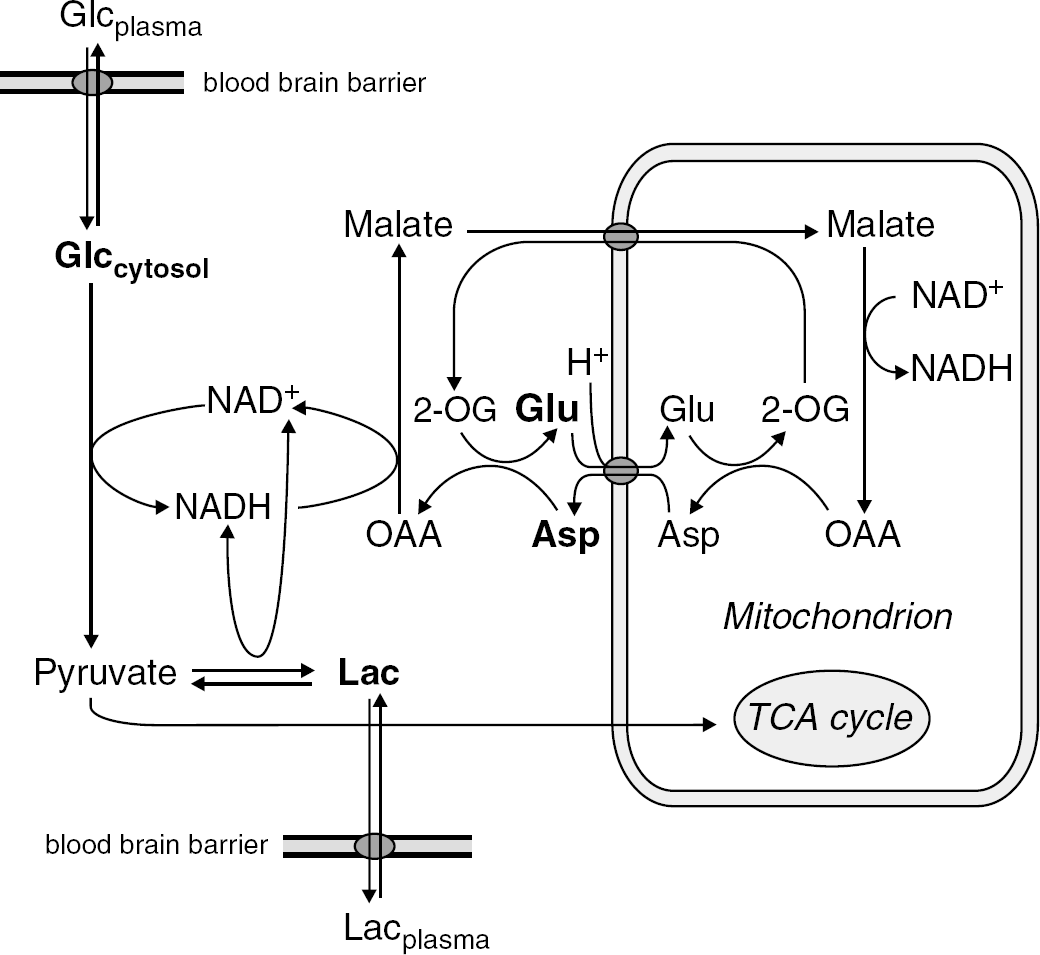
Proposed scheme of cerebral metabolism during activation. A constant decrease of Glc is compatible with elevated CMRglc during activation, while a slight augment of the steady-state level of Lac might result from an increased rate of glycolysis and TCA cycle that is accompanied by an increase of the steady-state level of Pyr. Also a net Lac efflux has to be taken into account if plasma and brain Lac concentrations are different. The observed time courses of Glu and Asp could reflect an increased flux through the MAS that has to replenish the cytosolic NAD+ consumed by glycolysis. No compartmentation between neurons and astrocytes is considered. Metabolites measured with 1H NMR spectroscopy are emphasized in bold (note that Glu and Asp are known to be present mainly in the cytosol).
Conclusions
We conclude that, at ultra-high magnetic field, minute changes in the neurochemical profile of the primary visual cortex can be quantified during sustained visual stimulation with high sensitivity and reliability. The observed changes of Lac, Glu, Asp, and Glc concentrations support the hypothesis that sustained neuronal activation raises oxidative metabolism to a new steady state. In addition, opposite changes of Asp and Glu concentrations implicate increased flux through the MAS to maintain the cytosolic redox potential. We further conclude that more than 97% of the increased ATP synthesis during visual stimulation is powered by oxygen-dependent processes.