
Abstract
Arterial spin labeling (ASL) magnetically inverts or saturates the spins in arterial blood and uses them as endogenous tracers. Conventionally, the tagging band is upstream or nonselective to the target slices. In the brain, ASL-based functional magnetic resonance imaging (fMRI) has been shown to detect activation better localized in gray matter than blood oxygenation level dependent contrast. More recently, velocity selective-ASL (VS-ASL) was proposed to tag spins according to their flow velocity. One desirable characteristic of VS-ASL is its capability to generate tags sufficiently close to the target slices and thereby circumvent the complication of non-zero transit delay. In this study, we investigate the feasibility of VS-ASL in fMRI by comparing it with a conventional ASL method (PICORE). The results from the visual cortex of healthy volunteers show that VS-ASL and PICORE have comparable spatial specificity in detecting the flow change induced by neuronal activity. Velocity selective-arterial spin labeling can further distinguish the contribution from different flow directions but spurious elevation of fractional signal change may occur when the VS tagging is applied off the direction of blood supply. The flow reaches the vicinity of perfusion at a cutoff velocity (Vc) of 2 cm/sec whereas the activation exclusively detected by Vc = 4 cm/sec implies the arteriolar response to the neuronal activity and a respondent vessel diameter up to 240 μm. Velocity selective imaging can remove intravascular signal from the vessels where the flow velocity is above Vc.
Introduction
In the brain, blood oxygenation level dependent contrast is a composite output of activation-induced changes in cerebral oxygen consumption (CMRO2), blood flow (CBF) and blood volume (CBV) (Bandettini et al, 1992; Kwong et al, 1992; Ogawa et al, 1992). As the most commonly used mechanism in functional magnetic resonance imaging (fMRI) studies, blood oxygenation level dependent provides satisfactory contrast-to-noise ratio, yet also includes signals from draining veins that are far off the location where neuronal activity actually takes place. By contrast, perfusion-based fMRI takes advantage of the noninvasiveness and high temporal resolution of arterial spin labeling (ASL) to measure blood flow change directly. It has been reported that the activation area detected by ASL is more localized in gray matter as compared with blood oxygenation level dependent contrast (Luh et al, 2000).
Arterial spin labeling techniques magnetically invert or saturate the spins in arterial blood and use them as endogenous tracers (Detre et al, 1992; Edelman et al, 1994; Kim, 1995; Kwong et al, 1995; Alsop and Detre, 1996; Ye et al, 1996; Wong et al, 1997). After an inflow time (TI) to allow the tagged blood to travel from the tagging region to the imaging planes, a ‘tag' image is acquired. Afterward, a ‘control' image is acquired by repeating the experiment in the absence of tagging. The difference between tag and control images, therefore, reflects the local perfusion. Conventionally, the tagging band is upstream or nonselective to the target slices. In these spatially defined tagging schemes, transit delay (Δt) is one of the principal error sources (Alsop and Detre, 1996; Ye et al, 1997) and the variation can be hundreds of millisecond across one single slice (Wong et al, 1998). Although solutions have been proposed to control this factor (Alsop and Detre, 1996; Wong et al, 1998), the Δt elongation accompanying diseases such as ischemic stroke (Neumann-Haefelin et al, 1999) can considerably reduce contrast-to-noise ratio and lead to unsatisfactory results.
More recently, velocity selective-ASL (VS-ASL) was proposed to tag spins according to their flow velocity rather than spatial distribution (Norris and Schwartzbauer, 1999; Wong et al, 2002; Duhamel et al, 2003). One desirable characteristic of VS-ASL is its capability to generate tags sufficiently close to the slice of interest with Δt = 0, which makes it a promising candidate in multislice or volume imaging. The feasibility of VS-ASL has been demonstrated in baseline CBF measurement (Wu and Wong, 2006; Wong et al, 2006) but not in fMRI study yet. In the present study, we compared VS-ASL with a conventional ASL method (proximal inversion with a control for off-resonance effects (PICORE)) in the detection of the flow change induced by neuronal activity. Technical considerations and physiologic implications were then addressed. Attempts were made to investigate the feasibility of VS-ASL in fMRI.
Materials and methods
PICORE QUIPSS II and VS-ASL
Proximal inversion with a control for off-resonance effects (PICORE) (Wong et al, 1997) is a pulsed ASL method and uses a single inversion pulse (TI before image acquisition) for tagging. For the control image, the same RF inversion pulse is applied as in the tag image except the field gradients are switched off and the frequency of the RF pulse is shifted so that the plane to be imaged experiences the same off-resonance RF pulse in both control and tag images. Quantitative imaging of perfusion with a single subtraction, version II, (QUIPSS II) (Wong et al, 1998) defines the temporal width of the bolus of tags by inserting a 90° saturation pulse that is TIsat after the tagging pulse (TIsat < TI) to hit the same tagging band as the inversion pulse.
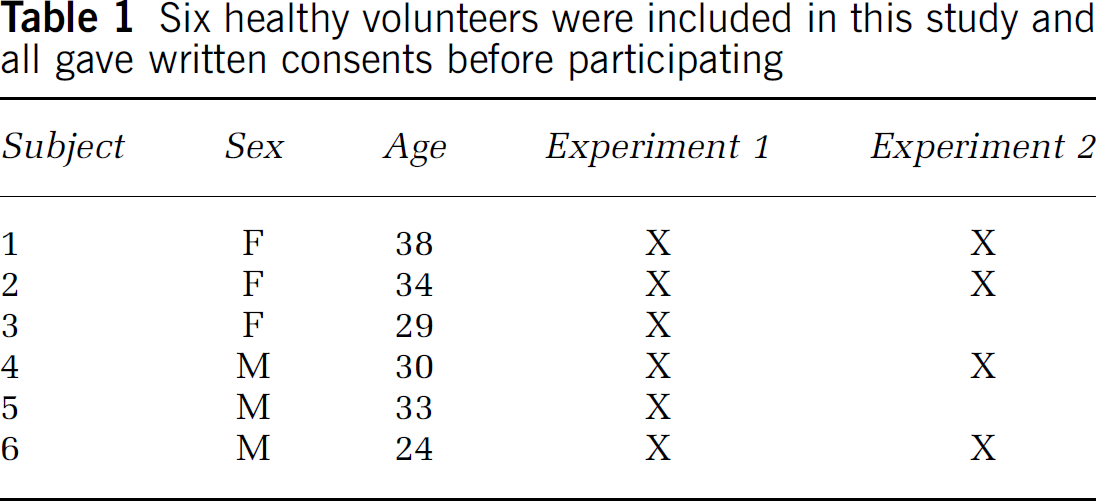
In VS-ASL, a pulse train that consists of nonselective 90°–180°–90° RF pulses and bipolar flow-sensitive gradients is used to generate a sinc modulation of the longitudinal magnetization versus the flow velocity in laminar flow. After a delay TI allowing for the delivery of tags, images are acquired using a spin echo sequence that has flow weighting gradients adjusted to the same flow moment and direction as the tag pulse. As shown in Figure 1, the first zero crossing at the positive velocity axis is used as the cutoff velocity (Vc) that defines the velocity range to be tagged (> Vc) and imaged (< Vc). Velocity is a function of the amplitude (G), duration (Δ), and separation (Δ) of the gradient lobes (Wong et al, 2002; Duhamel et al, 2003):

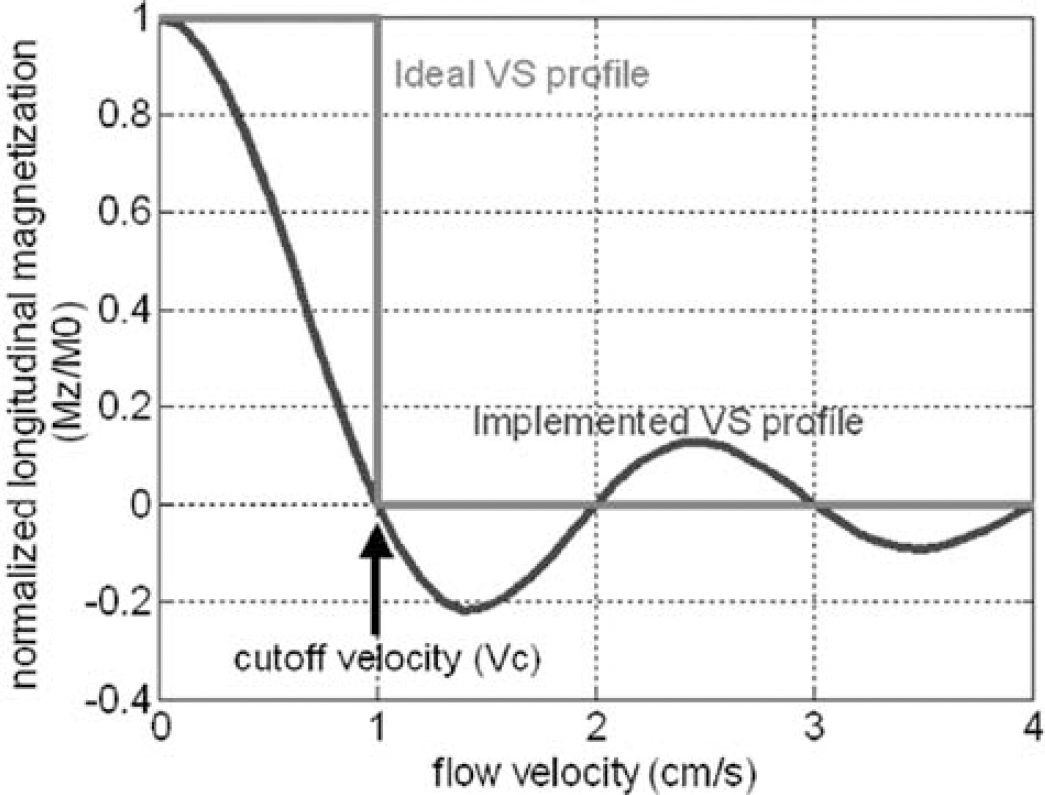
VS selectivity profile. The VS pulse train modulates the longitudinal magnetization to a sinc function of flow velocity. The sinc function is used to approximate the ideal rectangular selectivity.
In this study, we adopted the modified VS pulse train proposed by Wong et al (2006), in which the 1801 hard pulse was replaced by a pair of identical 180° hyperbolic secant pulses to minimize its sensitivity to B1 inhomogeneity (Conolly et al, 1991), and the four gradient pulse scheme was incorporated to reduce eddy current artifact (Reese et al, 2003). Eq. (1) then became
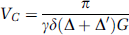
in which Δ was the separation between the 1st and 4th gradients and Δ′ between the second and third gradients. The VS pulse train used the largest G and different Vc was achieved by adjusting δ. The sinc-shaped modulation of longitudinal magnetization versus velocity is based on the assumption of laminar flow that is true in most primary vessels in vivo but not necessarily valid in capillary network. When the vessel size decreases to a degree accompanied by circuitous routes, flow becomes more plug-like and hence sets a lower limit to the choice of Vc. In human brain, flow velocity in penetrating arterioles is 1–2 cm/sec (Kobari et al, 1984), in which laminar flow still dominates the flow pattern and VS tagging is feasible. It is worth mentioning that PICORE tags a slab of spins by inversion whereas VS tagging is achieved by globally saturating the spins that move faster than Vc (Figure 2).
Illustrations of PICORE (
Magnetic Resonance Imaging
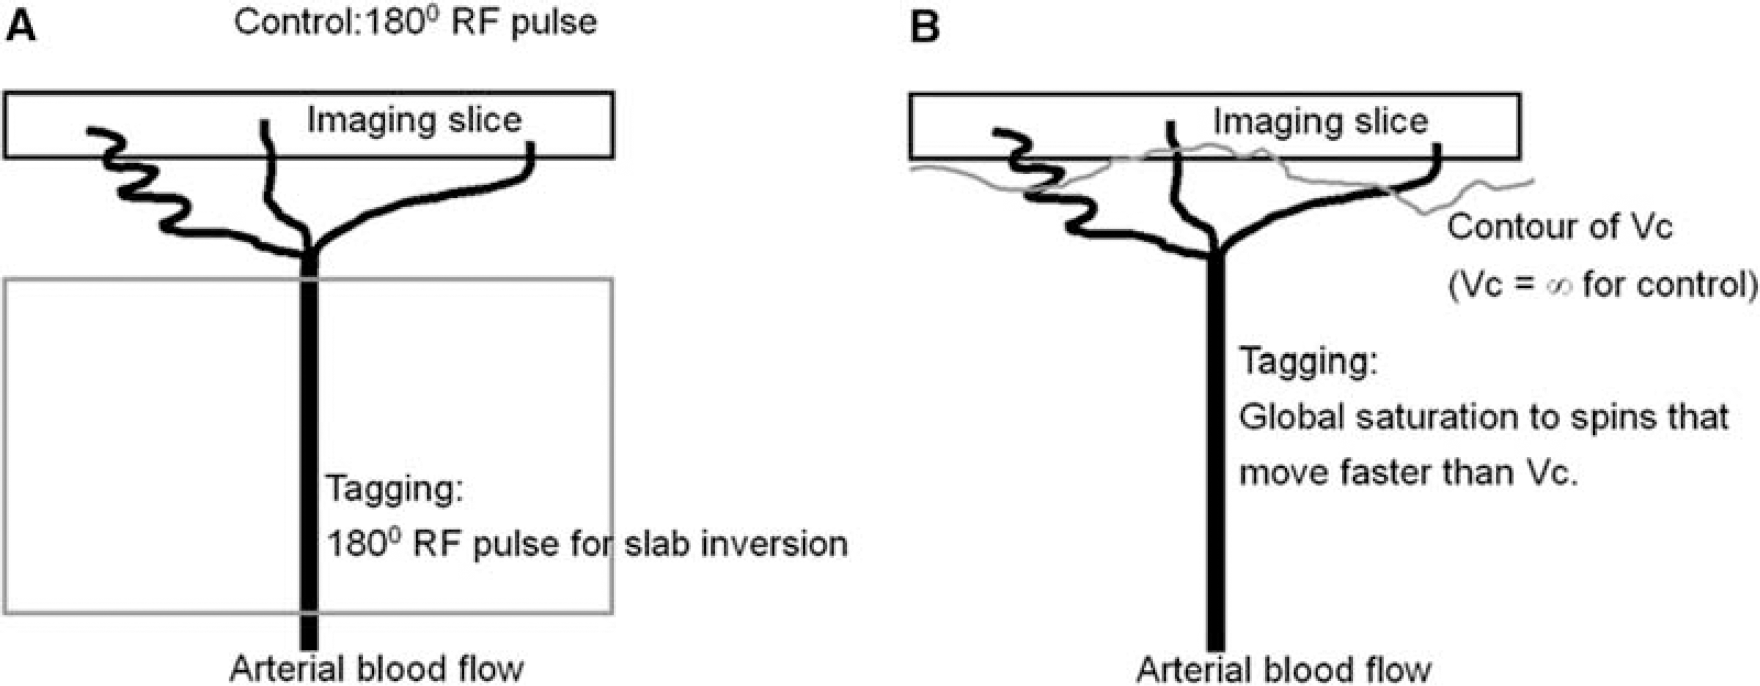
Six healthy volunteers (24 to 38 years old, three females, three males) were recruited in this study after all giving written consents. All imaging protocols were approved by the internal review board at the University of California, San Diego, and performed on a 3T GE EXCITE scanner using a standard setup of body coil transmission and head coil reception.
Functional magnetic resonance experiments: For functional experiments, the paradigm consisted of a preceding 48s OFF-period and four cycles of 24 secs ON-period and 36 secs OFF-period. Visual stimulation was performed using a black—white radial flashing checkerboard that alternated with black background with a white fixation at the center. The stimulation was back projected to a screen and viewed by the subject from a mirror attached to the head coil. Experiments comprised two parts: (1) comparison of VS and PICORE ASL methods and (2) determination of the optimal Vc in VS-ASL.
For experiment 1, a 5 mm single slice was prescribed to encompass the calcarine sulcus (oblique, except for one subject who had a horizontal calcarine fissure and an axial slice was used). FOV = 22 cm, in-plane matrix size = 64 × 64. For VS-ASL, TR/TE/TI = 3000/15/1600 ms, Vc = 2 cm/sec, flow-sensitive gradients were applied along three orthogonal directions (along frequency, phase (left—right) and slice encoding) in three separate scans. To increase the contrast-to-noise ratio, background suppression (Ye et al, 2000; Garcia et al, 2005; St Lawrence et al, 2005) was incorporated with two hyperbolic secant inversion pulses 1550 and 450 ms before imaging acquisition. For PICORE QUIPSS II ASL, TR/TE/TIsat/TI = 3000/2.9/700/1600 ms. Data were collected by a single shot spiral readout, spin echo sequence for VS-ASL and gradient echo for PICORE. The scans (three with VS, one with PICORE) were performed in a random order.
In experiment 2, the effect of transit delay was investigated on a subset of the subjects (n = 4, see Table 1) using the described paradigm and imaging parameters (both VS and PICORE) except that multiple Vc values were used (1, 2, and 4 cm/sec) and the flow-sensitive gradients were only applied along the direction of frequency encoding. As Vc was adjusted by the gradient duration in our implementation, TE changed with Vc and was 17, 15, and 12 ms for the Vc of 1, 2, and 4 cm/sec, respectively.
Flow quantification: To quantify flow, a reference image (spin echo for VS-ASL and TR/TEREF = ∞/15 ms; gradient echo for PICORE and TR/TEREF = ∞/2.9 ms) and a high-resolution proton-density-weighted image (TR/TEPD = 1500/5 ms, flip angle = 10°, voxel size = 1 × 1 × 1 mm3) were acquired. CSF was chosen as the reference tissue (see *Ref 13 for detailed theory and procedures). The equations used for CBF calculation were summarized in Table 2. The physiologic parameters used were as follows (subscripts B and C represented blood and CSF, respectively): T1B = 1664ms (Lu et al, 2004), T*2B/T2B=60/200 ms (assumed), T*2C/T2C=200/1000 (measured).
Six healthy volunteers were included in this study and all gave written consents before participating
Equations for CBF calculation. MZB is the MZ difference of arterial blood between tag and control images when tagging is applied
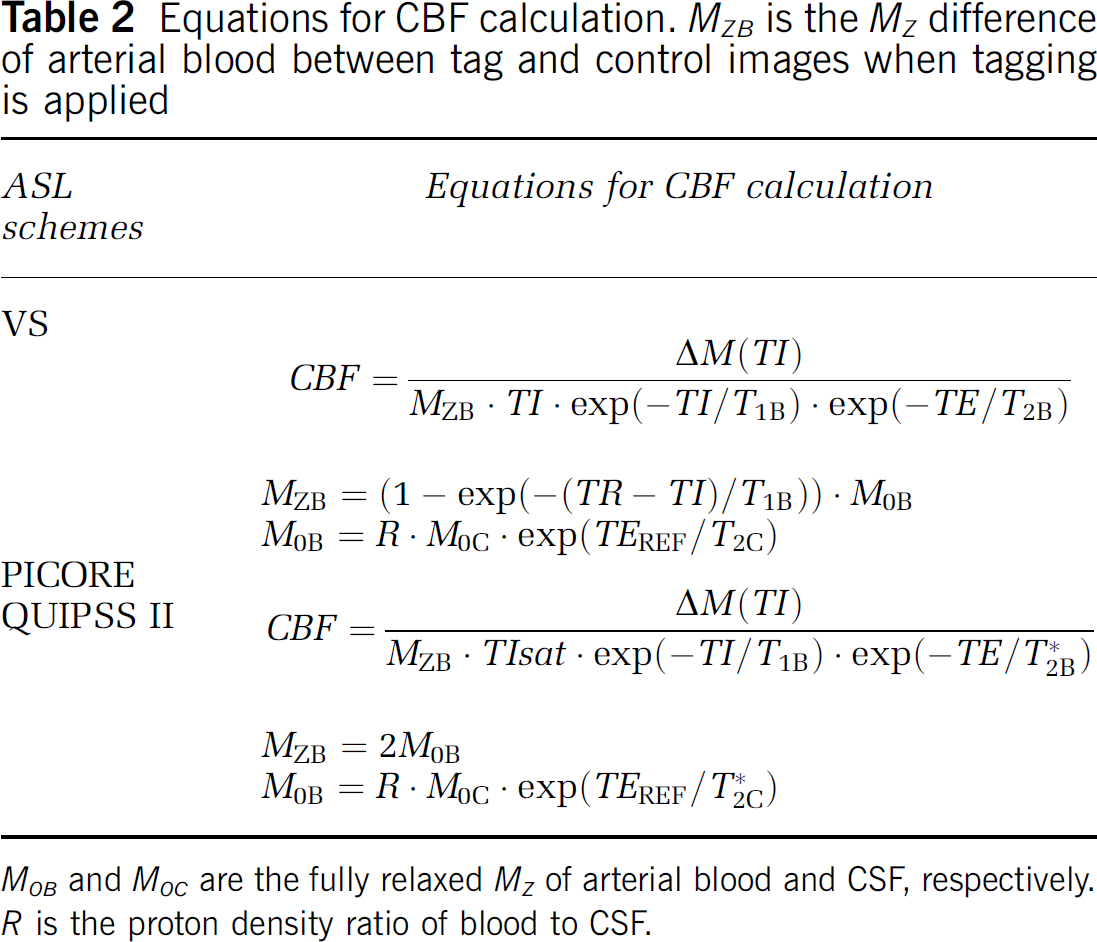
M0B and M0C are the fully relaxed MZ of arterial blood and CSF, respectively. R is the proton density ratio of blood to CSF.
Statistical Analysis
Complex data were reconstructed and converted to magnitude images. The images were realigned off-line by Analysis of Functional NeuroImage (AFNI) software (Cox, 1996) and then exported to MATLAB (Mathworks, Natick, MA, USA) for further processing. Baseline drift was removed by fitting signal-time curves to a nonlinear function. Arterial spin labeling signals were then generated from the running subtraction on the data acquired by VS-ASL and PICORE, respectively. Activated voxels were determined by correlation coefficient (c.c.) analysis. A P-value of 0.05 was chosen for statistical significance. A cluster threshold of three voxels was used. Fractional signal change was calculated as Sact/Srest-1 in which S represented the ASL signal.
For experiment 1, the comparison of different tagging schemes included three steps. First, a c.c. threshold of 0.25 was applied to VS-ASL. Second, the c.c. threshold was adjusted for PICORE so that the number of detected voxels was equal or as close as possible to the union of three orthogonal directions of VS tagging. Third, for each directional VS encoding the average signal-time curves were generated from the voxels detected by both VS-ASL and PICORE. In experiment 2, a c.c. threshold of 0.25 was used for all functional scans. The average signal—time curves were generated from the voxels detected by VS-ASL and PICORE. To examine the arteriolar effect, the activated voxels were further binned on a basis of their flow velocity and hence distance from capillary bed. Those detected by Vc = 2 cm/sec were grouped into two subsets: detected by Vc = (1) 2 cm/sec only, (2) 2 and 1 cm/sec. Those detected by Vc = 4 cm/sec were grouped into three subsets: detected by Vc = (1) 4 cm/sec only, (2) 4 and 2 cm/sec, (3) 4, 2, and 1 cm/sec.
Results
Comparison of Velocity Selective-Arterial Spin Labeling and PICORE
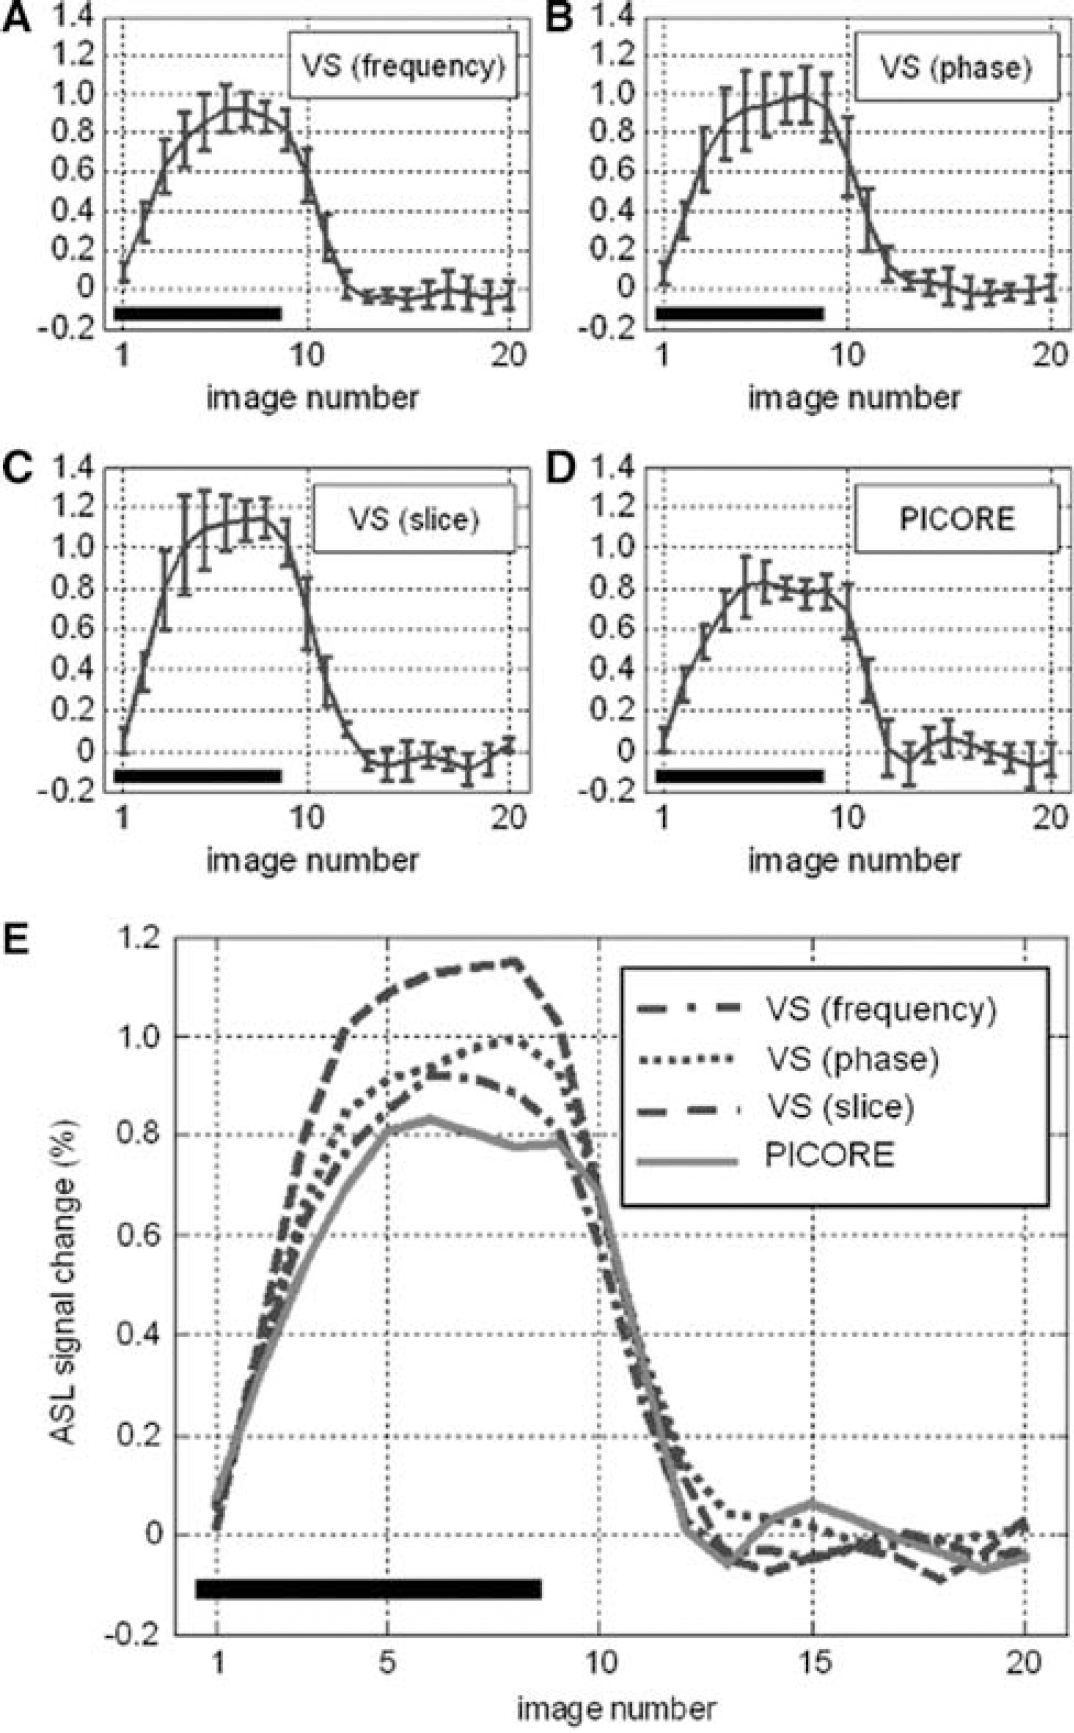
Two representative sets of function maps detected by VS-ASL and PICORE at visual cortex are shown in Figure 3. Orthogonal directions of VS tagging demonstrate different spatial specificity whereas their union highly matches the region detected by PICORE (more than 84% overlap). Figure 4 shows the perfusion haemodynamics and the error bars indicate the standard deviation of six subjects. One notices that the fractional signal change is markedly higher in VS-ASL than PICORE. To examine this discrepancy, baseline CBF is calculated and the contribution from orthogonal VS gradients is analyzed separately (Figure 5). The mean baseline CBF is 75 mL/100 mL/min in PICORE, and 74, 71, 56 mL/100 mL/min with the VS tagging along the direction of frequency, phase (left—right) and slice encoding, respectively. Marked underestimation of CBF is found when VS gradients are applied parallel to the direction of slice encoding. For the other two directions of VS tagging (frequency and phase encoding), the ASL signal change is subtly higher than that of PICORE but the difference is not significant.
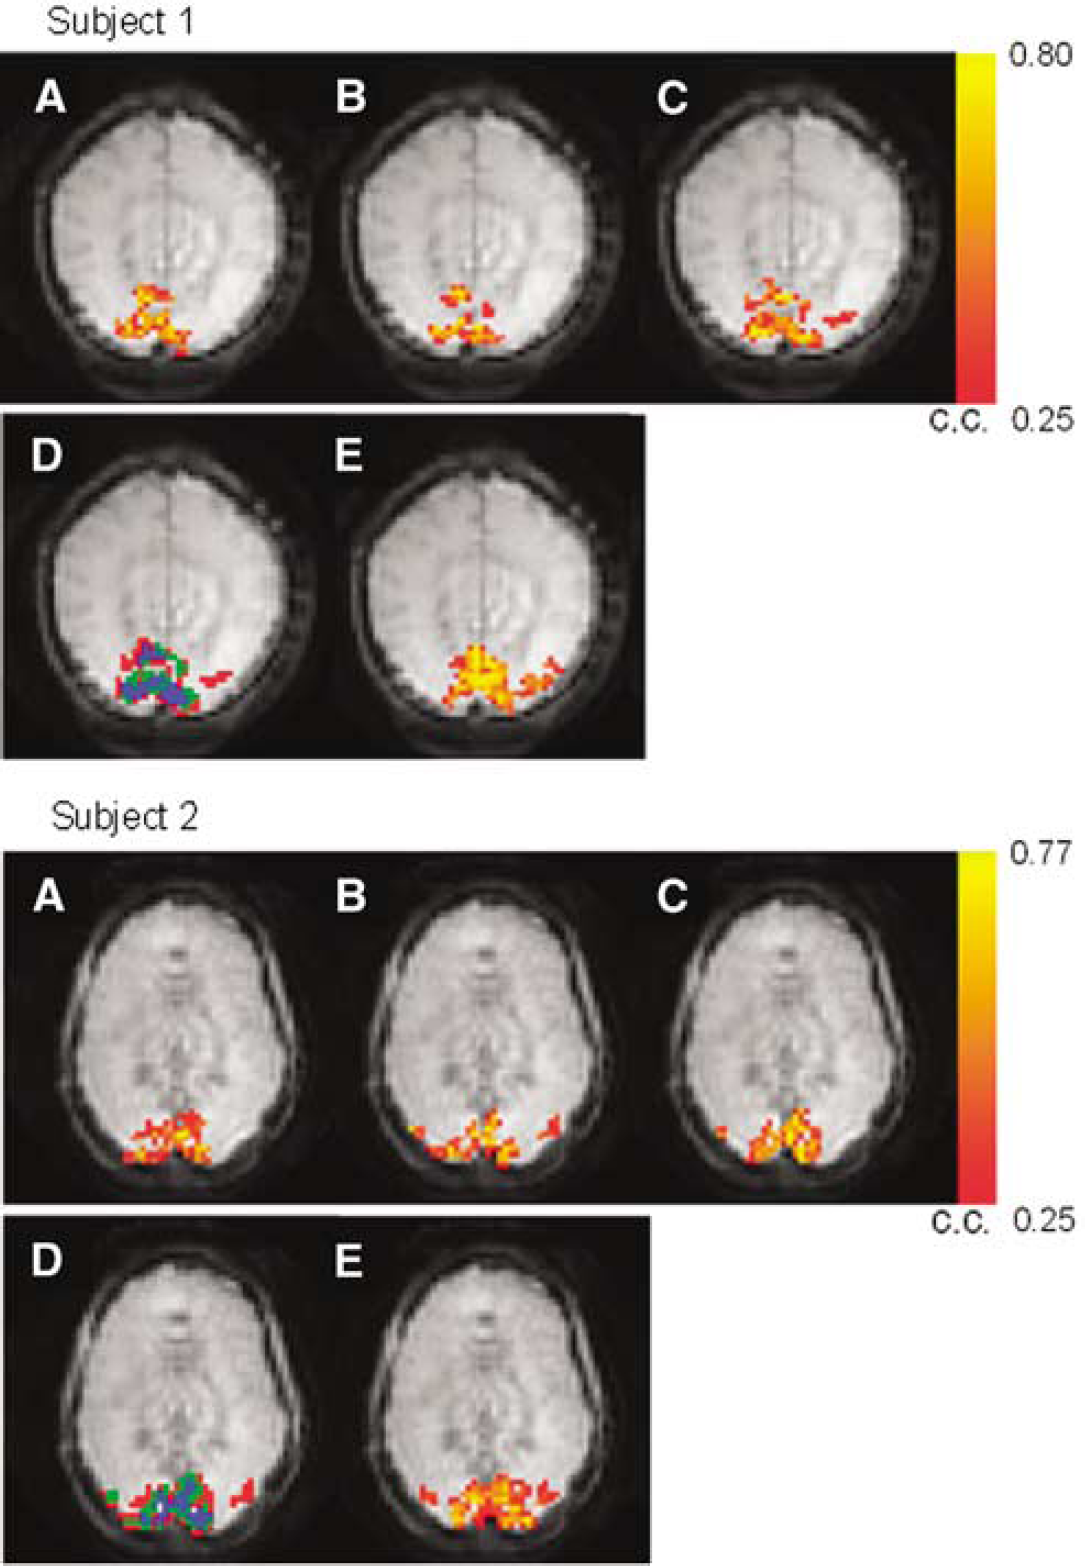
Two sets of activation maps acquired by VS-ASL (
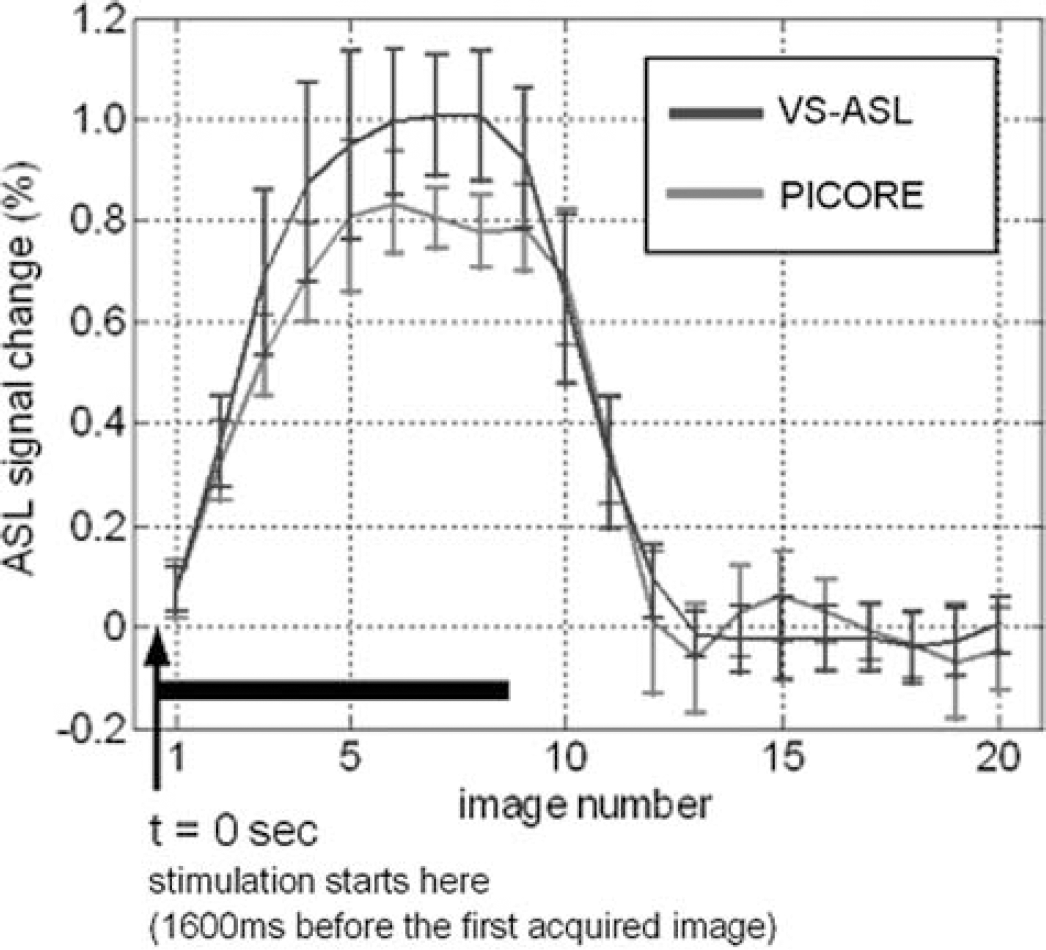
Signal—time curves generated from the voxels detected by both VS-ASL (Vc = 2 cm/sec) and PICORE. The VS-ASL signal is the average over orthogonal VS taggings.
The signal-time curves generated from the pixels detected by both VS-ASL (
Determination of the Vc in Velocity Selective-Arterial Spin Labeling
Figure 6 shows two sets of activation maps acquired with PICORE and different Vc. All VS-ASL images are acquired with the flow weighting gradients along the direction of frequency encoding. The union of multiple Vc values is comparable to the result of PICORE. The activation area detected by Vc = 1 cm/secs is consistently smaller than and mostly included in the area detected by Vc = 2 cm/secs. The baseline CBF is comparable between PICORE, Vc = 1 and 2 cm/secs (74, 74, 72 mL/100 mL/min, respectively) but notably decreased when Vc = 4 cm/s (62 mL/100 mL/min). The underestimated baseline leads to a larger fractional signal change (Figure 7). By analyzing the subsets of Vc = 4 cm/sec, spuriously larger fractional signal change is found in all subsets, especially in the most upstream one (detected by Vc = 4 cm/sec only). However, no obvious difference is found between subsets of Vc = 2 cm/sec.
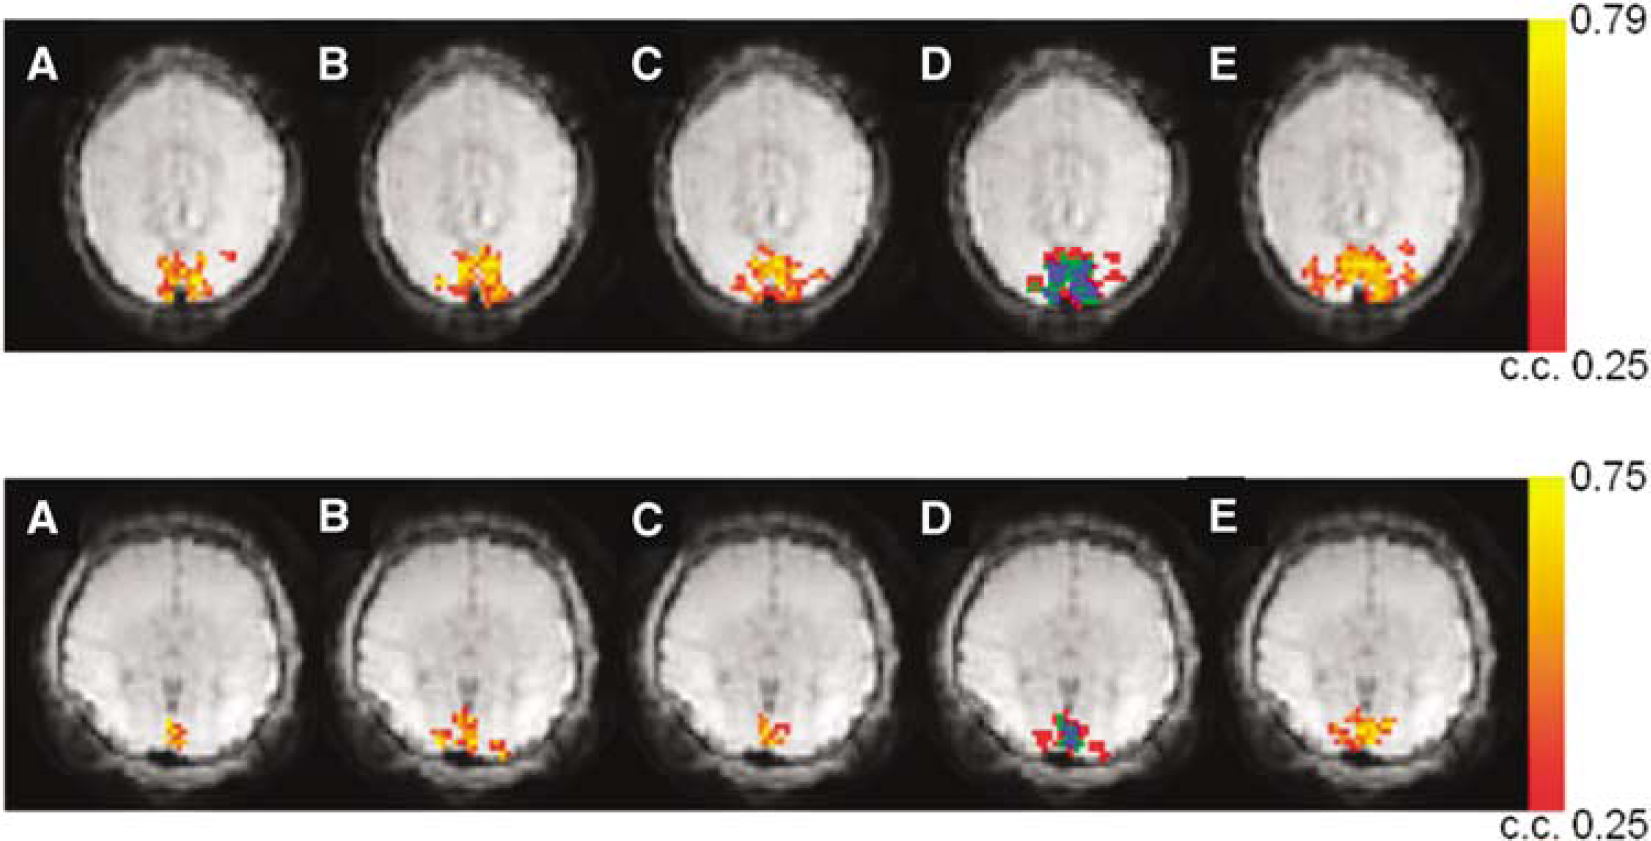
Two sets of activation maps acquired by VS-ASL (
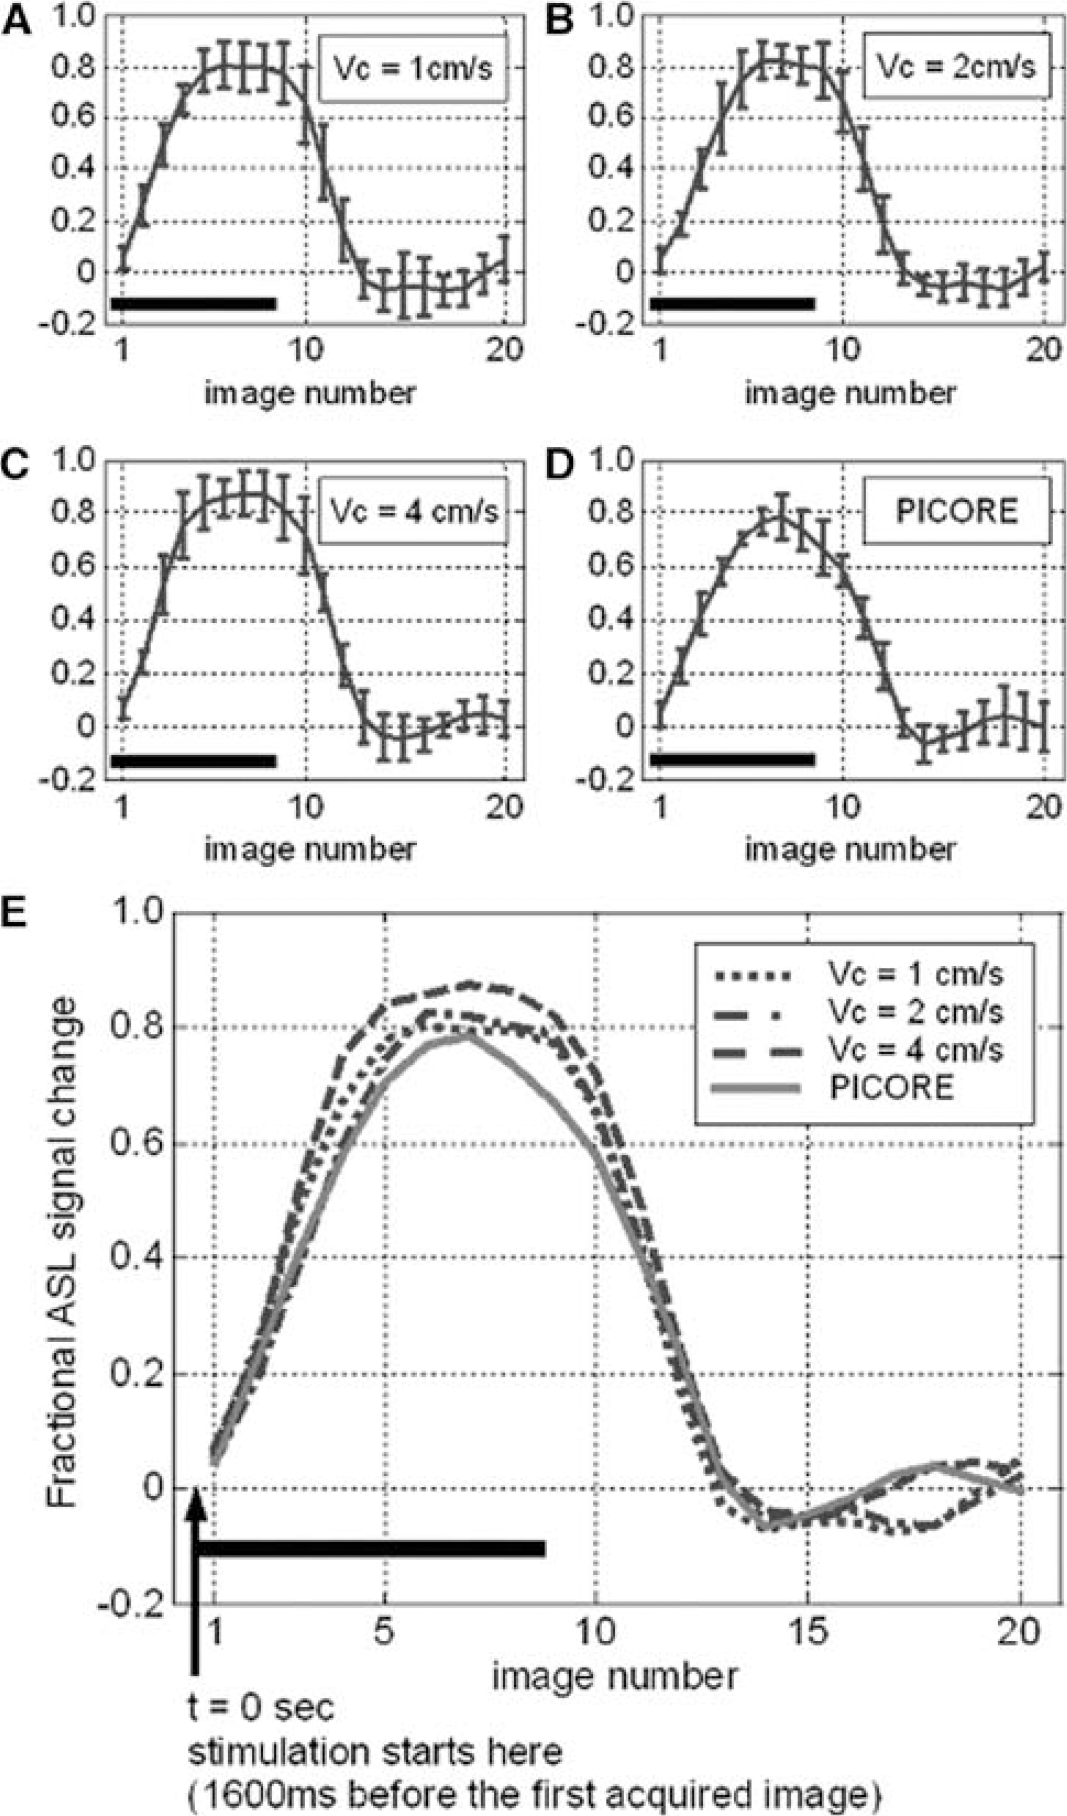
The signal—time curves generated from the pixels detected by both VS-ASL (
Discussion
During the past years, ASL has evolved into a useful technique for noninvasive measurement of CBF. As ASL can be applied repeatedly with a short interval (on the order of the T1 of arterial blood), it is a useful tool in fMRI studies and has increasingly received attention from investigators. In conventional ASL methods, the tagging band is positioned either upstream or nonselective to the slices to be imaged and includes a wide range of blood flow velocities as well as pathways into the imaging region. As a result, transit delay (Δt) emerges in the flow quantification and can complicate the scenario in clinical applications, especially when slow flow and elongated route are present. More recently, VS-ASL was proposed to tag arterial blood according to its flow velocity instead of spatial distribution. This alternative tagging scheme aims to circumvent Δt variation by using a cutoff velocity (Vc) that is small enough to tag blood extremely close to, or already residing in the imaging slices, that is Δt = 0. VS-ASL has been validated in the measurement of baseline CBF but not in functional studies yet. As VS-ASL and PICORE are based on different tagging strategies, it is helpful to examine their comparability and/or discrepancy and whether they provide complementary specificity in detecting neuronal activity.
Comparison of Velocity Selective-Arterial Spin Labeling and PICORE
As shown in Figure 3, orthogonal directions of VS tagging exhibit different spatial specificity in detecting the activation-induced flow change. The area concurrently detected by three orthogonal VS taggings locates more along the midline, which agrees with the arteriolar branching pattern in human occipital lobe. The union of orthogonal VS taggings shows a nice match with PICORE. Overall, VS-ASL and PICORE provide comparable spatial specificity while VS-ASL further distinguishes the contribution of directional flow. The fractional signal change, however, is markedly higher in VS-ASL than PICORE when the flow-sensitive gradients are along to the direction of slice encoding. This discrepancy is because of the underestimated baseline CBF and can be elaborated as follows. In our experiment, oblique slices were prescribed 30° to 40° from the axial plane, except for one subject who had a horizontal calcarine fissure (an axial slice was therefore used). The flow-sensitive gradients were applied along the direction of frequency, phase and slice encoding in three separate scans. We consistently set the phase encoding from left to right. Therefore, frequency and slice encodings were more representative of anterior—posterior and superior—posterior directions, respectively. In human occipital lobe, the arteriolar blood supply is primarily comprised of anterior—posterior and left—right flow whereas relatively small proportion of flow comes in superior—inferior direction. In VS-ASL, a spin is tagged only as it moves with a velocity component that is parallel to the VS encoding and higher than the chosen Vc. Assuming that flow velocity in arterioles decelerates with vessel size when blood enters the capillary bed, the directional difference between flow and VS tagging moves the tagging boundary toward upstream. As the superior—inferior VS tagging is most off the direction of the main arteriolar flow, the tagging area recedes and falls out of the target slices, leading to a non-zero Δt and hence CBF underestimation, especially in OFF-period as flow is slower. By contrast, comparable baseline CBF is found by PICORE and VS-ASL as the VS applied along the primary flow directions (anterior—posterior, left—right).
Determination of the Vc in Velocity Selective-Arterial Spin Labeling
In VS-ASL, flow contrast originates from the spins that move faster than Vc during tagging and then decelerate to a velocity below Vc when images are acquired. The range of target vessels therefore varies with Vc values (Figure 8), which attributes to the smaller activation region found by Vc = 1 cm/sec than 2 cm/sec. In addition, comparable baseline CBF and haemodynamics are found with Vc = 1, 2 cm/sec and PICORE, which suggests that the flow velocity of 2 cm/sec has reached the vicinity of tissue perfusion. For Vc = 2 cm/sec, no obvious hemodynamic difference is found along the arteriolar path (areas contributed by Vc = 2 cm/sec only versus both 2 and 1 cm/sec). For Vc = 4 cm/sec, baseline CBF is underestimated and the fractional signal change is spuriously higher. This discrepancy also comes from the inclusion of signal from large vessels. The pixels exclusively detected by Vc = 4 cm/sec are far off the capillary bed and no longer reflect the behavior of tissue perfusion. Nevertheless, these pixels provide evidence of arteriolar response to neuronal activity. Given that flow velocity is 1 to 2 cm/sec at the vessel diameter of 30 to 60 μm (Kobari et al, 1984), the respondent vessel size can be up to 240 μm (assuming exponential scaling).
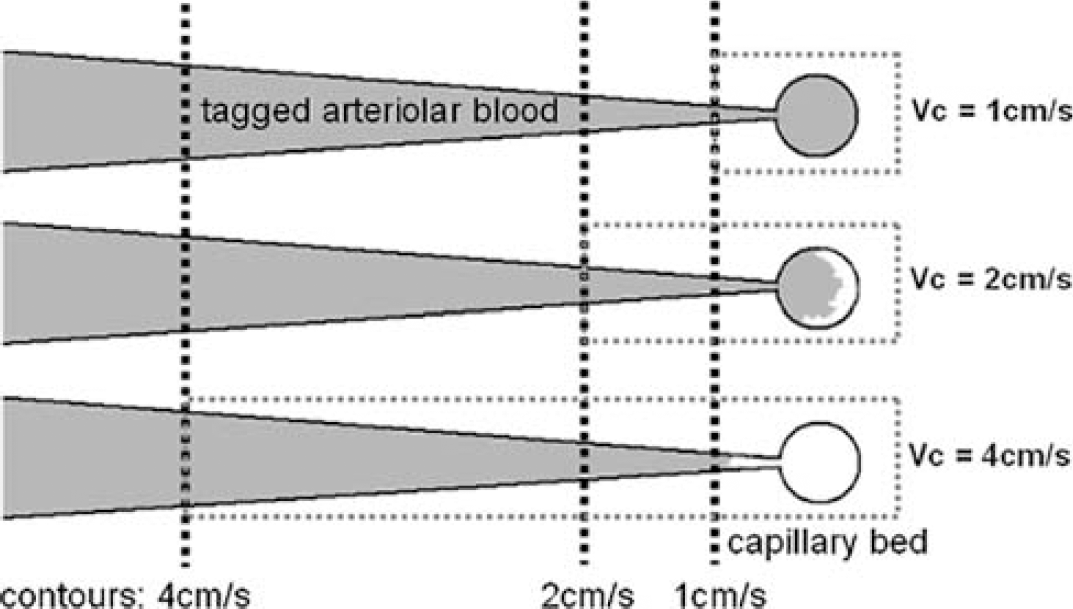
Illustration of the variant scope of VS tagging and imaging. The larger cutoff velocity (Vc) is chosen, the tagged blood starts from more upstream (black dotted contours) and it takes longer for the tagged blood to travel from the tagging region to the capillary bed. Meanwhile, the imaging scope (gray dotted rectangles) is wider, including intravascular signal in large vessels.
Technical Considerations
In this study, we have assumed that PICORE QUIPSS II measures the correct CBF. Two potential error sources are addressed as below nevertheless. In our experiment, the tagging band of PICORE is 20 cm thick, 1 cm below and parallel to the imaging slice. When flow velocity is higher than 29 cm/secs (20 cm divided by 700 ms), the saturation pulse will miss the tag bolus, which results in CBF underestimation. If this happens during activation when flow velocity increases (Buxton et al, 1998; Yang et al, 2000), spuriously lower fractional signal change occurs. The other concern is the through plane vessels whose existence biases CBF measurement. By contrast, VS-ASL takes advantages of a pair of bipolar gradients with identical flow moment as the VS pulse train to restrict the imaging scope to the spins moving slower than Vc and thereby remove the intravascular signal of through plane vessels. Although a bipolar crusher gradient can be incorporated in PICORE QUIPSS II to eliminate the intravascular signal, it is likely to destroy the bolus width defined by TIsat if some tags remain in these vessels by the time of image acquisition.
One potential limitation of using VS-ASL in fMRI is the flow variation between rest and activation states. The faster flow accompanying the increase in neuronal activity may shift the tagging region toward downstream and hence complicate the localization in activated pixels. We inspected this effect by subtracting the perfusion maps that were averaged over ON and OFF states, respectively. No residual displacement was found with the used voxel size (3.4 × 3.4 × 5 mm3). For further investigation, a surface coil can be used to acquire data of high spatial resolution and examine the extent of voxel shift caused by the different flow velocity between different states of neuronal activity.
Practical Applications
In contrast to conventional ASL methods such as PICORE that spatially specify the tagging band, VS-ASL tags spins according to their flow velocity. In a sense, however, VS-ASL also refers to spatial distribution, or vasculature. With the VS tagging along primary flow directions, our data show the comparability between two tagging schemes. The directionally dependent complication of transit delay can be mitigated by using a sufficiently small Vc (< 2 cm/secs). Some potential applications of VS-ASL in fMRI are described as follows. First, since the collateral circulation in ischemia patients is usually characterized by elongated pathway, VS-ASL provides an alternative tagging strategy to circumvent the long transit delay. Second, the VS-ASL functional maps can be used to evaluate the tumor angiogenesis or vessel tortuosity. The highly convoluted vessels neighboring the lesion are expected to reduce the directionality of VS-ASL signals. Third, VS-ASL can be used in brain areas such as deep cortex where the blood flow is slow and/or the direction of blood supply is uncertain. With traditional ASL methods on the contrary, it is difficult to specify tagging band.
Conclusion
As compared with conventional ASL methods, VS-ASL provides comparable spatial specificity in detecting the flow change induced by neuronal activity and complementary information about the directionality of blood supply. In addition, VS-ASL is inherently free from the intravascular signal of large vessels. To the best of our knowledge, this is the first study that investigates the feasibility of VS-ASL in fMRI.