
Abstract
This paper describes a new rapid steady-state T1 (RSST1) method for mapping the cerebral blood volume fraction (CBVf) by magnetic resonance imaging (MRI). The principle is based on a two-compartment model of the brain (intra- and extravascular), and the effects of paramagnetic contrast agents on the intravascular longitudinal relaxation time T1. Using appropriate parameters, an Inversion-Recovery-Fast-Low-Angle-Shot sequence acts like a low pass T1 filter, suppressing signals from tissues with T1≫TR (TR=repetition time). It was shown in vivo that, exceeding a particular contrast agent dose, the signal reaches its maximum (corresponding to the intravascular equilibrium magnetization), and is maintained for a duration related to the dose. Acquisitions during this steady state divided by an additional measure of the overall (intra- and extravascular) magnetization at thermal equilibrium provides the CBVf. Experiments were performed on healthy rats at 2.35 T using P760 (Gd3+—compound from Guerbet Laboratories) and Gd-DOTA. Because of its high longitudinal relaxivity, P760 is more convenient, and was used to show the feasibility of the method. The CBVf in different structures of the rat brain was compared. The average CBVf for the whole brain slice is 3.29%±0.69% (n=15). The influence of transendothelial water exchange was quantified and transversal relaxation effects were found negligible in microvasculature. Finally, the sensitivity of the method to CBVf increases under hypercapnia was evaluated (1%/mm Hg PaCO2), demonstrating its potential for longitudinal studies and functional MRI. Clinical applications are feasible since equivalent results were obtained with Gd-DOTA.
Keywords
Introduction
The quantification of the cerebral blood volume (CBV) is useful for studying cerebral pathophysiology. For example, it is a valuable parameter for tumor grading (Aronen et al, 1994) and for the prediction of the final cerebral ischemic infarct volume, and highly specific for the detection of infarcted tissue (Schaefer et al, 2002). In general, absolute CBV values are necessary for repeated measures in the control of therapeutic interventions, in particular when studying an antiangiogenic drug. The CBV also allows the detection of activated areas in functional imaging, and its quantification is helpful to analyze the complex BOLD signal (Ogawa et al, 1993).
The standard magnetic resonance imaging (MRI) methods for CBV evaluation are based on the properties of intravascular paramagnetic or superparamagnetic contrast agents (CAs), which affect longitudinal (T1) and transversal (T2 or T2∗) relaxation times. Two common techniques are available: dynamic and steady-state approaches.
The dynamic methods, including the Dynamic Susceptibility Contrast method (Moonen et al, 1992; Rosen et al, 1991; Villringer et al, 1988) and the T1 bolus method (Dean et al, 1992; Hacklander et al, 1996, 1997), are based on the intravascular indicator dilution theory (Meier and Zierler, 1954) and require high temporal resolution to acquire series of images during the first pass of the bolus of the injected tracer in the brain tissue. The area under the curve describing the temporal change of the relaxation rate ΔR1=(ΔT1)−1 or ΔR2∗=(ΔT2∗)−1 during bolus passsage has been demonstrated to be proportional to the CBV (Belliveau et al, 1990; Hacklander et al, 1996).
Steady-state methods (An and Lin, 2002; Hamberg et al, 1996; Kuppusamy et al, 1996; Lin et al, 1997; Payen et al, 1998; Schwarzbauer et al, 1997) consist in acquiring two signals, one before and one after injection of a CA when it is uniformly distributed in the vascular system. The differences ΔR1 or ΔR2∗ between the relaxation rates measured before and after CA administration have been shown to be proportional to the CBV of macro- and microvasculature, while the change ΔR2 in transverse relaxation rate R2 has been shown to be mainly proportional to the CBV of microvasculature (Boxerman et al, 1995).
Currently, most of these methods provide only relative values (the CBV ratio between a region of interest (ROI) and a reference region) (Hamberg et al, 1996; Payen et al, 1998). Absolute quantification defined as mL blood/100 mg brain tissue or as the CBV fraction (CBVf) in mL blood/mL brain tissue is generally difficult and additional measurements are needed.
Quantifying CBV with dynamic methods necessitates accurate determination of the arterial input function. The arterial input function measured in a supplying artery may differ from that in the tissue of interest resulting in miscalculation of the CBV (Calamante et al, 2004).
With steady-state methods, quantification requires the knowledge of the blood signal before and after CA administration. This signal difference is either directly used for normalization (Kuppusamy et al, 1996; Lin et al, 1997) or to calculate the relaxation rate difference (ΔR1) (Schwarzbauer et al, 1997) or the susceptibility difference (Payen et al, 2000). This requires either blood sampling (Schwarzbauer et al, 1993; Tropres et al, 2001) or the determination of the signal from voxels located in larger blood vessels (Kuppusamy et al, 1996; Lin et al, 1997; Schwarzbauer et al, 1997).
Moreover, in case of the ΔR2∗ techniques, the signal interpretation is further complicated by the signal dependence on the vascular morphology (Boxerman et al, 1995), and by the hematocrit difference between capillaries and large vessels (Cremer and Seville, 1983).
The vascular space occupying imaging technique (Lu et al, 2003) is based on the suppression of the blood water signal. In its first version, it does not use CAs, and the signal variation associated with brain activation was shown to be proportional to the CBV variation. More recently a second version (Lu et al, 2005) for absolute CBV mapping was proposed, based on the same principle but using an intravascular CA to obtain a fully relaxed blood signal.
In this paper, the rapid steady-state T1 method (RSST1), an alternative MRI method for mapping CBVf in a simple and direct way, is presented. In contrast to the vascular space occupying technique, which suppresses no more than the blood signal before CA injection, the RSST1 method takes advantage of the T1 shortening of intravascular CAs and of rapid MRI to suppress all signals from extravascular tissues characterized by long T1. Consequently, the blood signal, completely relaxed by the CA, being acquired selectively and directly, no image subtraction is necessary. For CBVf mapping, an additional image is acquired at thermal equilibrium to obtain the overall (intra- and extravascular) equilibrium magnetization.
The method was developed and validated at 2.35 T on the normocapnic and hypercapnic healthy rat brain using either bolus injections or continuous CA infusion of P760 and Gd-DOTA.
Materials and methods
Theory
The principle is based on a two-compartment model of the brain parenchyma, assuming the water exchange across the blood—brain barrier (BBB) to be negligible (Kuppusamy et al, 1996) in a first approach. The idea of this method is to distinguish these compartments by two different T1 clusters: high T1 for the extravascular compartment and low T1 for the intravascular compartment, in the presence of an intravascular paramagnetic CA.
An Inversion-Recovery-Fast-Low-Angle-SHot (IR-FLASH) rapid sequence was used (Haase, 1990). In the steady state, the longitudinal magnetization MZ normalized to its thermal equilibrium M0 is described by
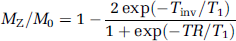
In Figure 1, the ratio MZ/M0 from equation (1) is plotted as a function of T1 for different inversion times (Tinv) and for a particular repetition time (TR) of 750 ms.
Fractional longitudinal magnetization MZ/M0 as a function of the longitudinal relaxation time constant T1 plotted for TR=750 ms and for different Tinv according to equation (1). For tissues characterized by T1>1000 ms, Mz/M0 approaches zero. For T1<Tinv/5, MZ/M0=1.
Suppression of the longitudinal tissue magnetization can be achieved for the inversion time

From equation (2) it can be deduced that for TR≪T1, the nulling point Tinv tends towards TR/2. This is illustrated in Figure 1 for the particular example of TR=750 ms. The sequence used appears as a low-pass T1 filter. If Tinv=325 ms, which approaches TR/2, the signal is practically suppressed for tissues characterized by a T1 beyond 1000 ms, such as extravascular brain tissue and blood without CA. In contrast, for tissues with short T1 with respect to Tinv (T1<Tinv/5), such as for blood in the presence of the CA, the longitudinal magnetization is equal to the equilibrium magnetization M0 and the signal becomes independent of the T1 value. This condition is referred to as a ‘rapid steady-state regime’, during which the intravascular signal is constant.
Under these conditions, if transverse relaxation effects are negligible, the CBVf is simply given by

where Spost is the signal acquired after CA administration, and S0 is the signal corresponding to the thermal equilibrium magnetization from both compartments. S0 is acquired for normalization to obtain the CBVf.
Since the tissue T1 values strongly depend on the static field strength, particular tissues may have low T1 values, which cannot be completely suppressed by the rapid IR-FLASH sequence for a given TR. In this case, the TR can be shortened but this requires further reduction of the intravascular T1. It is also possible to subtract an image acquired before CA injection from the postcontrast image to eliminate any residual tissue signal.
Magnetic Resonance Imaging
Experiments were performed on a 2.35 T small animal imager (horizontal bore Bruker magnet, 40 cm inner diameter equipped with an SMIS spectrometer). Two coil systems were used. Either a 1H radio frequency surface coil (34 mm diameter) was used for emission and reception, or an actively decoupled system composed of a homogenous coil for emission and a surface coil for reception.
The inversion pulse of the IR-FLASH sequence, a nonslice-selective adiabatic sech/tanh pulse, is followed by a rapid gradient echo imaging sequence consisting of a series of radio frequency readout pulses with a low flip angle α=10°, and a short repetition time TRFLASH=10.5 ms. The echo time TE was set to its minimum value 3.2 ms to minimize the transversal relaxation effect. The TR between successive images was 750 ms.
The image acquisition started at Tinv=325 ms at the center of k-space. This Tinv value is approximately TR/2 and was experimentally found to most efficiently suppress the tissue signal. The slice thickness was set to 2 mm. A 32 × 32 acquisition matrix was used for a field of view of either 32 × 32 mm2 or 24 × 24 mm2, leading to in-plane spatial resolutions of either 1 × 1 mm2 or 0.75 × 0.75 mm2, respectively. A series of images was acquired with these parameters before CA injection to obtain a baseline of the signal intensity (Spre), and after CA injection (Spost). The S0 signal was obtained with the same sequence using a long TR of 10 secs and a Tinv of 8 secs. Signals were acquired for at least 1 min for the bolus injection mode, and for up to 20 mins under continous CA infusion. Inversion-Recovery-Fast-Low-Angle-SHot images of the same slice acquired with TR=3.5 secs, Tinv=325 ms and with a 128 × 64 matrix provided good tissue contrast. Spin-Echo T2-weighted anatomic (TR=2 secs, TE=80 ms) and angiographic MR images (TR=100 ms, TE=25 ms) were also acquired (matrix size 128 × 64). The brain slices were chosen in the transversal or coronal orientation and contained part of the basal nuclei and frontal and/or parietal cortex, respectively.
Contrast Agents
P760 and Gd-DOTA, both from Guerbet Laboratories, were used as CAs.
P760 is an experimental Gadolinium (Gd3+)-based compound characterized by a high relaxivity: r1=19.7±0.7 (mmol/L)−1 sec−1 in rat plasma at 2.35 T (versus r1=3.4±0.1 (mmol/L)−1 sec−1 for Gd-DOTA) (Fonchy et al, 2001). The r1-relaxivity is defined as ΔR1/[CA], where ΔR1 represents the change in the longitudinal relaxation rate of the blood induced by the CA, and [CA] stands for its concentration in the blood. Injected at an equal Gd3+ dose, the Gd3+ concentration in the blood remains higher with P760 than with Gd-DOTA during the postbolus phase, because of its intravascular restriction (Corot et al, 2002). However, its renal elimination rate is equal to that of Gd-DOTA (Port et al, 1999).
Assuming that the total blood volume of a rat weighting 300 g is approximately 15 to 21 mL (Lee and Blaufox, 1985), the P760 blood concentration after a bolus injection of 0.1 mmol/kg P760 ranges between 1.43 and 2 mmol/L. According to the r1 relaxivity of P760, the T1 value of blood is then reduced from 1450 ms to 36 or 25 ms, which allows full relaxation of the intravascular magnetization at Tinv=325 ms.
The infusion technique consisted of an initial bolus injection of 0.1 mmol/kg P760 followed by a continuous infusion at a rate of 7.8 μmol kg−1 min−1. The infusion rate was chosen so as to maintain a plasmatic P760 concentration of 1.3 mmol/L, leading to a blood T1 of approximately 40 ms. In this case, the blood signal keeps its equilibrium value throughout the infusion duration (up 60 mins). For a rat weighting 300 g, the P760 volume injected as a bolus is 0.43 ml (2.3% of the total blood volume), and the volume administered during an infusion of 60 mins is 2 ml (0.2% of the total blood volume per minute).
Gd-DOTA bolus injections were performed at a dose of 0.2 mmol/kg, except for experiments under infusion and hypercapnia. For the hypercapnia experiments, bolus injections of 0.3 mmol/kg Gd-DOTA were administered, resulting in a steady state of about 5 mins, as could be obtained with 0.1 mmol/kg P760. The use of Gd-DOTA for the infusion experiment necessitated a bolus injection of the same dose to avoid a signal drop before the arrival of the continuous infusion at a rate of 63 μmol kg−1 min−1 because of the length of the intravenous-line used in these experiments.
Animals
In vivo studies were performed on healthy male rats (320 to 450 g) from Sprague—Dawley or Wistar stains. They were oxygenized and anesthetized with 1.3% to 1.8% isoflurane. Procedures and animal care conformed to the ‘Guidelines of the French Government’ (decree 87 to 848, 19 October 1987, licenses 006683 and A38071). Catheters were inserted into the femoral vein for CA administration and into the femoral artery for blood sampling. Arterial hemoglobin, pH, and blood gas levels were measured and corrected for rectal temperature before and after each CA injection with the use of a pH/blood gas analyzer (Radiometer Copenhagen ABL™ 510) to confirm full oxygenation and a normocapnic arterial carbon dioxide tension (PaCO2) (40 mm Hg±5 mm Hg) as well as normal hematocrit (>35%). As CBV is known to increase with PaCO2 (Payen et al, 1998; Shockley and LaManna, 1988), rats not fulfilling normal physiologic conditions were excluded from the study.
The rats were positioned prone. A warm-water circuit maintained rectal body temperature at 37°C±1°C during surgery and throughout the experiment. To minimize the possibility of motion artifacts, the rat's head was fixed by means of earbars and a bitebar.
Rats undergoing the hypercapnia experiment were additionally equipped with a tracheal cannula for mechanical ventilation. Pulmonary and arterial blood pressures were monitored throughout the experiment. An intravenous injection of 2 mL pancuronium bromide (Pavulon®, Organon, 0.1 mg/mL) was performed before signal acquisition to avoid spontaneous breathing under hypercapnia.
Hypercapnia was induced with an addition of 5% to 7% CO2 during 30 to 45 mins, while the oxygen flow (33%) was maintained. Repeated CBVf measurements were performed on the same rat. For each hypercapnia level, a delay of 15 mins was necessary to reach a stable PaCO2, measured before signal acquisition. Recovery from hypercapnia (30 to 40 mins) under air and 33% oxygen ventilation was allowed before performing a final acquisition.
Preliminary Experiments
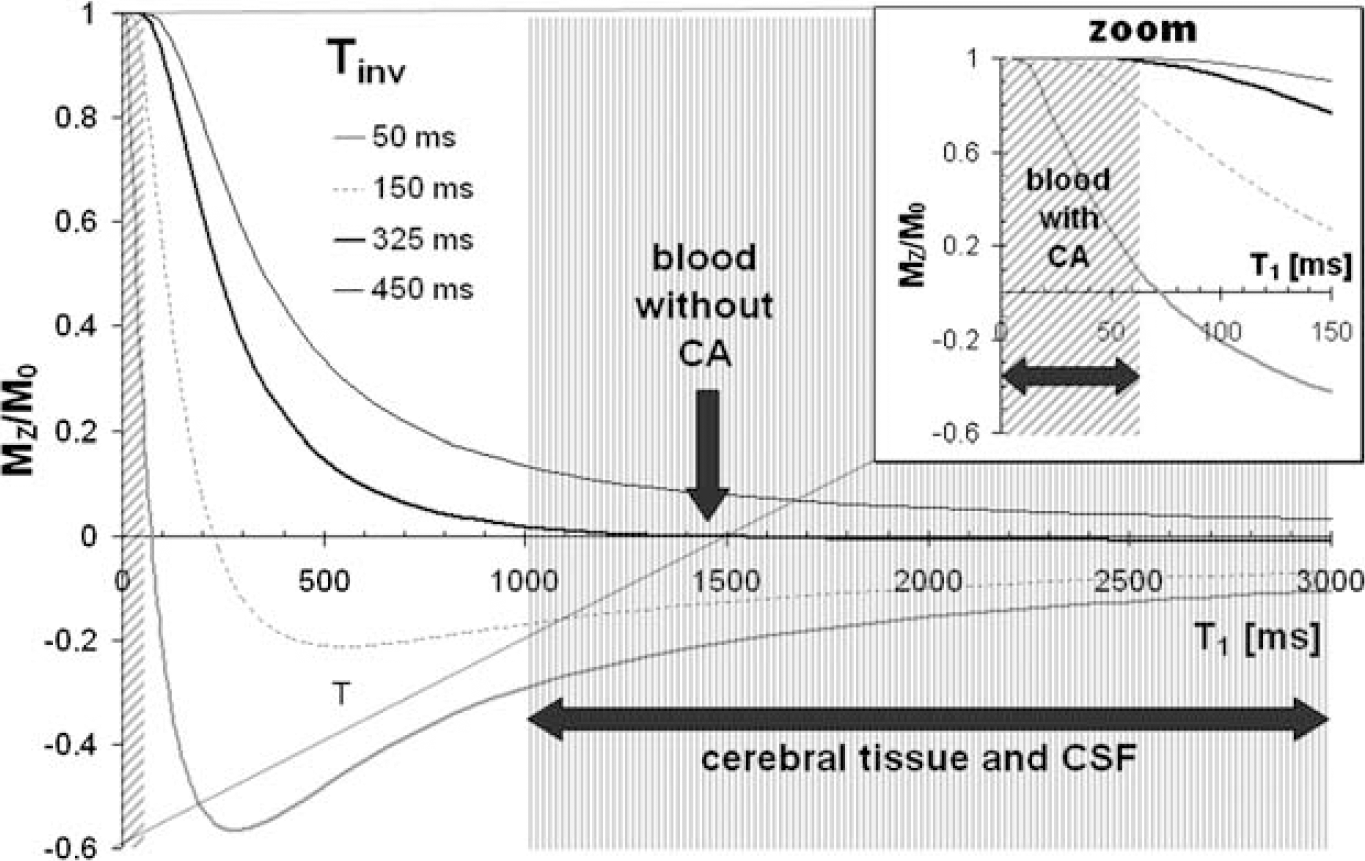
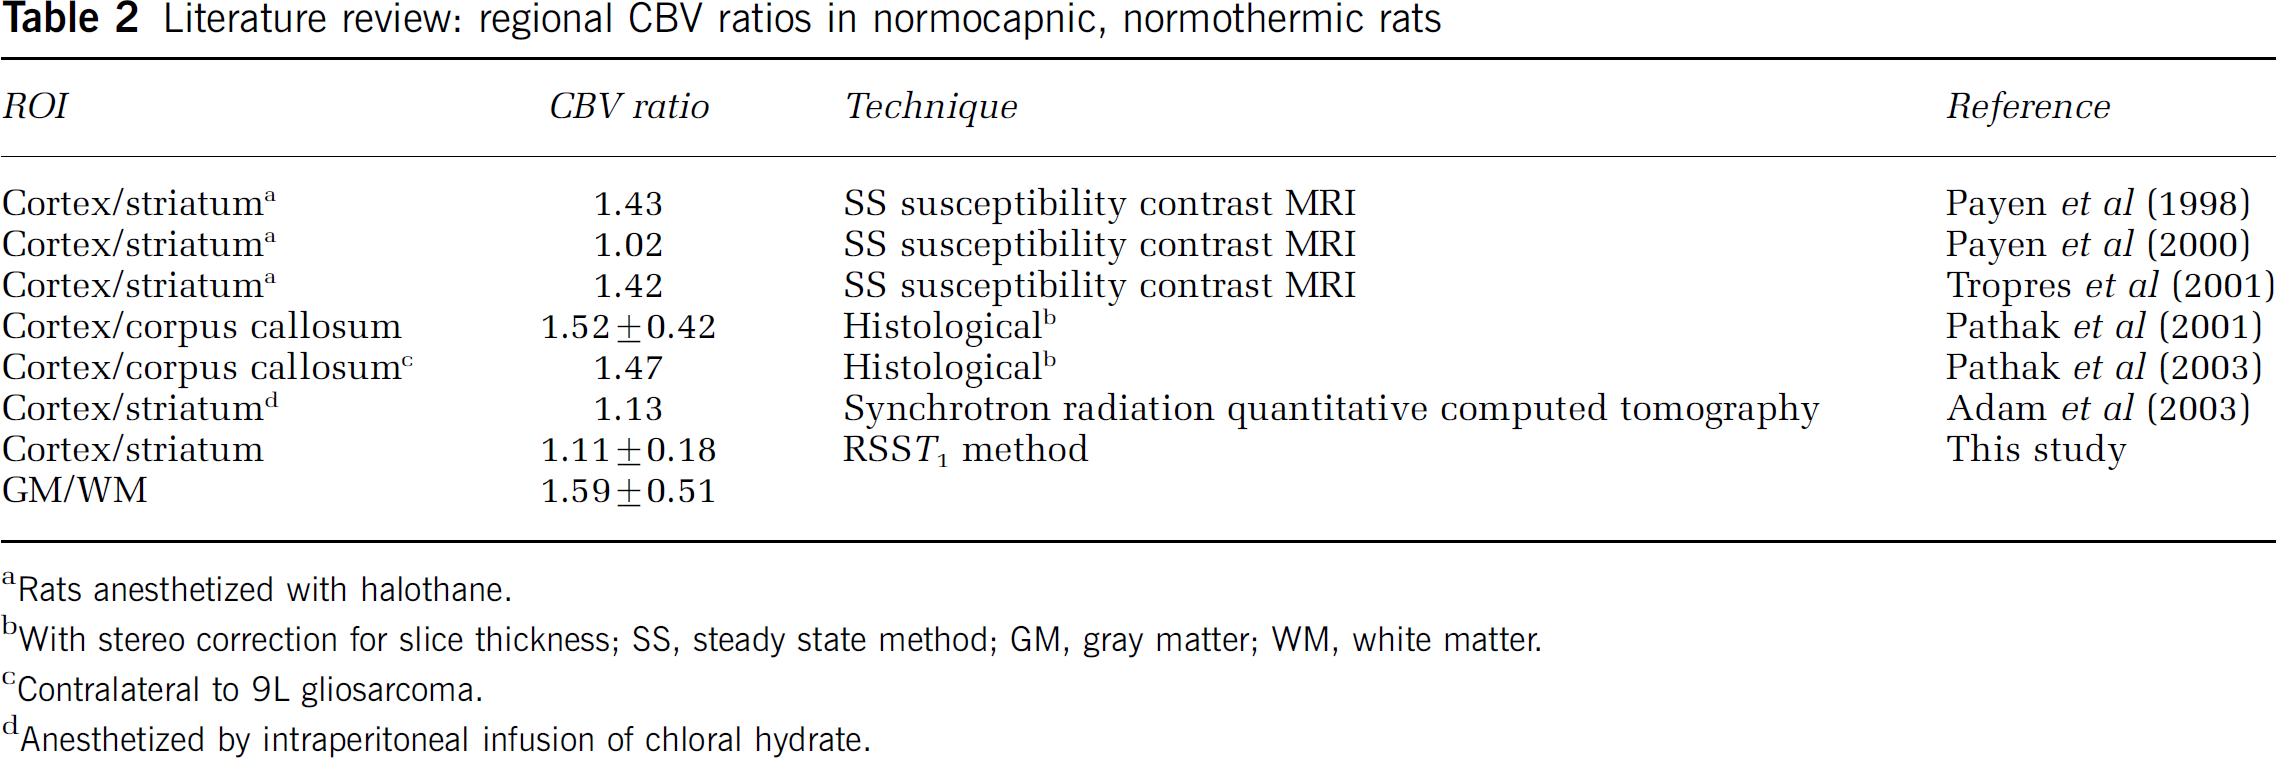
To verify whether postinjection the rapid steady-state regime is attained, in vivo dose studies were performed to establish the duration of the steady state for the injected CA dose. The minimal dose required was determined from a study on six rats using different doses of Gd-DOTA (0.01 to 0.15 mmol/kg; n=3; Figure 2A) and P760 (2 to 35 μmol/kg; n=3; Figure 2B). In another experiment, the steady state resulting from 0.1 or 0.2 mmol/kg P760 was compared (n=2; Figure 2C). The CA doses were delivered in increasing order. The delay between successive injections was 30 mins for Gd-DOTA and 60 mins for P760, except for the dose of 0.1 mmol/kg P760 after which an elimination interval of 90 mins was allowed.
CA dose studies on healthy rats. Each symbol corresponds to one signal acquisition averaged over the whole brain. The injection of the CA is administered 15 secs after the start of the acquisition. (
Moreover, the T1 of the cerebral parenchyma was measured in vivo, as well as in vitro in blood sampled before and during the first minute after 0.1 mmol/kg P760 injection (at 20°C). The IR-FLASH imaging sequence was used in vivo and also in vitro in addition to a spectroscopic IR-sequence.
Finally, to ensure the validity of equation (3A), the blood volume was measured in NMR-tubes with blood sampled as described above, anticipating a value of 100%. In this case, the Spost and the Spre signals are obtained from ROIs in the tubes containing blood with and without CA, respectively. The S0 acquisition provides the corresponding S0post and S0pre signals, respectively.
Image Processing and Analysis
Image processing and analysis were carried out on Sun Sparc workstations (Sun Microsystems Inc., Mountain View, CA, USA) using home-made software written in IDL (Interactive Data Language). Images were Fourier interpolated on a 128 × 128 matrix. Regions of interests were manually delineated guided by the angiographic image, so as to avoid large vessels. Signal intensities within ROIs were averaged and plotted as a function of time. Spost was obtained as an average signal from at least 90 acquisitions (about 70 secs) performed during the steady-state regime after bolus injection. The Spre and S0 signals were obtained by averaging over an equal time interval. With the infusion-technique, all signals were averaged over 20 mins.
The program displays a CBVf histogram for the chosen ROI, computes its statistic parameters, and displays a CBVf map in a gray scale.
The CBVf maps were computed pixelwise using the following equation, where the signal Spre is subtracted to exclude residual signal contribution:
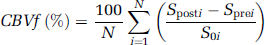
where N is the number of averaged acquisitions, and the index i refers to the image acquisition. The regional CBVf is computed similarly, on the basis of averaged CBVf values within an ROI. Global CBVf measures were obtained from an ROI covering most of the brain structures visible on the slice. When the CBVf is given for a particular rat, the standard deviation (s.d.) refers to the signal fluctuations over time. All data averaged over n individual experiments (in vivo or in vitro) are given as mean±s.d. Cerebral blood volume fraction ratios are calculated for each individual rat, before averaging over n rats.
Statistical significance of CBVf differences between cerebral structures were tested using one-way analysis of variance for repeated measures, followed by a Bonferroni multiple comparison test.
The SNR was measured for an ROI covering the whole brain slice. Spost is calculated by averaging over 90 acquisitions obtained during the rapid steady-state regime:
where
Results
Results of the Preliminary Experiments
Figure 2A shows that a steady state of about half a minute (between the two arrows) is obtained with a dose of 0.15 mmol/kg Gd-DOTA, while a dose of 35 μmol/kg P760 already results in a constant signal intensity for more than half a minute. Other experiments show that a dose of 0.2 mmol/kg Gd-DOTA leads to a steady-state duration of more than one minute, so that a series of 90 acquisitions can be averaged to lead to a sufficient SNR. In experiments performed with 0.1 and 0.2 mmol/kg of P760 (Figure 2C), the same maximum intensity is reached, demonstrating that the intravascualar signal indeed reaches its equilibrium value and that it remains constant over a longer period with 0.2 mmol/kg, as expected. Subsequent CBVf experiments were performed with 0.1 mmol/kg of P760 because, with this dose, the intravascular signal kept its equilibrium value for almost 5 mins with convenient SNR for CBVf measurements, and because it is equivalent to the Gd3+ dose used with Gd-DOTA in clinics.
All T1 measurements, in vivo for the cerebral parenchyma (1206±214 ms, n=7) and in vitro on blood sampled before (1450±34 ms, n=5) and during the first minute after administration of 0.1 mmol/kg of P760 (47±6 ms, n=5), confirm that at TR=750 ms the conditions of the RSST1 method are fulfilled (Figure 1). Therefore, under these experimental conditions, the blood signal completely recovers after inversion, while the tissue signal is suppressed.
Normocapnic Cerebral Blood Volume Fraction Measurements
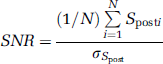
Figure 3A shows the anatomic details of the rat brain on an IR-FLASH image taken in the coronal orientation. Figure 3B shows the corresponding IR-FLASH image obtained 75 secs after a P760 injection of 0.1 mmol/kg with the sequence parameters for suppression of the signal from extravascular brain tissue. Only larger vessels are clearly visible, such as the superior sagittal sinus and straight sinus, and part of the pterygoid plexus, as well as the contrast in extracerebral tissue. The diagram in Figure 3C illustrates the averaged signal intensity in the depicted ROI before, during, and for about 5 mins after CA injection.
(
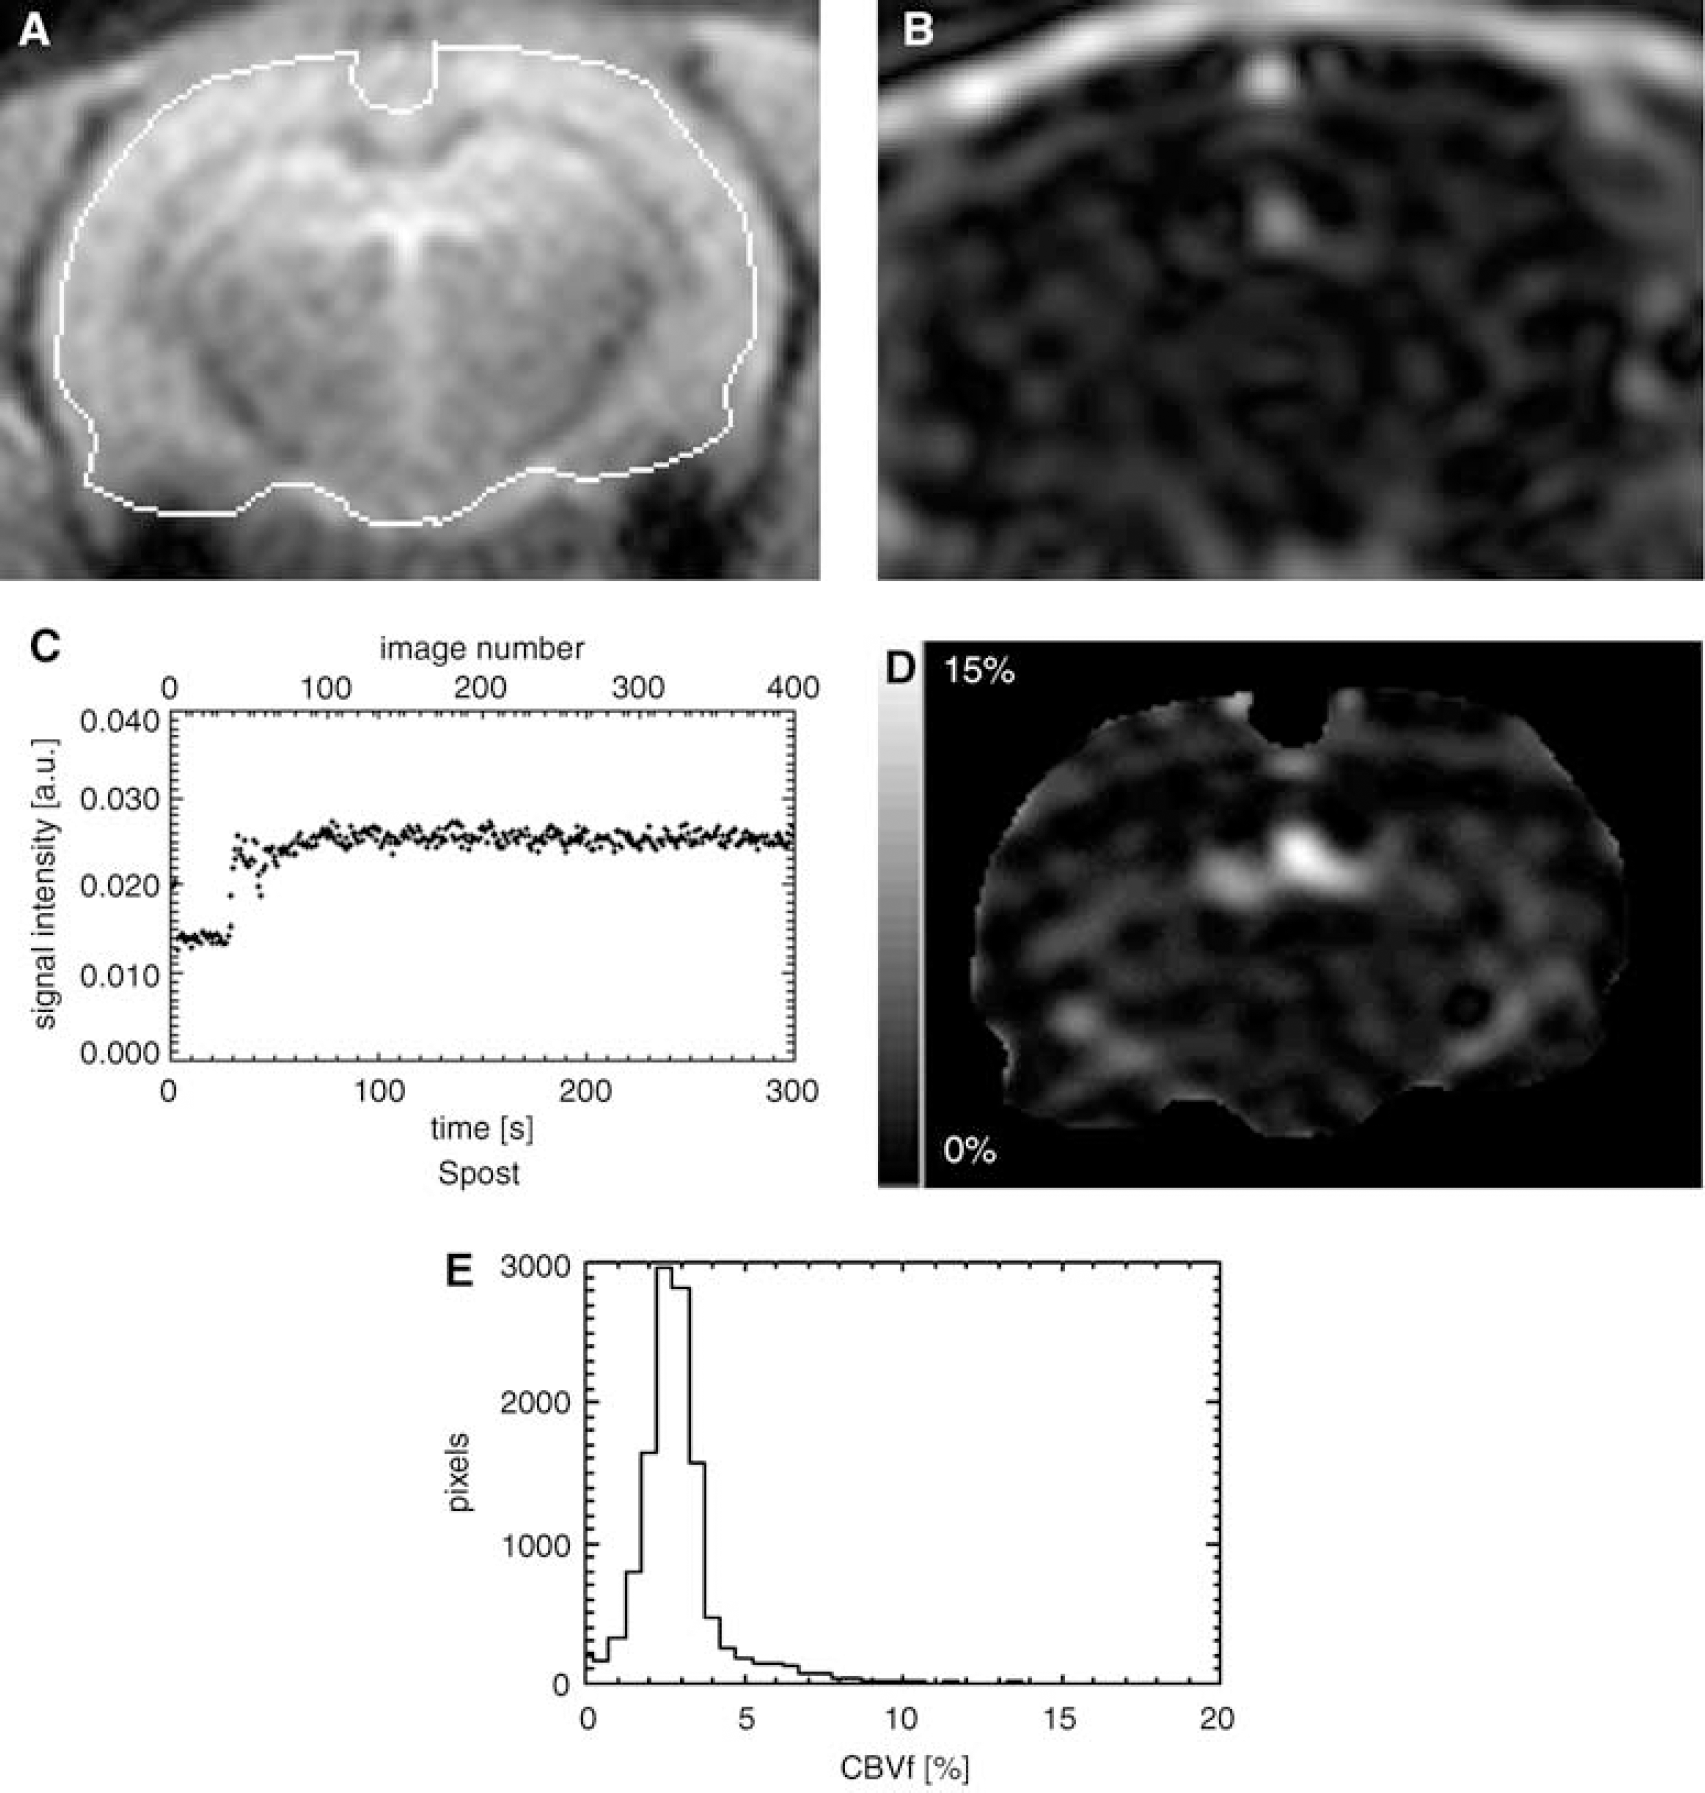
For the normocapnic rat brain under isoflurane anesthesia, the average global CBVf values were 3.29%±0.69% (n=15) using 0.1 mmol/kg P760, and 3.37%±0.41% (n=4) using 0.2 mmol/kg Gd-DOTA. The s.d. reflects intersubject variability, variations in slice position and noise. These results are similar and in good agreement with values reported in the literature for rats (Table 1).
Literature review: regional CBV (healthy regions) in normocapnic, normothermic, anesthetized rats
Rat anesthetized with halothane.
14C-dextran labeled plasma and 99mTc-labeled red blood cells.
Rat anesthetized with isoflurane.
Rat anesthetized with intraperitoneal pentobarbital.
Contralateral to C6 glioma, under moderate hypoxia, rats anesthetized with halothane.
Contralateral striatum to C6 glioma, rats anesthetized with intraperitoneal thiopental.
With stereo correction for slice thickness; SS, steady state method.
Anesthetized by intraperitoneal infusion of chloral hydrate.
Figure 3D displays a representative CBVf map (same slice as in Figures 3A and 3B). Extracerebral vessels and tissue are masked. For this rat, the global CBVf on this slice yields 3.28%±0.24% including a macroscopic intracerebral vessel. Figure 3E illustrates the spatial distribution of the CBVf values within the slice. A step size of 0.5% was chosen allowing histograms of a given ROI from different rats to be comparable.
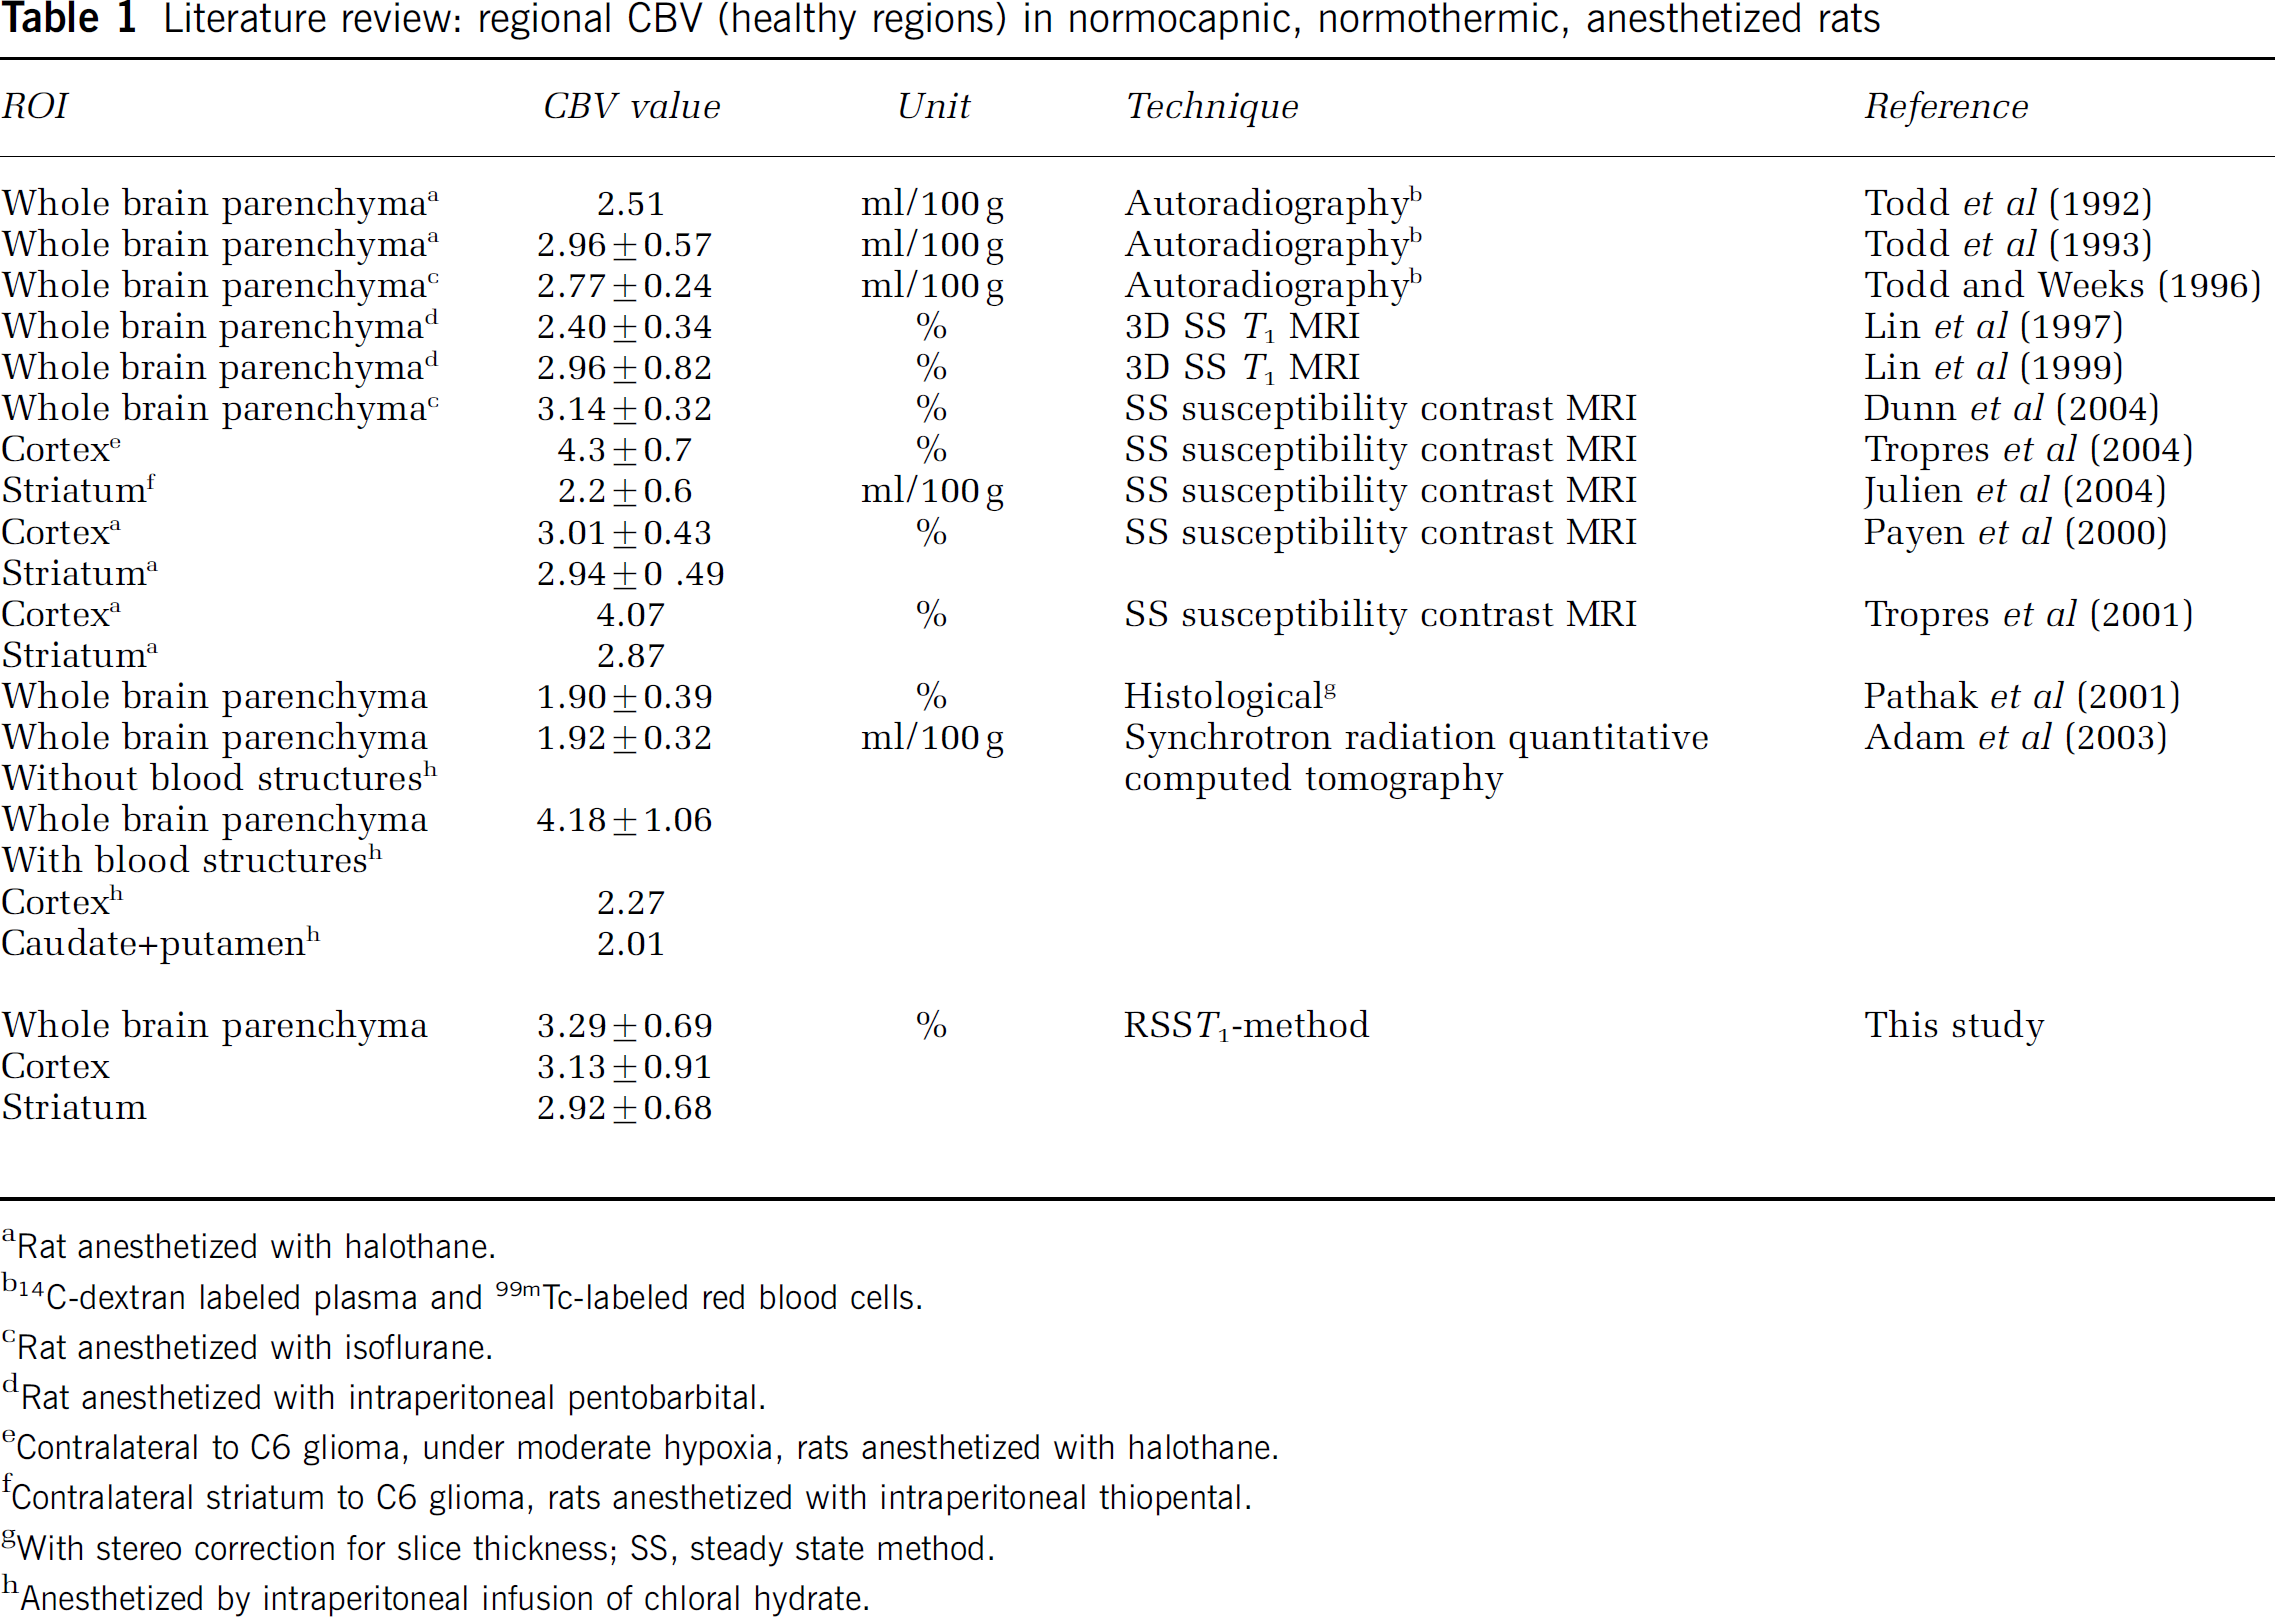
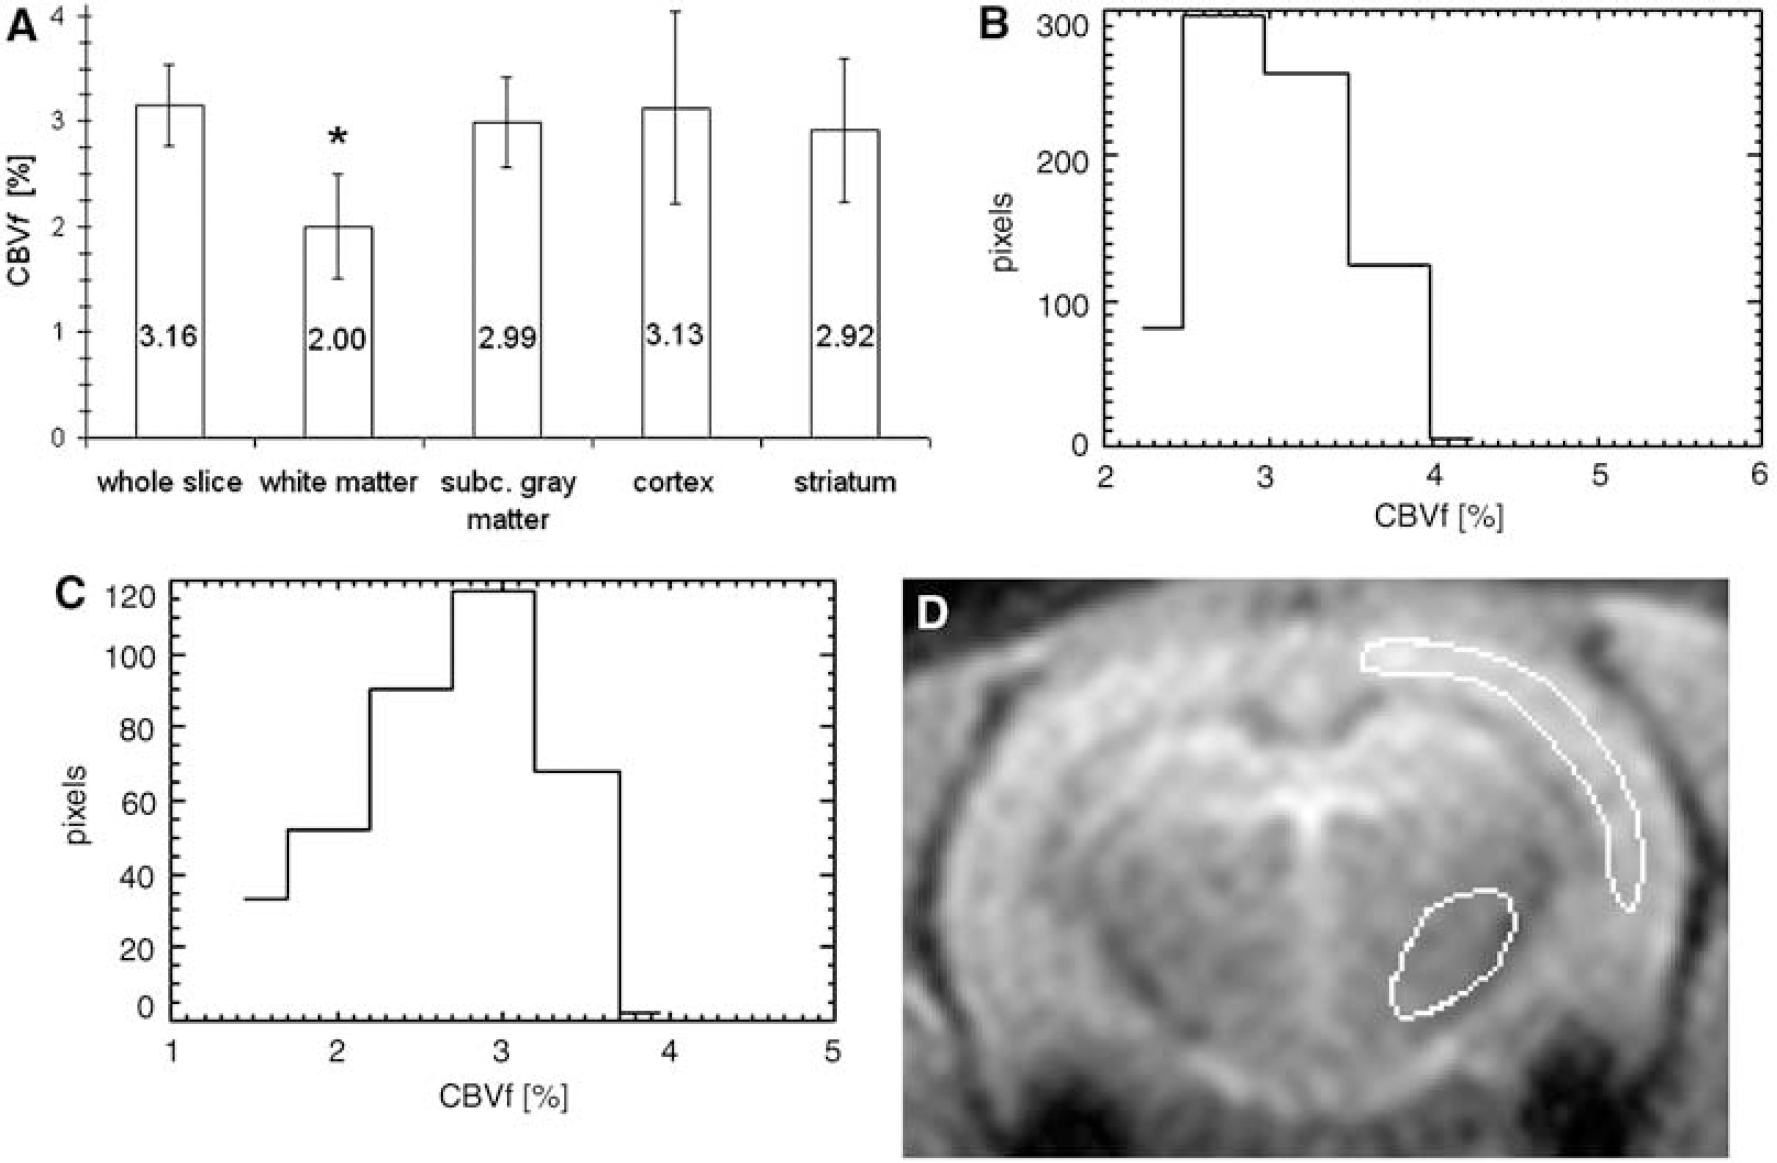
Global CBVf values were obtained with a mean SNR of 40±18 calculated according to equation (4) and averaged over 15 rats. As the SNR is defined, it also reflects the temporal stability of the signal Spost. This SNR allows consistent regional CBVf measurements for different structures of the rat brain, as shown in Figure 4A (n=6). For instance, the blood volume fraction of 2.92%±0.68% in the striatum, which is a mixture of gray and white matter as it is traversed by fibers from the cortex, is lower than the blood volume fraction of pure gray matter such as the cortex (3.13%±0.91%) and higher than the one of white matter (2.00%±0.50%) in accordance with (Adam et al, 2003). The ratios of regional CBVf between cortex and striatum CBVfcortex/CBVfstriatum of 1.11±0.18 as well as between gray matter and white matter CBVfGM/CBVfWM of 1.59±0.51 obtained in healthy normocapnic rats (n=6) are also in the range reported in the literature (Table 2). The difference between the CBVf in the white matter and in the striatum is significant (P<0.05). The difference between the CBVf in the white matter and the one in the cortex, in the subcortical gray matter as well as of the whole slice is highly significant (P<0.01). Although these measures experience partial volume effect, regional CBVf values appear consistent.
(
Literature review: regional CBV ratios in normocapnic, normothermic rats
Rats anesthetized with halothane.
With stereo correction for slice thickness; SS, steady state method; GM, gray matter; WM, white matter.
Contralateral to 9L gliosarcoma.
Anesthetized by intraperitoneal infusion of chloral hydrate.
Figures 4B and 4C illustrate the CBVf histograms of two ROIs centered on the left parietal cortex and the left striatum. While the cortical CBVf is typically approximately 3% to 4%, a large portion of the striatum has a CBVf less than 2%. This may reflect the heterogeneous structure of the striatal tissue, but the partial volume effect probably also contributes to this heterogeneity. Figure 4D depicts the shape and the position of the ROIs within the brain slice. For this rat, the average cortical and striatal CBVf were 3.12%±0.88% and 2.77%±1.51%, respectively. An ROI placed in a large vessel never yielded 100% blood volume, but values around 70%.
A steady-state regime was also obtained under continuous CA infusion and maintained up to 1 hour. Under normocapnic conditions, the CBVf fluctuations did not exceed 9% of the mean CBVf throughout the infusion duration, which could be interpreted as physiologic variabilities.
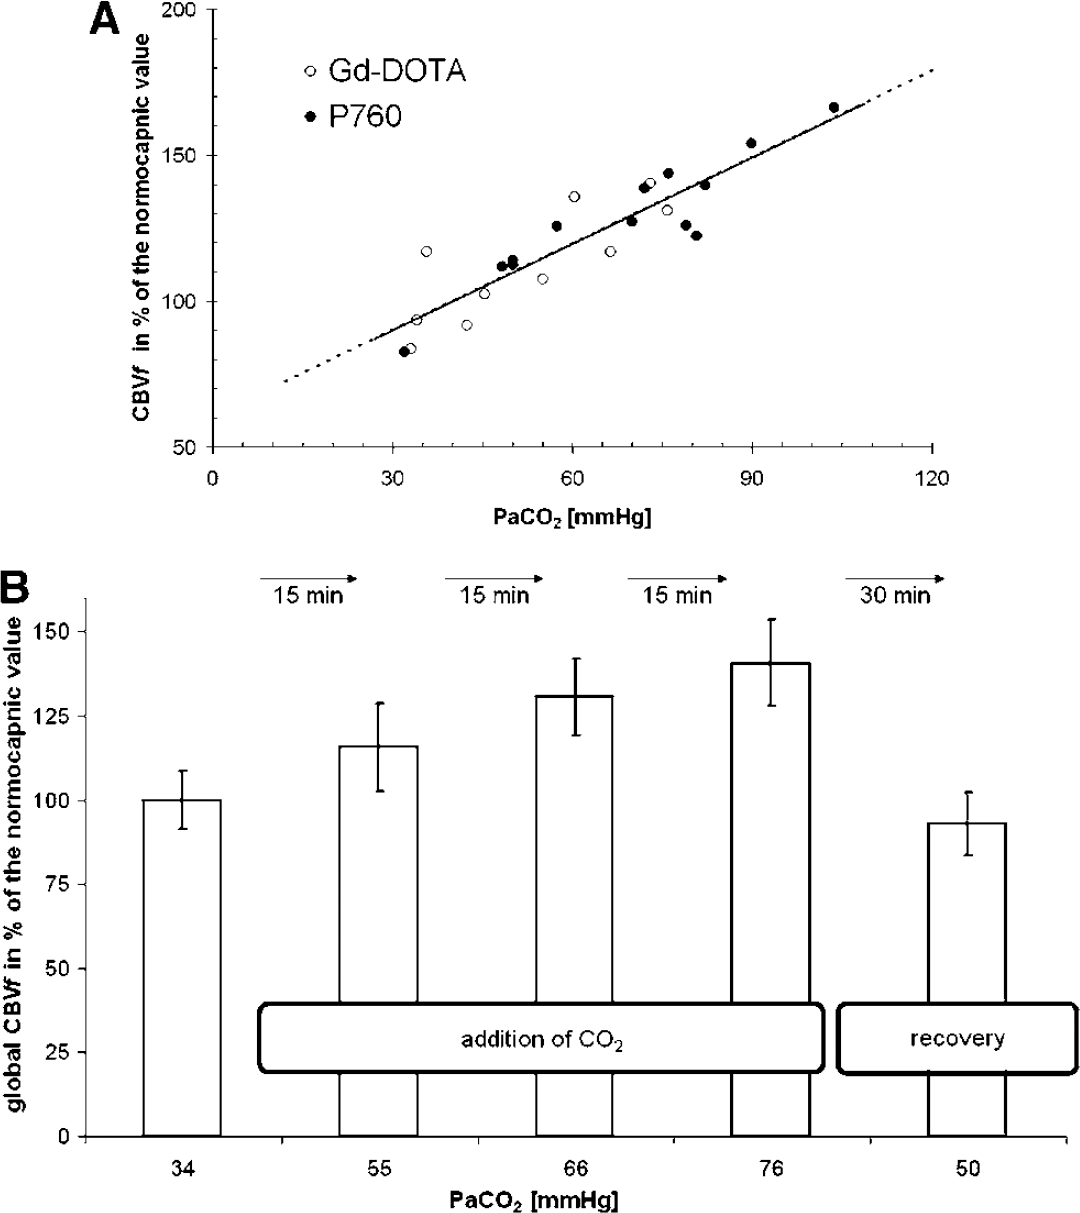
Cerebral Blood Volume Fraction-Measurement Under Hypercapnia
Figure 5A shows global CBVf changes as a function of the PaCO2. The CBVf changes are given relative to the normocapnic CBVf, calculated for each rat from the experimental data for a PaCO2 value of 40 mm Hg, assuming a linear relationship between the global CBVf and the PaCO2. The slopes obtained with P760 (n=5) and Gd-DOTA bolus injections (n=3) are identical, and equal to about 1% mm Hg−1. Regional analysis reveals that CBVf increases under hypercapnia are steepest for the cortex and surprisingly more pronounced on the left side (1.3% per mm Hg, n=8, Gd-DOTA and P760 experiments combined). The CBVf increase under hypercapnia is in the range of those reported in the literature (Payen et al, 1998; Shockley and LaManna, 1988). A steeper increase in the left neocortex in rats has also been observed (Payen et al, 1998). This study confirms the sensitivity of the method to physiologic CBVf variations.
(
Figure 5B shows the result of an experiment in which 30 mins recovery has been allowed after three increasing levels of hypercapnia, showing the reversibility of the CBVf change. While the PaCO2 measured during recovery is still higher than the normocapnic one, the CBVf decreases to a lower value than under normocapnia. A similar undershoot of CBVf has been observed in rats by Payen et al (1998) predominantly for the striatum during recovery after inhalation of CO2, and in cats by Hamberg et al (1996) after transient ischemia.
Discussion
In this study it was shown how the CBVf can be obtained in a direct way, using rapid MRI in combination with the T1-shortening effect of intravascular paramagnetic CAs. The experimental conditions (sequence parameters and CA dose) for obtaining a rapid steady-state regime with the proposed method were studied, resulting in the selective measurement of the intravascular signal. The method leads directly to the blood volume, and not to the plasma volume, because of the rapid water exchange between erythrocytes and plasma (Herbst and Goldstein, 1989). This is confirmed by the measurements on blood samples (n=7), in which the Spost/S0post ratio equals 0.997±0.090 (i.e., 100% blood volume) anywhere in the tube, independent of the local hematocrit value.
In spite of the short TE in this study, the acquired signal might be attenuated by transverse relaxation effects, which have been evaluated.
The way it has been measured, the ratio S0post/S0pre corresponds to the factor exp(−(ΔR2+ΔR2∗)·TE). ΔR2 is due to the transverse relaxivity of the CA and the ΔR2∗ effect is due to the dephasing of the extravascular spins in the gradient field created by the susceptibility difference between the extra- and intravascular compartments. This latter effect does not need to be taken into account in this method since the extravascular magnetization is suppressed.
In vivo, a CBVf of 100% was never attained in a large vessel, which might be because of partial volume contribution from adjacent tissue and the R2 attenuation of the Spost signal induced by the CA (transverse relaxivity of P760 r2=33.9±2.3 (mmol/L)−1 sec−1 (Fonchy et al, 2001)). The ratio S0post/S0pre measured on blood samples was equal to 0.90±0.17 (n=4). For a P760 concentration of 1.5 mmol/L in blood, the factor exp(−ΔR2·TE) is 0.86, almost equal to the ratio found experimentally. In brain parenchyma, the transverse relaxation effect appears negligible, since in this case the ratio S0post/S0pre equals 1.02±0.03 (n=2). Moreover, the signal amplitude during the early part of the steady state (when the R2∗ effect is most pronounced) was equal for 0.1 and 0.2 mmol/kg P760, as can be seen in Figure 2C, also demonstrating a negligible transverse relaxation effect in the microvasculature.
The different results obtained from the microvasculature and in the blood samples, simulating large vessels, might be explained by various mechanisms. In the microvasculature, the R2 effect is probably masked by the small volume fraction or by transverse relaxation mechanisms in blood (Gillis et al, 1995). In blood, transverse relaxation is predominantly due to the diffusion of water through the field gradient arising from the susceptibility difference Δχery/plasma between erythrocytes and plasma. The Δχery/plasma depends on the oxygenation, on the hematocrit and on the susceptibility of the plasma modified by the CA injection. In the blood samples or in large veins, the transverse relaxation effect is probably more pronounced, because the blood oxygenation is lower and the hematocrit is higher (Cremer and Seville, 1983) than in microvasculature. To avoid CBVf underestimation because of the transverse relaxivity of CA, S0 has to be measured after injection, or the signal can be acquired in a spiral or projection—reconstruction mode with an echo time of 10 to 100 μs.
Another aspect affecting the accuracy of the CBVf measurement is the water exchange across the BBB. Whether it can be considered negligible was evaluated here. The exchange regime (slow or fast) depends on the difference between the longitudinal relaxation rates of the intravascular T1(iv) −1 and extravascular T1(ev) −1compartment, and on the water exchange rate τexch −1.
Assuming an approximate microvascular blood volume of CBVf=3%, and an intracapillary residence time τiv of 500 to 650 ms (Labadie et al, 1994), the extravascular residence time τev=(Vev/Viv)τiv is in the order of 16 to 21 secs, respectively. The water exchange rate (τexch−1=τiv−1+τev−1) is thus in the range of 1.6 to 2.1 secs−1. The difference of the longitudinal relaxation rates between the two compartments is in the order of 20 secs−1 (calculated from the experimental data), fulfilling the condition for the slow exchange regime τexch−1≪T1(iv)−1−T1(ev)−1 and therefore supporting the two-compartment model without exchange. However, the exchange effect on the CBVf measure can be evaluated using the model described in Moran and Prato (2004), defining an exchange regime as K=(1+τexch/m)−1, where m is the characteristic time of the two relaxing compartments m=((1/T1(iv))−(1/T1(ev)))−1. The impact of the exchange regime (K=0 no exchange, K=1 fast exchange) modifies the intrinsic T1 of either compartment resulting in apparent relaxation times (T1app). These are calculated according to
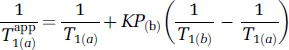
where a and b denote the compartments and P(a) or P(b) are the corresponding compartment volume fractions.
Using the magnetization values supplied by equation (1) for T1app and Tinv=325 ms, equation (3B) yields an apparent CBVf of 3.27%, which corresponds to an overestimation of less than 10%. For an exchange time of τexch=500 ms the overestimation is less than 12%.
For the vascular space occupying method (Lu et al, 2005), a rough estimation of the water exchange impact using the reported intrinsic and extrinsic MRI parameters for 1.5 T indicates that for τexch=630 ms (K=0.2841 after CA administration) the CBVf is overestimated by almost 75% (5.2% instead of 3% for T1(ev)=1000 secs).
Since the permeability of the BBB to water increases for several brain pathologies, it is important to minimize the sensitivity of the RSST1 method to transepithelial water exchange. The water exchange effect can be reduced by shortening Tinv, allowing the system less time to exchange water across the vascular boundary (Larsson et al, 2001). For example, with the couple of parameters TR=500 ms and Tinv=225 ms, the overestimation would be reduced to less than 4% for T1(iv)=Tinv/5 and τexch=630 ms.
The RSST1 method, as it is conceived, is nonsubtractive. Experimentally, for an ROI comprising the whole brain, a residual signal Spre of 2% to 3% of the total S0 was detected before injection, higher than the theoretical value for an average tissue T1 of 1200 ms (0.6% of S0). This residual signal was eliminated by subtraction of the precontrast acquisition from the postcontrast acquisition. The level of the residual signal was systematically higher by a factor of 1.5±0.2 (n=6) for the white matter of the corpus callosum than for the cortical gray matter, suggesting that Spre is predominantly a result of low white matter T1. Another contribution comes from the fact that the lines of k space are not acquired at exactly the same inversion time. Studies performed under CA infusion (data not shown) demonstrated that with TR=500 ms and Tinv=225 ms, the suppression of the extravascular signal is more efficient (2.4%±0.4% instead of 2.9%±0.4% of S0, n=3), with a theoretical value of 0.07% of S0 for T1=1200 ms.
Comparison of regional CBVf obtained with the RSST1 method and a ‘Gold Standart’ technique on the same animal is the best way to validate the method. Unfortunately, at the laboratory, the only alternative technique available for CBV quantification requires the injection of USPIO (ultrasmall superparamagnetic iron oxide). The absolute CBV could only be comparable between the two measures if the first injected CA were completely eliminated. During the washout time (at least 2 h after injection of P760), it was observed that it is difficult to maintain constant the physiologic parameters of the rat, which is a sine qua non-condition for CBVf comparison.
The experiments reported in Tropres et al (2004), Julien et al (2004) and Payen et al (2000) were performed on Wistar and Sprague—Dawley rats under the same conditions using the same equipment and the regional CBVf values obtained were in good agreement (Table 1).
The experimental CBVf values reported in Table 1 are obtained with different techniques and depend on the origin of the measured signals and on the available SNR. Although comparison is not easy, all CBVf values reported from literature are in the same range, and even regional measurements can be compared with the ones obtained with the RSST1 method, which has the advantage of leading directly to absolute CBV values.
This method is insensitive to inflow—outflow effects since a spatially nonselective inversion pulse is used. The maps were obtained with a satisfactory SNR required for measuring the small blood signal with a spatial resolution of 0.75 × 0.75 × 2 mm3. In the human brain, this spatial resolution is largely sufficient to distinguish brain structures without partial volume effect, but in the rat brain, this effect is certainly not negligible.
Since the technique is independent of the type and speed of the CA injection, the feasibility of the CBVf measurement under continuous intravenous infusion was demonstrated. The conservation of a steady-state regime over the duration of the infusion offers the possibility to acquire images with increased in-plane resolution or in 3D mode, as well as to study CBVf variations induced by drugs, cerebral activation, or modified physiologic parameters (e.g., PaCO2). This technique could also be interesting for the evaluation of BBB disruption. In this case, CA extravasation from the brain capillaries should be observable as an irreversible increase of the steady-state signal amplitude, similar to the findings of Seo et al (2002). However, it requires large amounts of CA. Accumulation of the CA could take place in the body after prolonged infusion, associated with an enhanced R2∗ effect. However, CBVf measures up to 60 mins after the initial bolus injection did not show large variations.
To apply the RSST1 method in the presence of brain pathologies, and in particular brain tumors, Gd-DOTA cannot be used, since this method requires CA that do not leak across an impaired BBB during the measuring time.
Finally, the CBVf response to changes in PaCO2 demonstrates the sensitivity of the RSST1 method. The CBVf reversibility under recovery from hypercapnia shows that the CBVf changes are neither due to prolonged isoflurane anesthesia nor to repetitive CA injection.
Brain activation results in CBV variations of similar amplitude as under hypercapnia (Ito et al, 2003). The RSST1 method could therefore be a promising tool for functional MRI particularly because absolute CBV values are directly obtained. Furthermore, its knowledge is useful to interpret the complex BOLD signal.
Conclusion
In this article, we show the feasibility of the RSST1 method, a new MRI method for CBV quantification. This method is rapid, simple, and the measure leads directly to the blood volume. The RSST1 method has been validated on the rat brain and its sensitivity to CBV increases induced by hypercapnia has been shown. Compared with other quantitative MRI techniques, neither additional relaxation time measurements nor knowledge regarding the arterial input function are required. It is also insensitive to inflow—outflow effects of circulating blood protons. The transverse relaxation effects were evaluated and were found negligible in the microvasculature. The water exchange effect was quantified, indicating that the mean CBVf of 3.3% obtained experimentally corresponds to a CBVf of 3.0% after correction.
P760, an experimental CA, was used for its high longitudinal r1 relaxivity to obtain full relaxation of the intravascular magnetization when using a short TR needed for tissue signal suppression. However, with 0.2 mmol/kg Gd-DOTA (twice the usual clinical dose), which is well tolerated, similar CBVf measures were obtained. Therefore, the method could be extended to human studies. In this case, because of the better spatial resolution, the regional CBVf measures would be less affected by the partial volume effect.
To apply this method to cerebral pathologies, high relaxivity CAs, which remain confined to the intravascular space even in presence of pathologies of the BBB are needed. A new CA composed of modified cyclodextrins and complexed to Gd3+ is under evaluation (Lahrech et al, 2005, 2006).
Footnotes
Acknowledgements
The authors gratefully acknowledge cooperation with Guerbet Laboratories (Aulnay-sous-Bois, France). They also acknowledge their debt to Christoph Segebarth, Boudewijn van der Sanden, and Jean-François Payen for constructive discussions to Regine Farion for the technical support and Association pour la Recherche sur le cancer (ARC) for financial PhD support.
Appendix A
In Figure 6A, the ratios MZ/M0 of the intra- and extravascular compartments are compared in the absence (K=0) and in the presence of exchange (K=0.0765, reflecting experimental conditions). The plots are derived from equation (1) as a function of Tinv with TR=750 ms, and using T1app instead of T1 in the presence of exchange. The different T1app are calculated according to the exchange model above with T1 comparable to those obtained experimentally for each compartment before and after CA injection. The K-value used results from τexch=630 ms. The simulations were performed for an intravascular volume fraction of 3%. Figure 6A demonstrates that the intravascular signal is not affected by the water exchange, while the extravascular signal is less suppressed when exchange takes place.
To show directly to which extent the CBVf is overestimated for K=0.0765, the sum of the intra- and extravascular magnetization is plotted in Figure 6B. Before injection, the exchange regime is characterized by K=0.9170, but the residual longitudinal magnetization is practically identical with or without exchange.