
Abstract
Magnetic resonance imaging (MRI) is an established clinical tool for diagnosing multiple sclerosis (MS), the archetypal central nervous system neuroinflammatory disease. In this study, we have used a model of delayed-type hypersensitivity in the rat brain, which bears many of the hallmarks of an MS lesion, to investigate the development of MRI-detectable changes before the appearance of conventional indices of lesion development. In addition, we have correlated the MRI-detectable changes with the developing histopathology. Significant increases in regional cerebral blood volume (rCBV) preceded overt changes in blood–brain barrier (BBB) permeability, T2 relaxation and the diffusion properties of tissue water. Thus, changes in rCBV might be a more sensitive indicator of lesion onset than the conventional indices used clinically in MS patients, such as contrast enhancement. In addition, we show that BBB breakdown, and consequent edema formation, are more closely correlated with astrogliosis than any other histopathologic changes, while regions of T1 and T2 hypointensity appear to reflect hypercellularity.
Introduction
Magnetic resonance imaging (MRI) is an established clinical tool used for the diagnosis and assessment of multiple sclerosis (MS), the archetypal inflammatory disease of the central nervous system (CNS). The major advantage of MRI is the ability to noninvasively follow the progression of pathology in the brain over time. Contrast-enhancing lesions in MS patients, indicating blood–brain barrier (BBB) compromise, are generally considered to be a sensitive marker for disease activity and are typically observed in the acute stage of lesion evolution (Bruck et al, 1997; Kermode et al, 1990; McFarland et al, 1992; Miller et al, 1993; Thompson et al, 1992). However, the correlation between contrast-enhancing lesions and clinical disability is weak (Miki et al, 1997). The explanation for this may lie in recent work in a rodent model of an MS-like lesion, in which it was shown that axonal injury and inflammatory events are not restricted to the period of BBB breakdown and contrast enhancement (Newman et al, 2001). These findings suggest that MS disease progression persists behind an intact BBB, and, consequently, contrast enhancement might not be an entirely accurate marker of disease activity.
Hyperintense areas on T2-weighted images and hypointense regions on T1-weighted images are also used as indices of disease activity. Acute T2 hyperintensities usually coregister with contrast-enhancing lesions (Lee et al, 1999; McFarland, 1998; Miki et al, 1999; Miller et al, 1998). This increased T2 is generally taken to reflect edema formation as a consequence of BBB compromise (van Waesberghe et al, 1997). However, a spectrum of pathological processes, including demyelination, axonal loss, macrophage recruitment and gliosis, have been shown to correlate with acute T2 hyperintensity (Bruck et al, 1997). Nevertheless, whatever the underlying cause, the correlation between the number of T2 hyperintense regions and clinical disability has been found to be weak (Filippi et al, 1995; Miller et al, 1998; Paty et al, 1994). T1 hypointensities are generally observed in MS lesions after contrast enhancement, in which there is irreversible damage to axons and the surrounding tissue matrix. It has also been shown, however, that early acute lesions may appear hypointense before gadolinium enhancement (Hiehle et al, 1995; van Waesberghe et al, 1997, 1998) although this is not seen consistently enough to be a reliable index of disease activity.
Interestingly, of all the magnetic resonance signals that have been acquired, the parameter that appears to correlate most closely with clinical disability is the level of the putative axonal marker N-acetyl aspartate (NAA) determined by Magnetic Resonance Spectroscopy (MRS). Low levels of NAA have been found in the early stages of MS as defined clinically (De Stefano et al, 1998). At present, however, MRS cannot be used to investigate the spatial distribution of MS lesion load at a clinically valuable resolution, although the advent of high-field clinical scanners may alter this situation significantly.
Thus, there is still a need for more reliable MRI indices of disease progression and markers that reflect early stages of lesion development when therapy might be most beneficial. In the last few years, a few studies have investigated MRI-detectable changes in MS patients that occur before lesion development as detected by conventional MRI methods. Notably, a decrease in magnetization transfer ratio (MTR) has been reported to occur from 1 month to 2 years before contrast enhancement or lesion appearance on T2-weighted images (Fazekas et al, 2002; Filippi et al, 1998; Pike et al, 2000). Such changes in MTR are thought to reflect either progressive demyelination or increases in the free water pool associated with early inflammation. In support of this notion, two studies have demonstrated increases in tissue water diffusion in normal-appearing white matter that later developed lesions detectable by conventional MRI methods (Rocca et al, 2000; Werring et al, 2000). These findings suggest that early development of edema and demyelination, which is beyond the sensitivity of conventional MRI, might be detectable with these alternative methods. Furthermore, these studies indicate that pathological processes are underway long before the development of contrast enhancement and changes in tissue relaxation times. Thus, further investigation of early events in the development of a chronic inflammatory lesion in the brain is warranted.
In this study, we have used a model of delayed-type hypersensitivity (DTH) in the rat brain (Matyszak and Perry, 1995), which exhibits many of the histopathological hallmarks of an evolving MS lesion. Using this model, we have investigated the development of MRI-detectable changes before the appearance of conventional indices of lesion development and also beyond the period of contrast enhancement. We have correlated the MRI-detectable changes with the developing histopathology. In particular, we have made measurements of regional cerebral blood volume (rCBV), which has received little attention previously in studies of either MS patients or in experimental models of MS.
Materials and methods
Animal Preparation
Three-week-old male Lewis rats (Charles River) were anaesthetized with 2% to 3% halothane in a mixture of nitrous oxide/oxygen (70%/30%) and placed in a stereotaxic frame. A midline incision was made in the scalp and a burr hole drilled 1 mm anterior and 3 mm lateral to Bregma. Using a finely drawn glass microcapillary, heat-killed BCG (105 organisms in 1 μL 0.1 mol/L phosphate-buffered saline) was injected stereotaxically over a 5-minute period into the left striatum at a depth of 3.5 mm from the cortical surface. After injection, the wound was closed and the animals were allowed to recover from anaesthesia. Note that the BCG remains sequestered behind the BBB and no acquired immunological response occurs at the site of the BCG deposit. The rationale and histopathological characteristics of this model are well documented elsewhere (Matyszak and Perry, 1995), but, additionally, this model is advantageous for imaging studies, since the site of the inflammatory lesion is known. Four weeks after the intracerebral injection, and after the initial innate inflammatory response to the BCG had resolved, the animals were anaesthetized with halothane once again and an emulsion of 0.75 mg heat-killed BCG organisms in 100 μL complete Freund's adjuvant was injected intradermally into each of the hindlimbs to initiate a DTH lesion in the skin and at the site of the original BCG injection in the brain. A group of control animals were injected intracerebrally with BCG as above, but these animals did not receive the peripheral intradermal challenge.
Magnetic resonance imaging was performed on the animals at 0 (n=18), 5 (n=12), 8 (n=9), 12 (n=9), 19 (n=6) and 31 (n=8) days after peripheral challenge, and in control animals at the same time-points (day 0, n=4; day 5, n=4; day 8, n=4; day 12, n=3; day 19, n=3; day 31, n=2). Cannulae were inserted into a tail vein before the MRI experiment for contrast agent injection. Animals were positioned in an Alderman-Grant resonator (3.4 cm i.d.) using a bite-bar. During MRI, anaesthesia was maintained with 0.8% to 1.2% halothane in a mixture of nitrous oxide/oxygen (70%/30%), ECG was monitored noninvasively and body temperature was maintained at ∼37°C. At the end of each imaging experiment at each time-point, the rats were deeply anaesthetized with sodium pentobarbitone, and transcardially perfused with 200 ml 0.9% heparinized saline followed by 200 ml periodate lysine paraformaldehyde (PLP). All procedures were approved by the United Kingdom Home Office.
Magnetic Resonance Imaging
Magnetic resonance images were acquired using a 7-T horizontal bore magnet with a Varian Inova spectrometer (Varian, Palo Alto, CA, USA). Scout images were acquired to determine the location of the lesion, and a single 1 mm coronal slice centred on the lesion was selected for the full imaging protocol. T2-weighted images were acquired using a fast spin-echo sequence with a repetition time (TR) of 3.0 secs and an echo time (TE) of 70 msecs. Diffusion-weighted images were acquired using a navigated pulsed-gradient spin-echo sequence (TR 2.0 secs; TE 0.41 secs), with diffusion-weighting b values of 125, 750 and 1500 s/mm2, a diffusion time (Δ) of 22 ms and a diffusion gradient duration (δ) of 12 ms. Diffusion gradients were applied separately along three orthogonal axes and apparent diffusion coefficient (ADC) ‘trace’ maps were calculated (Basser et al, 1994). Navigator echoes were used for motion correction (Ordidge et al, 1994). Regional cerebral blood volume maps were generated from time-series images acquired during bolus injection of contrast agent and tracer kinetic analysis (Rosen et al, 1990). A series of 40 FLASH images (Frahm et al, 1986) were acquired (TR 20 ms; TE 10 msecs; Flipangle 20°) at a rate of 1 image every 1.275 secs, during which 100 μL of a gadolinium-based contrast agent (Gd) (Omniscan, Nycomed Amersham, UK) was injected via the tail vein cannula, over a 5-second period from image 8. Spin-echo T1-weighted images (TR 500 ms; TE 20 ms) were acquired both before and 10 mins after Gd injection to look for image enhancement due to BBB permeability. The matrix size and field of view (FOV) were 128 × 128 and 3 × 3 cm2, respectively, for all images, except for the rCBV data, which were acquired with a 128 × 64 matrix and a 3 × 2 cm2 FOV for reasons of increased temporal resolution.
Histologic Analysis
After dissection, the brains were postfixed for several hours in the PLP fixative and then immersed in 30% sucrose buffer for 24 hours to cryoprotect. The tissue was then embedded in Tissue Tek (Miles Inc, Elkhart, USA) and frozen in isopentane at −40°C. Cresyl violet-stained sections (50 μm) were examined for signs of neuronal damage and for the presence of leucocytes. Immunohistochemistry was used to confirm the presence and distribution of specific cell populations. Frozen, 10-μm thick, serial sections were cut from the fixed tissue and mounted on gelatin-coated glass slides. Antigens were detected using a three-step indirect method (Hsu et al, 1981). Macrophages were identified using the mouse monoclonal antibody ED1 (Serotec) (Dijkstra et al, 1985), which stains most macrophage populations including recruited monocytes, but not quiescent microglia. T and B cells were identified using a mouse monoclonal antibody, OX22 (Serotec). In each group of animals, inflammatory cell infiltration was quantified by counting the number of ED1-positive or OX22-positive cells in 10-μm-thick cresyl violet counterstained sections from regions immediately adjacent to the injection site. Three nonoverlapping fields containing the highest density of recruited cells within the parenchyma were chosen and the number of macrophages, or T and B cells, were calculated as an average number per mm2 for each animal. Activation of astrocytes was visualized by anti-GFAP staining, and MHC class II expression was determined with the mouse monoclonal antibody OX6 (Serotec). Regions of reactive astrocytosis or MHC class II expression were quantitated by drawing around the regions using a camera lucida. Acetylcholinesterase chemistry was used to assess neuronal loss. Expression of laminin was detected using a polyclonal rabbit antilaminin antibody (Sigma), which recognizes all laminin isoforms. In addition to laminin staining, Cesyl Violet histochemistry was used to identify dilated blood vessels in and around the lesion. Fields were selected to cover the whole of the hypercellular lesion, and dilated blood vessels were identified and traced using a camera lucida. Drawings of the lesion and dilated blood vessels were scanned and stored as electronic images to enable correlation with MRI changes.
Magnetic Resonance Imaging Data Analysis
ADC trace maps and post-gadolinium T1-weighted images were subjected to an automatic unbiased in-house one-dimensional cluster analysis program (Waddington et al, 1998) to segment regions of signal change. The area and intensity of these regions were then quantified. Regional cerebral blood volume maps were created using standard tracer kinetic analysis of the dynamic susceptibility tracking data. Changes in signal intensity [S(t)] measured in the MRI experiment were converted to concentration of contrast agent [C(t)] using the formula C(t)=K(−ln[S(t)/S0]/TE), where S0 is the baseline signal intensity, TE is the echo time and K is a sequence-dependent constant. Relative cerebral blood volume maps were then generated by integration on a voxel-by-voxel basis to yield the area under the time–concentration curve. The CBV maps were thresholded at a level that was equal to the mean signal intensity plus two standard deviations of the signal intensity of the noninjected hemisphere. This approach allowed areas of increased CBV to be more easily visualized and quantitative analysis was performed on the thresholded CBV maps. Regions of interest (ROIs) were drawn around the injected and noninjected hemispheres to obtain mean signal intensities and areas of elevated CBV identified using the thresholding method (i.e. more than 2 standard deviations above the mean signal intensity of the contralateral hemisphere). The results are expressed as ratios of left/right (i.e. injected/noninjected) CBV to assess hemispheric differences. Regions of interest encompassing areas of both increased and decreased signal intensity were also drawn on the T2-weighted images and ADC trace maps.
The scanned histologic drawings were overlaid on to the MRI images using anatomical markers, such as the corpus callosum, and in some cases, the ventricles, to enable them to be scaled appropriately. In this manner, spatial correlations between histologic and MRI-detectable changes could be determined.
Statistics
Two-way analysis of variance (ANOVA) was used to determine both temporal changes in the MRI parameters measured and differences in these parameters between the DTH and control groups. Post hoc pairwise t-tests were used to identify specific significant differences between time-points or between groups. Correlation analysis was used to determine relationships between histologic and MRI parameters, and the significance of these correlations was tested using paired t-tests. All data are presented as the mean±s.d. for n animals.
Results
Conventional T1- and T2-Weighted Imaging
The site of the initial BCG deposit was visible as a small hypointense region on both T1- and T2-weighted images in all animals, and remained visible throughout the time course. In addition, the region appeared hypointense on proton density-weighted images, although this reduction in proton density could not entirely account for the hypointensities observed on T1- and T2-weighted images (data not shown). In the DTH animals, the space occupied by the hypointense signal increased with time after the peripheral challenge to become maximal at day 19, but the hypointensity was visible throughout the time-course. Histologically, the hypointense regions corresponded to the core area of the lesion, which exhibited increased cellularity before lesion enhancement, and the T2 hypointensity correlated significantly with the number of macrophages/activated microglia that were present in the lesion (r=0.67, P<0.001).
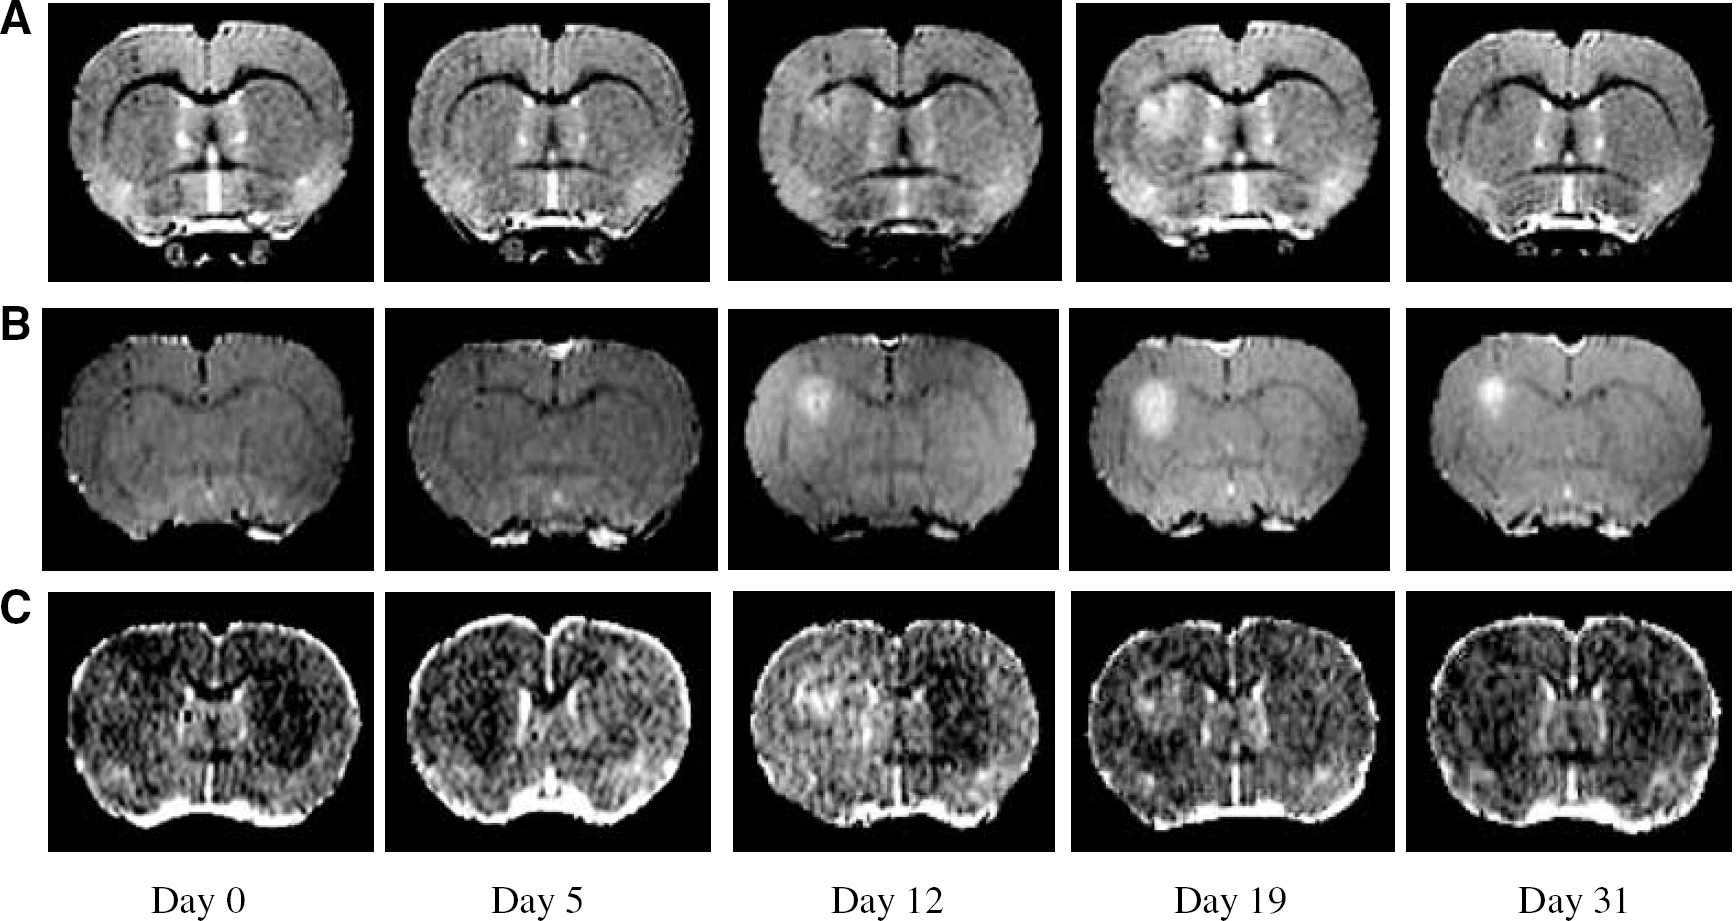
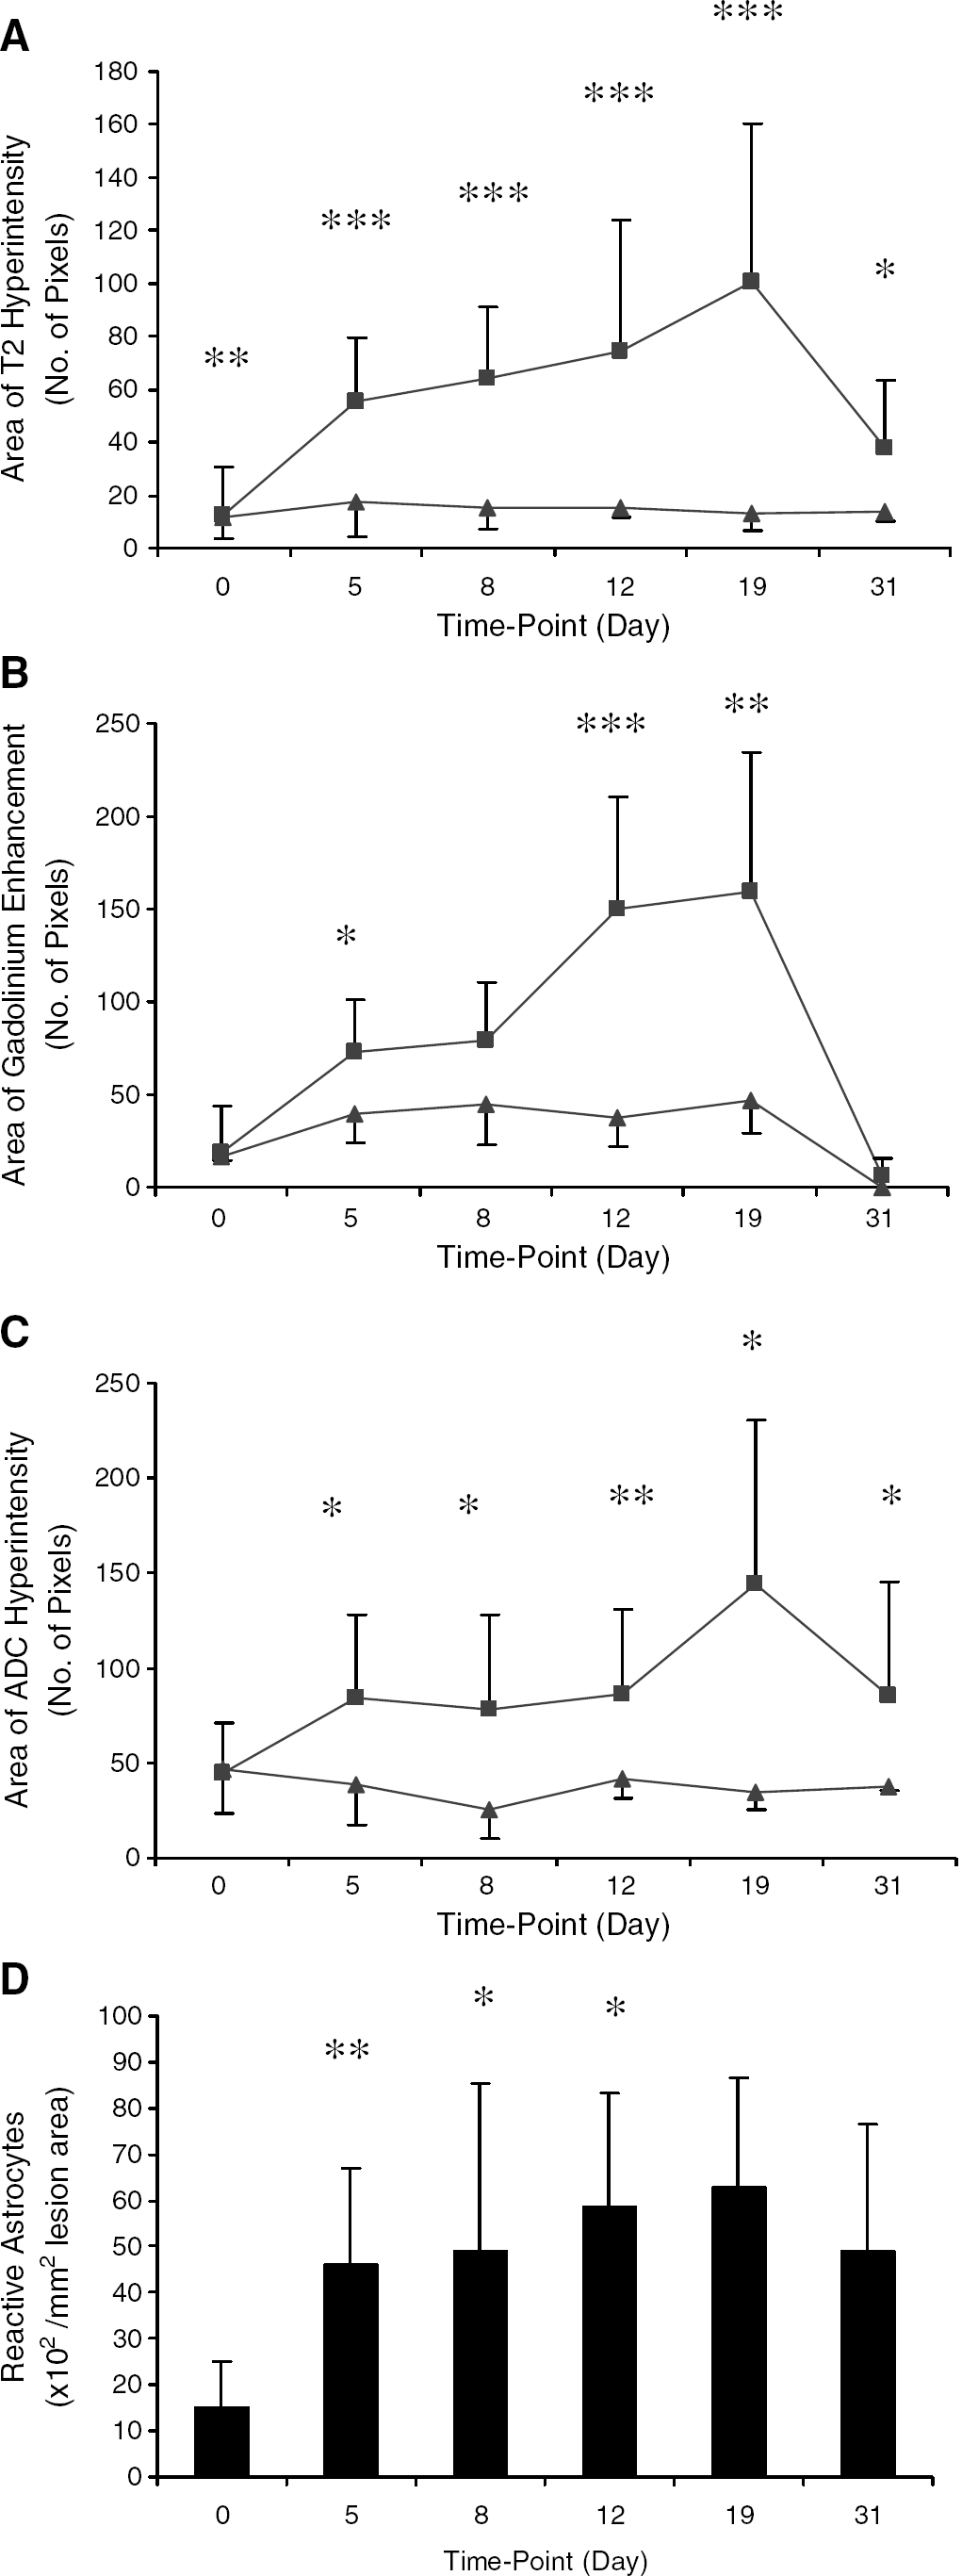
As the DTH lesions evolved, a region of hyperintensity developed around the hypointense core on T2-weighted images (Figure 1A), the area of which was significantly different from control animals at all time-points. At day 5, where present (65% of cases), the hyperintense region was usually restricted to a bright rim of a few pixels around the hypointense core. The area of the T2 hyperintensity increased gradually from day 5 to day 19 (Figures 1A and 2A), and was significantly greater at all of these time-points than at day 0 (unpaired t-tests: P<0.02 at each time-point). In addition, the area was significantly greater in DTH animals than in the control animals at each time-point (unpaired t-test: day 0, P<0.01; days 5, 8, 12 and 19, P<0.005; day 31, P<0.05) (Figure 2A). The area of T2 hyperintensity appeared to be maximal around day 19, after which time-point it decreased significantly (unpaired t-test; day 31 versus day 19, P<0.05; Figures 1A and 2A). A region containing reactive astrocytes mapped spatially to the regions of T2 hyperintensity (Figure 3A), and a highly significant correlation was found between the areas of reactive astrocytes and T2 hyperintensity (r=0.62, P<0.005). In the DTH animals, few GFAP-positive cells (reactive astrocytes) were found surrounding the DTH lesion as early as day 0, but the area occupied by reactive astrocytes changed significantly (ANOVA P<0.01) over time (Figure 2D) and was still evident at day 31. A trivial level of T2 hyperintensity was observed in both DTH and control animals at day 0, which remained constant throughout the time-course in the control group (Figure 2A). This background level of T2 enhancement can be attributed to minor, ongoing effects of the initial BCG injection, which are independent of the induced DTH response and remain constant throughout the time-course studied. Similarly, a very low level of astrocyte activation was evident at day 0 in the DTH animals (Figure 2D).
(
(
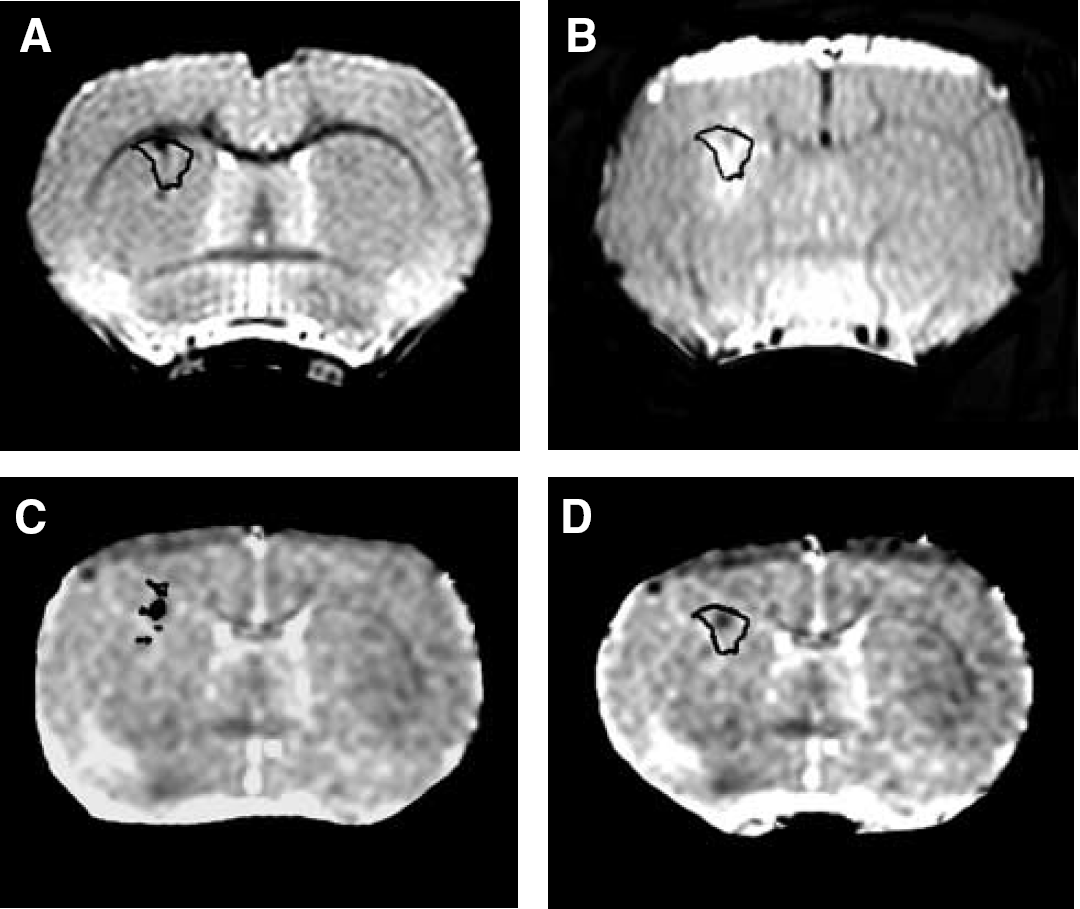
Areas of inflammatory cell recruitment were spatially mapped onto T2-weighted images, post-contrast T1-weighted images, and ADC trace maps, shown here for a single representative animal. (
Contrast Enhanced Imaging
Overt BBB breakdown, as identified by gadolinium-DTPA (Gd-DTPA) enhancement, was clearly visible on post-contrast T1-weighted images in the coronal plane at days 12 and 19 in all the DTH animals (Figure 1B), and persisted until day 31 in a few cases. In a few of animals (23%), contrast enhancement was observed as a rim of slightly elevated signal intensity around the lesion core at day 5. Areas of signal enhancement were quantified from the ROI identified by cluster analysis, which confirmed that the extent of BBB breakdown was time dependent (ANOVA P<0.0001) (Figure 2B). Post hoc testing revealed that the area of BBB breakdown at days 5, 8, 12 and 19 was significantly greater than at day 0 (unpaired t-tests: P<0.0001 in all cases). The areas of T2 hyperintensity correlated spatially with the areas of BBB breakdown, and a highly significant correlation between these areas was found (r=0.56, P<0.005). However, the correlation between the areas of contrast enhancement and the region occupied by reactive astrocytes did not quite reach significance (r=0.42, P=0.078), despite there being a spatial coincidence (Figure 3B). As for the areas of T2 hyperintensity, a trivial level of contrast enhancement was observed in both DTH and control animals at day 0, which remained constant throughout the time-course in the control group (Figure 2B). Again, this enhancement can be attributed to ongoing effects of the initial BCG injection, which are independent of the induced DTH response and remain at a constant background level throughout the time-course studied.
Diffusion Weighted Imaging
Areas of both increased and decreased diffusion were observed on the ADC trace maps. As for the other parameters, a very low level of ADC change was observed in both DTH and control animals at day 0 (Figures 2C and 4A), which remained constant throughout the time-course in the control group, and can be attributed to ongoing background activity arising from the initial BCG injection. Nevertheless, as for the other modalities, significant changes in ADC were observed in the DTH animals compared with the control group after induction of the DTH response. A very restricted rim of increased ADC was observed (47% of cases) surrounding a core of decreased ADC from day 5 (Figure 2C). The area of increased ADC evolved over time in the DTH animals, to become maximal around day 19 (Figure 1C). The regions of increased ADC in the DTH group were significantly greater than those observed in the control group at all time-points. Though slightly larger, the areas of increased ADC tended to correlate spatially with the areas of both T2 hyperintensity and gadolinium enhancement, and, quantitatively, significant correlations were found between the areas of increased ADC and both T2 hyperintensity (r=0.56, P<0.0001) and gadolinium enhancement (r=0.41, P<0.01). Histologically, the area of ADC change (both decreased and increased ADC) most closely matched the area of reactive astrocytes (Figure 3D), but tended to spread slightly beyond the edge of the regions of astrocytosis. Nevertheless, quantitatively, the correlation between the total area of ADC change and the area of astrocytosis was significant (r=0.55, P<0.02).
(
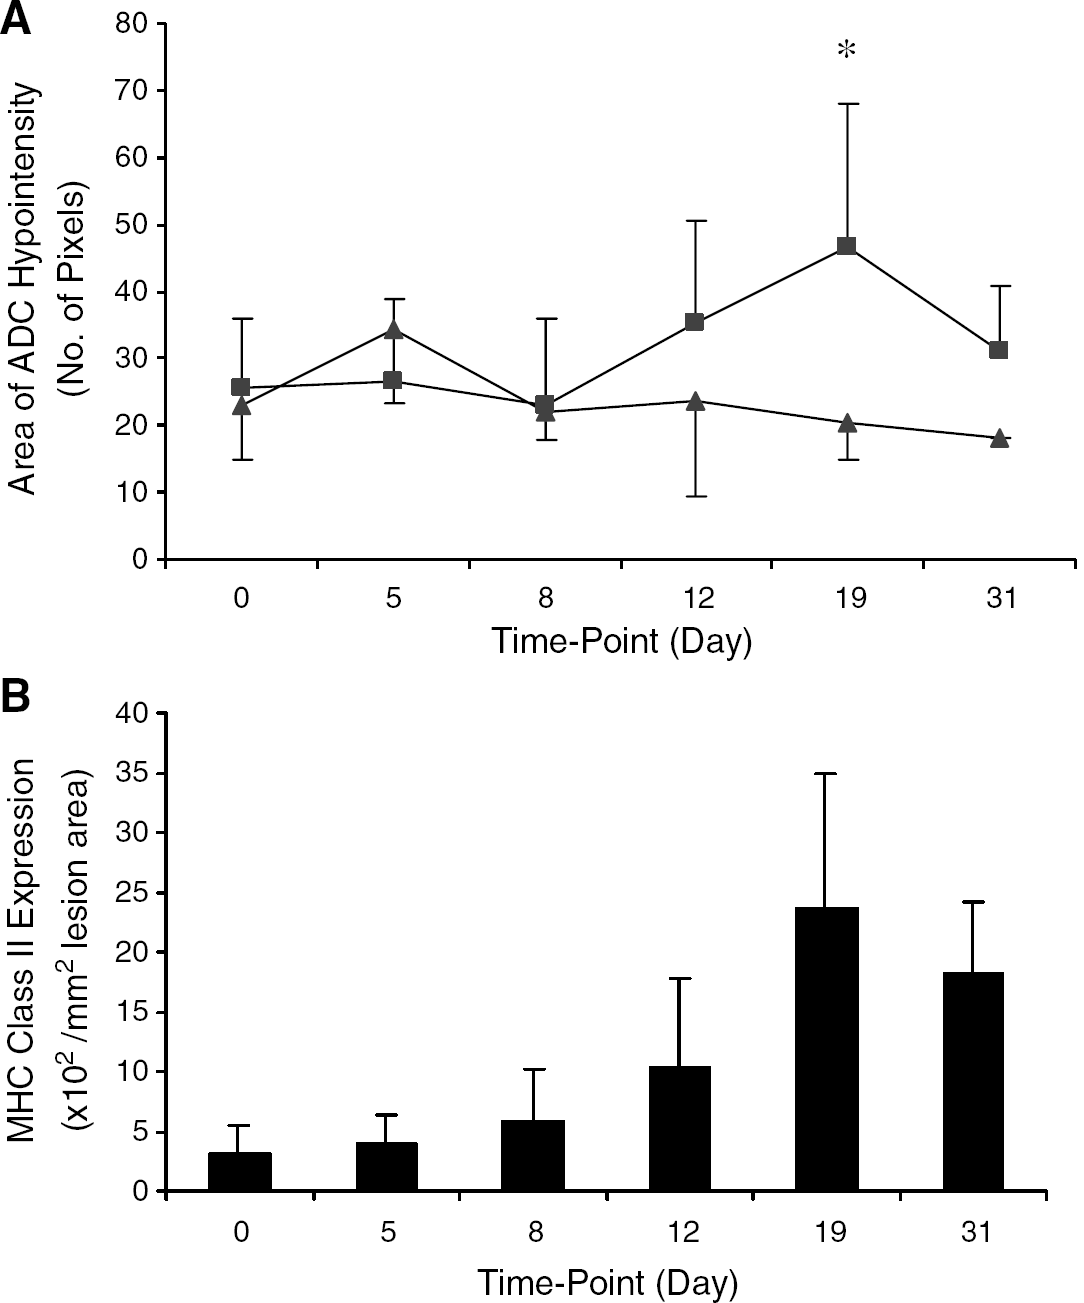
The area of reduced ADC (decreased diffusion of tissue water) was observed at the site of the original intracerebral BCG injection on ADC trace maps in all animals (Figure 1C). This area of decreased ADC correlated spatially with the hypointense regions on T1- and T2-weighted images and also with the area of hypercellularity observed histologically. However, while in the control animals this region remained constant throughout the experimental period, in the DTH animals the area of reduced ADC changed significantly over time (ANOVA P<0.05). The area of reduced ADC in the DTH animals appeared to reach a maximum around day 19 (Figure 4A). On tissue sections from the same slices at the same time-points, the area of reduced ADC correlated both spatially and quantitatively (r=0.69, P<0.001) with areas of MHC class II expression (Figure 3C). The area of MHC class II expression changed significantly over time (ANOVA P<0.0001) with a profile similar to that of the reductions in ADC (Figure 4B), also reaching a maximum at around day 19.
Cerebral Blood Volume Imaging
Focal increases in rCBV surrounding the lesion core were observed in the majority (92%) of the DTH animals at day 5. Moreover, this increase in rCBV occurred before contrast enhancement in 77% of the DTH animals. In the remaining 23% of DTH animals, a small rim of contrast enhancement (but not overt enhancement as observed at later time-points) was observed surrounding the lesion at the same time as the increase in rCBV. This finding may reflect slightly different temporal profiles of the DTH response in those animals. Significant increases in rCBV were also observed at day 8 in all of the DTH animals (Figure 5A), which decreased thereafter, again preceding any contrast enhancement in 77% of DTH animals. The rCBV was elevated throughout much of the injected striatum, but noticeably not within the region exhibiting contrast enhancement at later time-points, eliminating the possibility that the apparent rCBV increases were artefactual, arising from gadolinium leakage. This was confirmed by inspection of the bolus transit curves showing that the signal changes exhibited the expected profile of a rapid decrease followed by a slower return to normal levels. The major areas of increased rCBV, generally observed in the ventral half of the striatum, did not tend to overlap substantially with the core of the main lesion even at the peak of contrast enhancement (days 12 to 19). In contrast, some smaller areas of increased rCBV were observed near the lesion core and these did overlap with the outer regions of contrast enhancement, T2 hyperintensity and increased ADC when the maximal extent was reached. These smaller areas of increased rCBV may correlate with vessels exhibiting perivascular cuffs, composed of macrophages, that were found surrounding the lesion core. Increases in rCBV were not evident in the control group (Figure 5B). The changes in rCBV were quantified as ratios of left hemispheric intensity versus right hemispheric intensity on the thresholded CBV maps, and the rCBV was significantly (unpaired t-tests) elevated in the DTH animals compared with the control group (Figure 5B) at days 5 (P<0.02), 8 (P<0.001), 12 (P<0.005), 19 (P<0.02) and 31 (P<0.05).
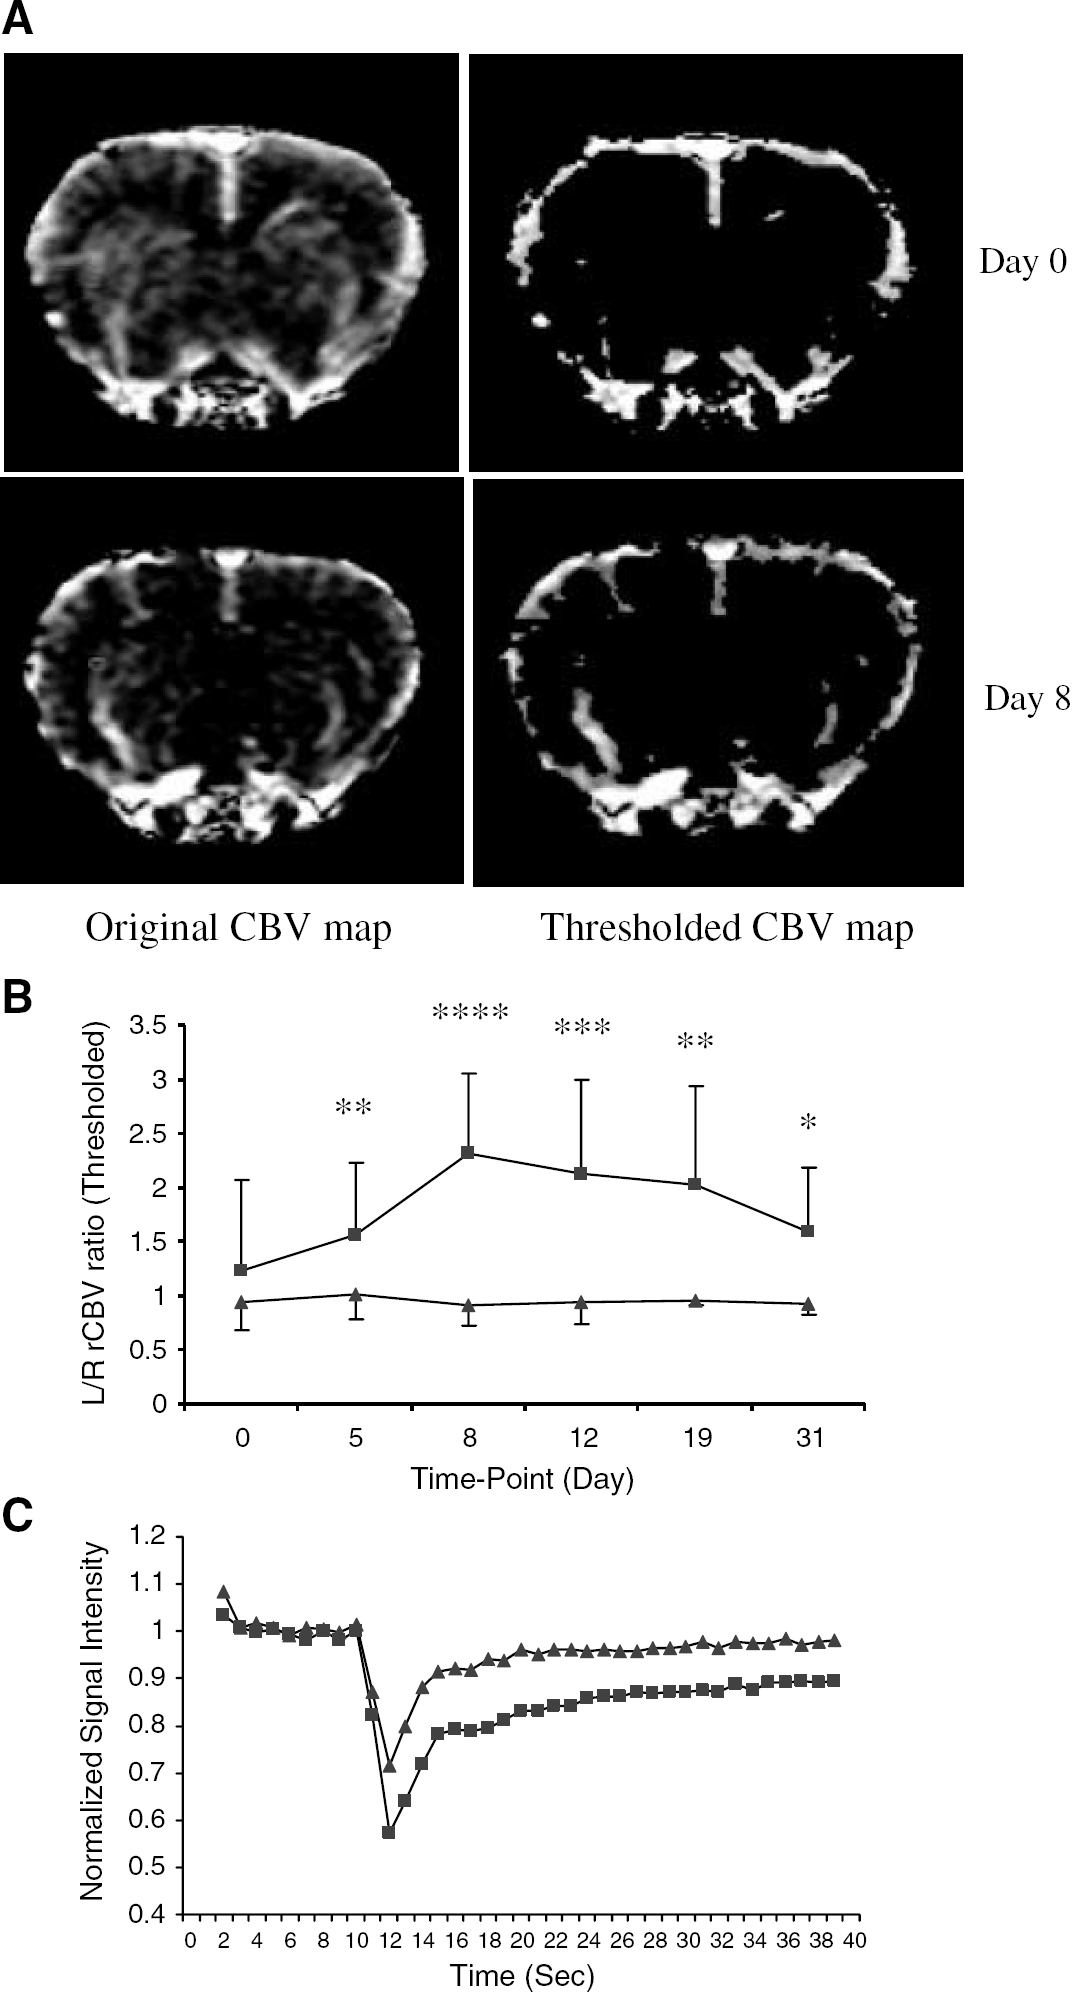
(
Laminin staining was used to identify blood vessels within the brain. Laminin staining revealed that the blood vessels throughout the injected hemisphere of DTH animals were considerably dilated (Figure 6A) when compared with the noninjected hemisphere (Figure 6B). These enlarged vessels were mapped onto the thresholded rCBV maps acquired at the same time-point (Figure 6C), and in the majority of cases corresponded spatially to areas of increased rCBV. The area of hypercellularity in the DTH animals did not correspond to the major regions of increased rCBV, which tended to occur in the more ventral portion of the striatum. The increases in rCBV were not temporally correlated with any of the other histologic parameters studied. However, at day 5 some recruitment of macrophages, T cells and B cells to the lesion was evident.
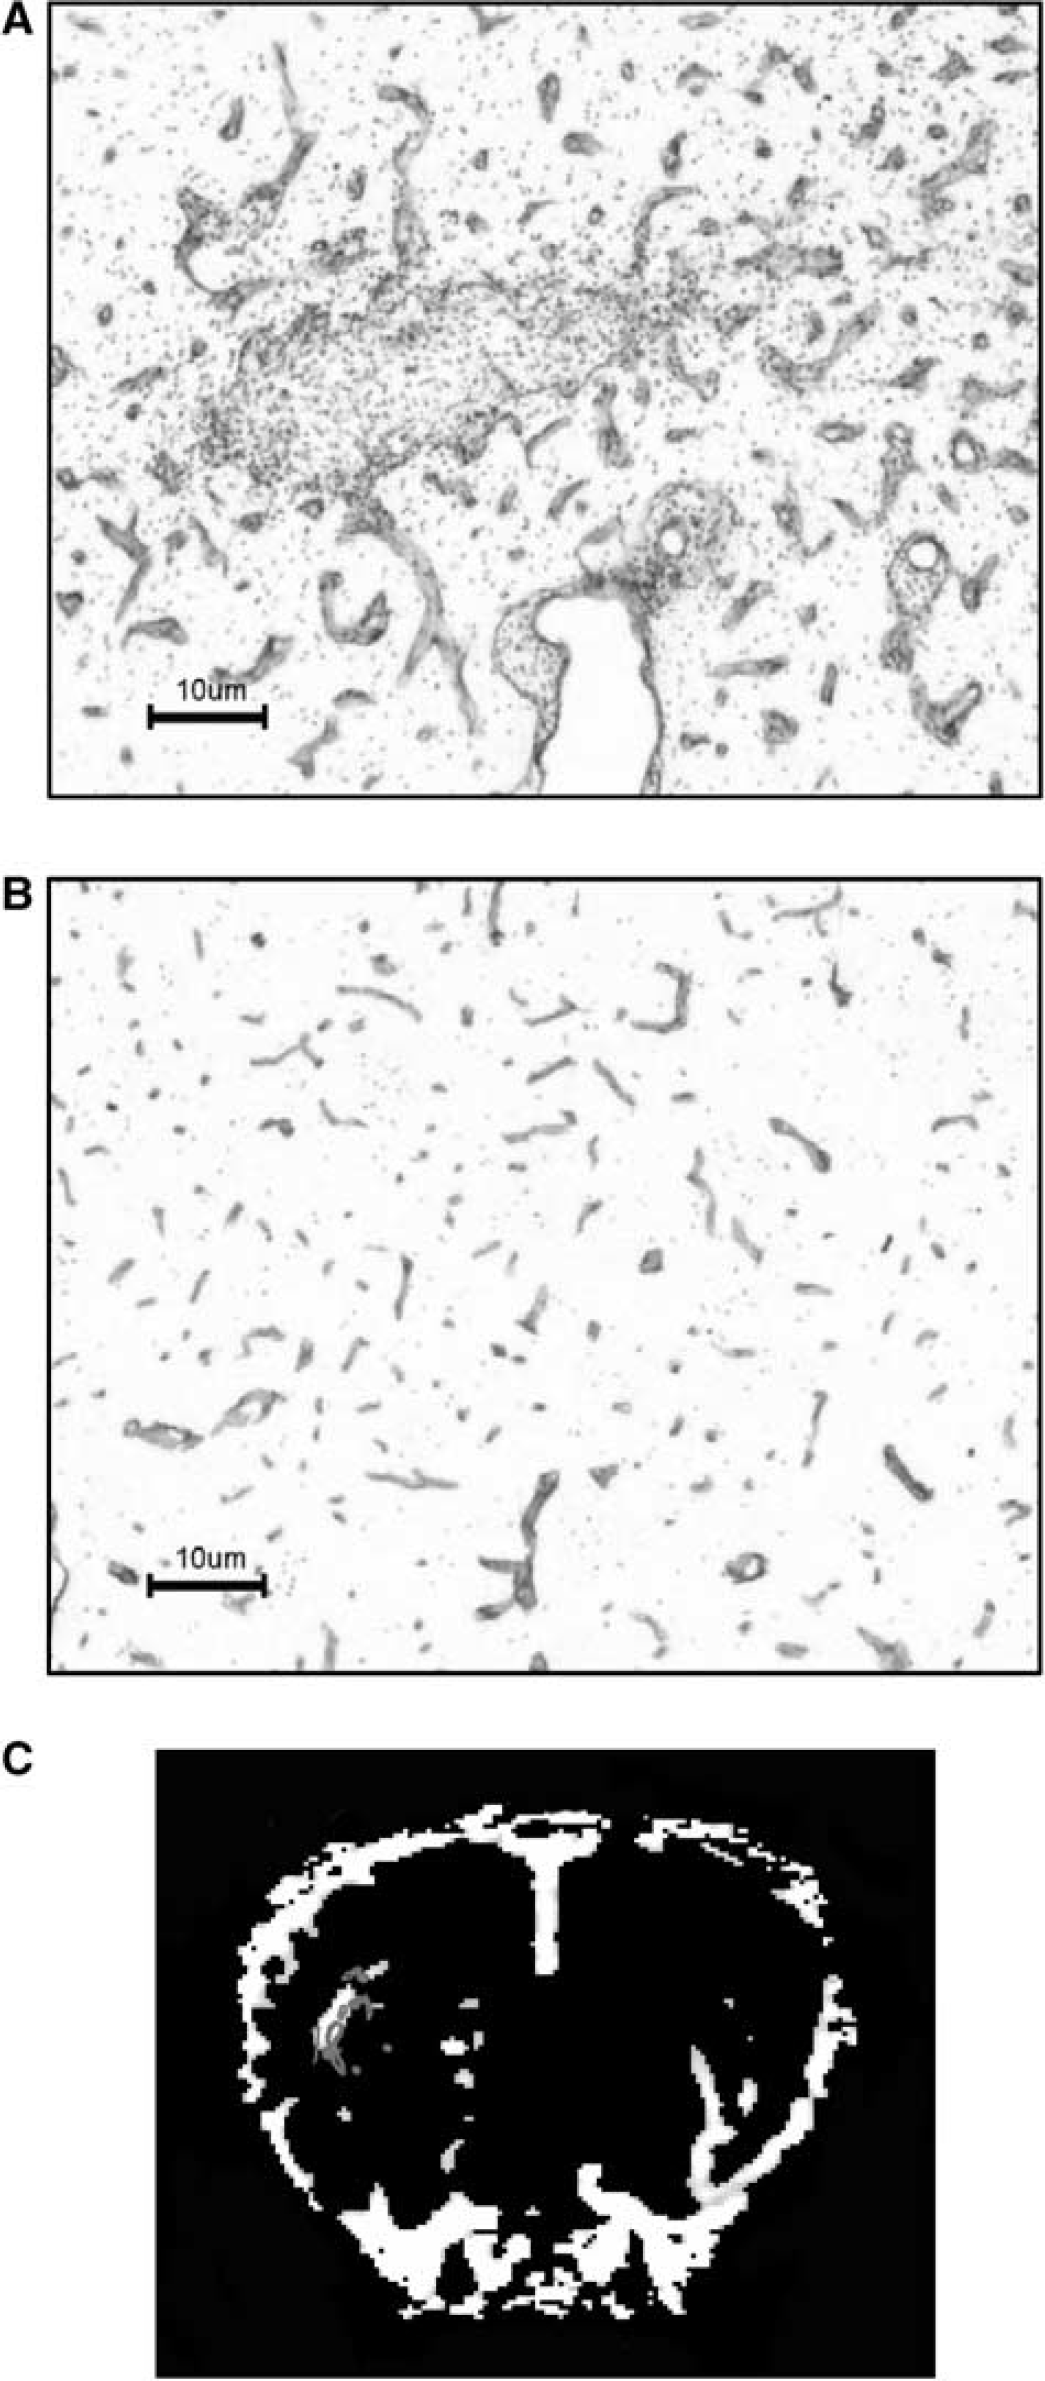
Laminin-stained sections (× 10) counterstained with cresyl violet (at day 19) indicating greater levels of laminin expression in and around the DTH lesion (
Discussion
In this work, we have shown that significant increases in rCBV are associated with an MS-like lesion within the brain. Moreover, these increases in rCBV precede overt changes in BBB permeability, T2 relaxation and the diffusion properties of tissue water (see Figure 7 for summary of results). Thus, changes in rCBV might be a sensitive indicator of lesion onset than more conventional indices used clinically in MS patients, such as contrast enhancement. In addition, we show that BBB breakdown, and consequent edema formation, is more closely correlated with astrogliosis than with other histopathologic markers, while regions of T1 and T2 hypointensity appear to reflect hypercellularity.
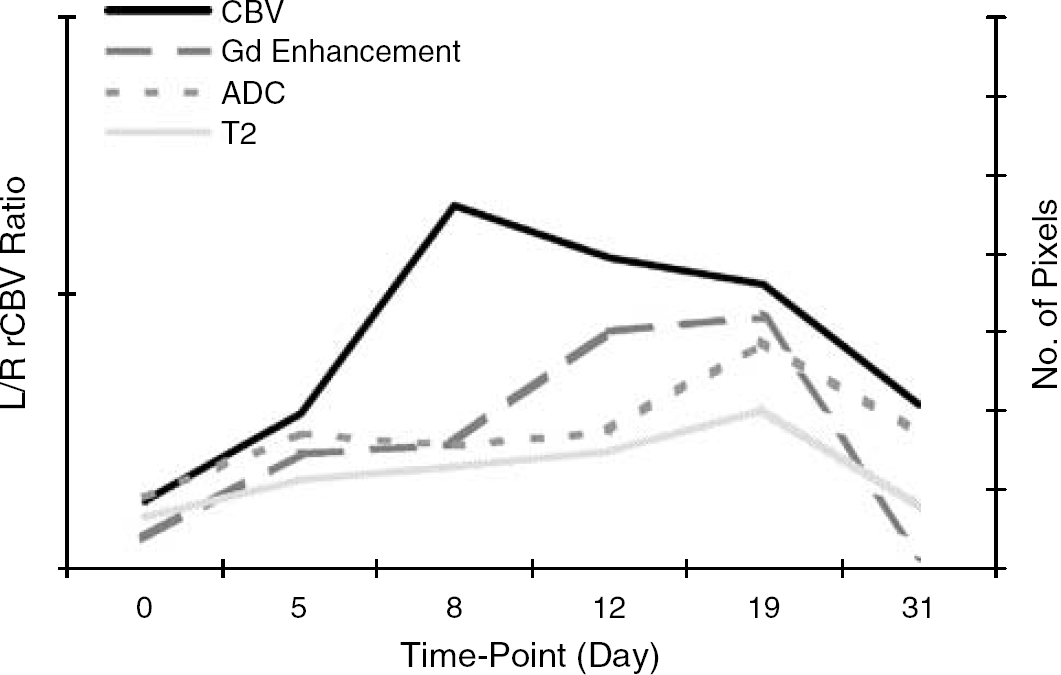
Schematic showing time-course (taken from mean values) of different MRI modalities demonstrating the temporal relationship between the different parameters. Increases in rCBV occurred before overt contrast enhancement, T2 hyperintensity and ADC hyperintensity.
Cerebral Blood Volume
At present, little published data exist on the subject of cerebral perfusion in MS patients. A reduction in rCBV in MS lesions has been shown to occur at the time of contrast enhancement (Jensen et al, 1995; Petrella et al, 1997; Tsui et al, 2002). This reduction is thought to be a consequence of edema, resulting from BBB breakdown and perivascular inflammation, which causes vessel compression. It is also thought that axonal loss and reduced neuronal activity result in a decrease in metabolic rate, which in turn induces a reduction in lesion vascularity (Haselhorst et al, 2000). However, Haselhorst et al (2000) recently demonstrated that contrast-enhancing lesions showed increased perfusion that subsided with time. Similarly, a study using an experimental allergic encephalitis (EAE) model of MS has reported increases in rCBF, measured using autoradiography, in lesions at the time of BBB breakdown. The increases in rCBF were hypothesized to be primarily because of increased glucose metabolism, resulting from increased inflammatory cell activation (Juhler and Paulson, 1986). However, in both of these studies, changes in perfusion were only investigated at the time of lesion enhancement, rather than before BBB breakdown. Since completion of the current study, one paper has been published in which a retrospective study of cerebral perfusion in lesions that subsequently showed contrast enhancement was performed in patients with relapsing-remitting MS (Wuerfel et al, 2004). In agreement with our study, those authors found significant increases in cerebral perfusion before lesion enhancement. Unlike clinical studies, the use of animal models enables investigation of underlying mechanisms, and correlation of MRI with histopathology. In the current study, we clearly show that significant increases in rCBV occur early in the development of the DTH lesion (days 5 to 12) and correspond histologically to areas of vessel dilation, but not within areas of marked leucocyte infiltration. Moreover, these increases in rCBV occur before overt changes in contrast enhancement and T2 signal intensity (maximal at day 19), which are the commonly used indices of MS lesion load. In some animals, slight changes in contrast enhancement (23% of cases) and T2 (65% of cases) were detected at day 5; however, far more animals (92%) exhibited increases in rCBV at this early time-point (data summarized in Figure 7). Moreover, in 77% of cases increases in CBV were observed before any contrast enhancement. It is also possible that increases in rCBV occurred earlier (days 0 to 5) in the animals that exhibited changes in other parameters at day 5, but those time-points were not investigated in the current study. From the histopathological data, it is clear that the rCBV increases occur early in the onset of inflammatory events, as detected by very low levels of macrophage, T- and B-cell recruitment. Thus, these findings suggest that rCBV may be a more sensitive indicator of the onset of inflammatory changes in MS than the conventionally used MRI-detectable parameters.
Contrast Enhancement
Contrast enhancement on T1-weighted images evolved over time in the DTH animals and was maximal around day 19. In both MS and EAE studies, BBB breakdown has been shown to correlate quantitatively with numbers of recruited macrophages present in the tissue (Hawkins et al, 1990; Katz et al, 1993; Morrissey et al, 1996; Nesbit et al, 1991). In contrast, in the current study, no quantitative correlation was found between macrophage recruitment and BBB breakdown. Moreover, the regions demonstrating the presence of recruited macrophages and BBB breakdown were not spatially coincident. This finding suggests that, despite the quantitative correlations found between macrophage numbers and BBB breakdown in MS and EAE, macrophages do not directly damage the BBB in this instance. In the present study, a temporal and spatial correlation was found between BBB breakdown and astrocyte activation, suggesting that reactive astrocytes might be, at least partly, associated with BBB breakdown and consequent contrast enhancement.
T1- and T2-Weighted Imaging
Hypointense regions were visible at the injection site on both T1- and T2-weighted images, and were present throughout the study in all animals (DTH and controls). These hypointensities are thus a particular feature of the DTH lesion originally arising from the initial inflammatory response to the BCG deposit in the brain, and appear to correlate spatially with the hypercellular core of the lesion. Nevertheless, in the DTH animals the spatial extent of the hypointensities increased with time after peripheral challenge, and appeared to peak at the same time-point as maximal contrast enhancement was observed while decreasing thereafter. These observations are in agreement with the findings of Pirko et al (2004), who showed transient T1 hypointensities in mice with Theiler's murine encephalomyelitis virus (TMEV). Occasionally T1 hypointensities have been observed in MS patients before contrast enhancement (Hiehle et al, 1995; van Waesberghe et al, 1997, 1998). Clinically, the cause of acute T1 hypointensities is unclear, but the data presented here, together with that of Pirko et al, suggest that they might be caused primarily by hypercellularity in a newly evolving lesion. As the DTH lesion evolves, axonal loss does become evident within the core of the lesion, and continues to develop beyond the period of contrast enhancement (Newman et al, 2001). Thus, it is possible that before contrast enhancement, axonal loss may also contribute to the T1 signal change, as has been suggested for T1 hypointensities occurring in MS patients after contrast enhancement (Bitsch et al, 2001; Kornek et al, 2000; van Walderveen et al, 1998, 2001, 1999).
T2 hypointense regions have also been reported in MS, although they usually occur in the grey matter at a distance from the lesions. It has been suggested that these are caused by abnormal iron deposition, which occurs in both MS (LeVine, 1997; Bakshi et al, 2001) and EAE (Forge et al, 1998). In the current study, the number of macrophages correlated significantly with the area of T2 hypointensity, and they were spatially coincident. Thus, it is possible that macrophage recruitment underlies the reduction in T2 signal intensity, either as a consequence of iron deposition or simply owing to the effect of hypercellularity on the T2 relaxation time of the tissue. Alternatively, loss of neurons, axons or myelin within the same regions could underlie these signal changes.
Increased signal intensity on T2-weighted images was observed as a rim around the hypointense core in animals with a DTH lesion, which evolved over time and was maximal around day 19, after the maximal rCBV changes. T2 hyperintensities are commonly observed during the acute phase of MS lesions and have also been reported in EAE lesions (Hart et al, 1998; Jordan et al, 1999; Karlik et al, 1999; Richards et al, 1995). Vasogenic edema, demyelination and axonal loss have all been reported to yield similar increases in signal intensity on T2-weighted images (Bruck et al, 1997), and in MS patients it has been suggested that acute-lesion-associated T2 hyperintensities most closely reflect demyelination (Nijeholt et al, 2001). However, in the current study, the areas of T2 hyperintensity extended well beyond the area of demyelination, which was restricted to the hypercellular core, and they correlated significantly with the areas of BBB breakdown. This finding strongly suggests that the increase in T2 signal intensity observed here reflects the formation of vasogenic edema as a consequence of BBB breakdown. The areas of increased T2 signal intensity also correlated both spatially and quantitatively with the areas encompassing reactive astrocytes. Thus, it seems likely that reactive astrocytes play a role in BBB breakdown and the development of vasogenic edema.
Diffusion-Weighted Imaging
In this study, a region of increased water diffusion, or ADC, was found surrounding a central core of decreased ADC. The area of elevated ADC increased in size over time to become maximal around day 19, and subsequently decreased. Similarly, the area of reduced ADC appeared to increase substantially around the point of maximal inflammatory response (day 19) and later decreased again. Maximal changes in the area of ADC change occurred at the same time as maximal T1 and T2 changes and contrast enhancement, all of which occurred later than the maximal increases in rCBV.
In most diffusion studies performed in MS patients, increased water diffusion occurs within the acute lesion (Christiansen et al, 1993; Droogan et al, 1999; Horsfield et al, 1996; Larsson et al, 1992; Tievsky et al, 1999; Werring et al, 2000) and a correlation has been found between the severity of clinical impairment and the ADC values of the white matter in MS patients (Verhoye et al, 1996). It has been suggested that the increase in ADC is brought about by an increase in diffusion of water molecules in a plane orthogonal to fibre orientation (Christiansen et al, 1993; Degaonkar et al, 2002; Heide et al, 1993). In the current study, areas of increased ADC correlated significantly with areas of BBB breakdown and T2 hyperintensity. These findings suggest that edema resulting from BBB breakdown may be the underlying cause of the increased ADC. However, in both clinical (Werring et al, 2000), and EAE studies (Heide et al, 1993), the ADC of brain tissue has been shown to increase before gadolinium enhancement of the lesion. Similarly, in some cases in the current study, an increased ADC was observed before BBB breakdown. At these time-points, it is possible that an increase in ADC reflects other processes that alter the structure of the brain parenchyma and, consequently, give rise to increased diffusion. Alternatively, these findings may indicate a greater sensitivity of diffusion-weighted imaging to subtle changes at the lesion perimeter than T2-weighted imaging or contrast enhancement. It is unlikely that the increased ADC is a direct result of the increased rCBV since these regions did not tend to overlap spatially.
Although most MS studies have demonstrated an increased ADC, the finding of an area of reduced ADC on ADC trace maps in the current work is in agreement with only one clinical study in which areas of restricted diffusion were found (Iwasawa et al, 1997). Similar findings of an area of reduced ADC surrounded by a region of increased ADC have recently been reported in a demyelinating MS-like lesion (Degaonkar et al, 2002). In the clinical study of Iwasawa and colleagues, the regions of reduced ADC were often found in lesions where there was no gadolinium enhancement. In the current study, the areas of decreased ADC were present both before gadolinium enhancement, and during the later stages of lesion progression. In Iwasawa's work, areas of decreased diffusion were found at the edges of MS lesions where there are dense cellular borders, and it was hypothesized that the hypercellularity of the lesion caused decreased diffusion in those regions. In the DTH model, the lesion core is overwhelmed with recruited macrophages and T cells, and this region correlated spatially with the area of decreased ADC. In addition, MHC class II expression was found to correlate both spatially and quantitatively with the ADC hypointense area. Since MHC class II is expressed predominately by cells in the hypercellular core, such as macrophages, these findings provide further support for the hypothesis that a decreased ADC is brought about by the dense population of these cells. Both MHC class II expression and the extent of ADC hypointensity had begun to return towards normal by day 31. It is of note that all of the parameters studied had returned, or were returning, to baseline by day 31 when there is still ongoing axonal injury (Newman et al, 2001).
In summary, our findings show that contrast enhancement, T2 hyperintensity, and increased ADC, the commonly used indices of lesion load in MS patients, reflect a well-developed highly active inflammatory lesion. In contrast, increases in rCBV occurred before this time-point of maximal inflammatory activity, but histologically were accompanied by early stages of the inflammatory response, as shown by low levels of macrophage, and recruitment of T and B cells. Thus, rCBV MRI may provide a more sensitive indicator of the onset of inflammatory changes than conventionally used MRI modalities.