
Abstract
Diminished P-glycoprotein (P-gp)-mediated transport across the Blood–brain barrier may play an important role in several neurodegenerative disorders. In previous studies, a racemic mixture of (R)-[11C]verapamil and (S)-[11C]verapamil has been used as tracer for assessing P-gp function using positron emission tomography (PET). Quantification, however, is compromised by potential differences in kinetics between these two isomers. The aim of the present study was to evaluate the kinetics of pure (R)-[11C]verapamil in humans and to develop a tracer kinetic model for the analysis of P-gp-mediated transport of (R)-[11C]verapamil, including the putative contribution of its radioactive metabolites. Dynamic (R)-[11C]verapamil PET scans of 10 male volunteers were analysed with various single- or two-tissue compartment models, with separate compartments for N-dealkylated and N-demethylated metabolites, assuming that either (R)-[11C]verapamil alone or (R)-[11C]verapamil and any combination of metabolites cross the BBB. In addition, six of the subjects underwent two (R)-[11C]verapamil scans to evaluate test–retest reliability. One hour after injection, 50% of total plasma radioactivity consisted of labelled metabolites. Most models fitted the data well and the analysis did not point to a definite ‘best’ model, with differences in optimal model between subjects. The lowest mean test–retest variability (2.9%) was found for a single-tissue model without any metabolite correction. Models with separate metabolite compartments lead to high test–retest variability. Assuming that differences in kinetics of (R)-[11C]verapamil and N-dealkylated metabolites are small, a one input, one-tissue model with correction for N-demethylated metabolites only leads to a good compromise between fit quality and test–retest variability.
Introduction
P-glycoprotein (P-gp) is the major efflux pump in the Blood–brain barrier (BBB). It has been hypothesised that diminished P-gp-mediated transport across the BBB may play an important role in several neurologic disorders such as Alzheimer's disease (Vogelgesang et al, 2002) and Parkinson's disease (Kortekaas et al, 2005). [11C]verapamil has been proposed as a ligand for measuring P-gp function using positron emission tomography (PET) (Elsinga et al, 1996; Bart et al, 2003). In initial animal and human studies use was made of a racemic mixture of (R)- and (S)-[11C]verapamil (Hendrikse et al, 2001; Kortekaas et al, 2005; Sasongko et al, 2005). The validity of using [11C]verapamil as a PET tracer for P-gp function in humans was demonstrated by an increased cerebral uptake of [11C]verapamil after blockade of P-gp with cyclosporine (Sasongko et al, 2005). Because of differences in hepatic metabolism, plasma protein binding and plasma clearance between these two enantiomers, their tissue uptake may also be different. Since it is not possible to distinguish between differences in plasma and tissue kinetics of both isomers using activity measurements, a pure enantiomer is required for quantitative studies. For this reason pure (R)-[11C]verapamil was developed, as it appeared to be the best enantiomer for measuring P-gp function in vivo (Luurtsema et al, 2003).
The physiologic properties of (R)-[11C]verapamil and its radioactive metabolites, such as BBB permeability and affinity for P-gp, should determine the choice of pharmacokinetic model for analyses of (R)- [11C]verapamil data. Previous studies in rats have shown that verapamil is metabolized through N- demethylation, O-demethylation, and N-dealkylation (Luurtsema et al, 2005). The first of these pathways produces metabolites such as [11C]formaldehyde, [11C]formic acids, and [11C]CO2, the socalled ‘polar fraction‘, which can amount to 70% of the total plasma radioactivity at 1 h after injection in rats. An overview of the metabolic pathways of [11C]verapamil is given in Figure 1.
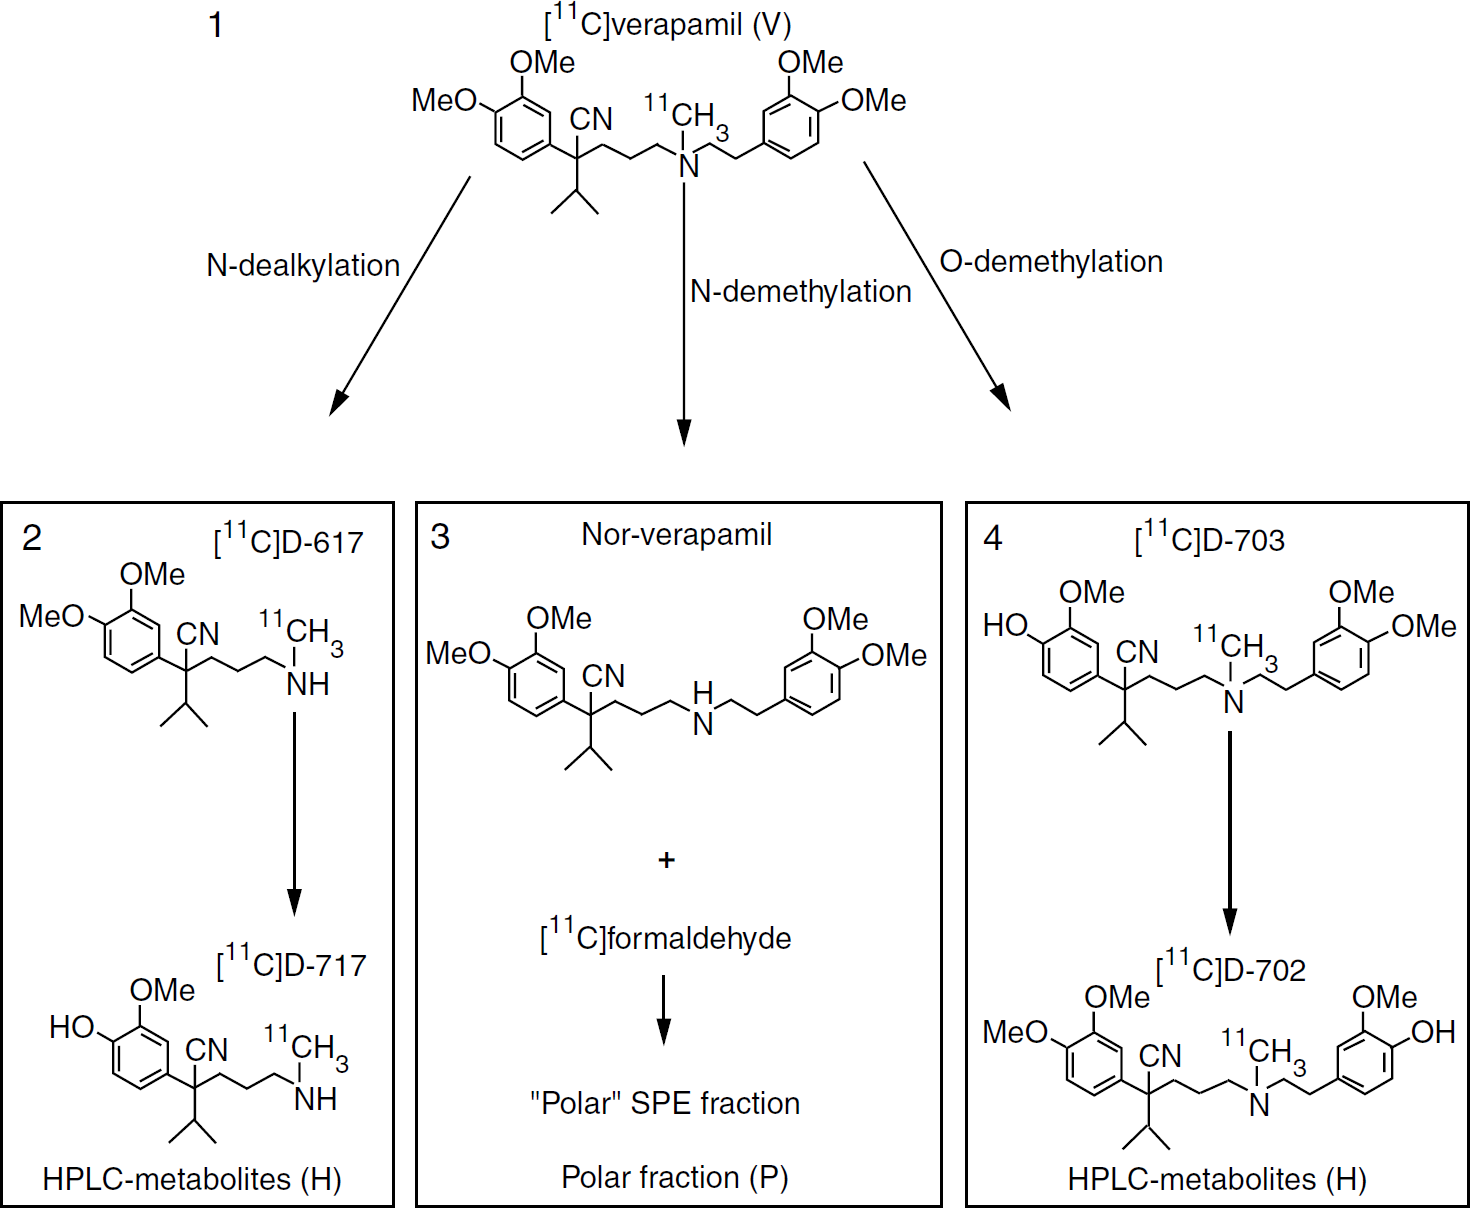
Metabolic pathways of [11C]verapamil, indicating the abbreviations V, H, and P used in the present paper. Adapted from Luurtsema et al. (2005) with permission from Elsevier.
Because of its high lipophilicity, [11C]verapamil readily passes the BBB, and as a result of its high affinity for P-gp, subsequently it is rapidly transported out of the brain. This high lipophilicity may also cause nonspecific binding. The similar high lipophilicity of N-dealkylation and O-demethylation metabolites probably also leads to rapid brain uptake, and these metabolites are P-gp substrates (Pauli-Magnus et al, 2000). In addition, part of the N-demethylation metabolites may also pass the BBB, but these metabolites have no affinity for Pgp. In rats, N-demethylation metabolites amounted to 50% of total brain radioactivity at 60 min p.i., whereas N-dealkylation and O-demethylation metabolites were not found in significant amounts. The large concentration of N-demethylation metabolites in brain may be because of either transport of these metabolites across the BBB after metabolism in the liver, or in situ metabolism in the brain (Luurtsema et al, 2005). Thus, a significant contribution of radioactive metabolites to the PET signal measured in the brain cannot be excluded, and the kinetics of these metabolites may differ from those of the parent tracer (R)-[11C]verapamil. Therefore, tracer kinetic models have to be evaluated which allow for the contribution of these radioactive metabolites.
The aim of the present study was to investigate the plasma kinetics of (R)-[11C]verapamil in humans and to establish a pharmacokinetic model for the analysis of P-gp mediated transport of (R)-[11C]verapamil. Both volume of distribution Vd and efflux rate constant k2 were considered as potential (surrogate) measures of P-gp function. Previously, Vd as determined by Logan graphical analysis (Logan et al, 1990; Bart et al, 2003; Kortekaas et al, 2005) and the ratio of areas under the tissue and plasma curves (Sasongko et al, 2005) have been used as measures for P-gp-mediated transport of [11C]verapamil. However, the efflux rate constant k2 can be seen as a more direct measure of P-gp function, assuming it is independent of blood flow. Considering the observations given above, the possible contribution of radioactive metabolites was included in the present analysis. An accurate description of the kinetics of the parent tracer depends not only on the accuracy of the PET data themselves, but to a high degree also on the accuracy of the measurements of plasma concentrations of parent tracer and its metabolites. Therefore, simulations were performed to assess the effect of measurement uncertainty of blood radioactivity measurements and PET time–activity curves on the stability of various evaluated compartmental models. Finally, test–retest variability of (R)-[11C]verapamil measurements was assessed for each of the candidate tracer kinetic models.
Materials and Methods
Synthesis of (R)-[11C]Verapamil
(R)-[11C]verapamil was synthesised as described previously (Luurtsema et al, 2002). After synthesis the compound was formulated in a saline/ethanol solution 90%/10% v/v. The specific activity was 43±12 (mean ± s.d.) GBq/mmol at time of injection, and the radiochemical purity was >98%.
Scan Procedure
Ten healthy male volunteers (mean age 43 years, range 21 to 68) were included in this study. All subjects were extensively screened for somatic and neurologic disorders and had to fulfil research diagnostic criteria for never mentally ill. All subjects were screened for the use of drugs of abuse and had a normal magnetic resonance imaging (MRI) scan. They gave written informed consent and the study was approved by the Medical Ethics Committee of the VU University Medical Centre. After cannulation of a radial artery and ante-cubital vein, all subjects underwent 1 h dynamic PET scans consisting of 20 frames after injection of 366±27 (mean ± s.d.) MBq of (R)-[11C]verapamil. Six of the subjects underwent two scans on 1 day, at 1030 and 1400 h, to allow for measurement of test–retest variability. All PET scans were acquired using a CTI/Siemens (Knoxville, TN, USA) ECAT Exact HR + scanner in 3D acquisition mode. Images were reconstructed by filtered back projection (FBP) applying a Hanning filter with cutoff at 0.5 of the Nyquist frequency, resulting in a reconstructed spatial resolution of approximately 6.5 mm in the centre of the field of view of the scanner. Data were corrected for dead time, scattered radiation and random coincidences, and normalised using methods included in the standard ECAT 7.2 software. Attenuation correction was based on a 10 min transmission scan obtained using rotating 68Ge rod sources.
Grey-White Matter Segmentation
For each subject, a T1-weighted structural MRI scan was acquired. PET and MRI images were co-registered using a mutual information registration algorithm (Maes et al, 1997). The co-registered MRI was segmented into grey matter, white matter, and extra-cerebral fluid using a fully automated procedure (Zhang et al, 2001). Whole brain grey matter regions of interest (ROIs) were defined based on the segmented MRI images and mapped onto the PET images.
Blood Sampling And Bio-Analysis of (R)-[11C]Verapamil in Arterial Plasma
Arterial blood was sampled continuously during the course of the scan using an automatic on-line blood sampler (Veenstra, Joure, The Netherlands) (Boellaard et al, 2001). At 2, 5, 10, 20, 30, 40, and 60 mins after injection of (R)-[11C]verapamil, additional arterial blood samples (10 ml) were collected. These samples were used to measure plasma-to-whole-blood (P/WB) radioactivity ratios and to measure the radioactive fractions of (R)- [11C]verapamil and its radioactive metabolites in blood and plasma. Plasma samples were analysed using solid-phase extraction combined with high-pressure liquid chromatography (HPLC) using off-line radioactivity detection, as described previously (Luurtsema et al, 2005). Three fractions were determined: (R)-[11C]verapamil, N-dealkylated products and O-demethylated products (measured by HPLC and from here on referred to as H metabolites), and N-demethylated products (polar fraction, from here on referred to as P metabolites). A Hill-type function (Gunn et al, 1998; Lubberink et al, 2004) was fitted to the P/WB ratios and the parent and polar fractions to interpolate these to the same time scale as the on-line blood data. The on-line curve was then calibrated using the seven sample blood radioactivity concentrations, and parent and P metabolite input functions were calculated by multiplication of the calibrated on-line curve with the fits to the P/WB ratios and parent and polar fractions. The H metabolite input function was calculated as the total plasma curve minus parent and P metabolite fraction input functions. Measurement uncertainties in parent, H and P metabolite fractions were estimated based on Poisson statistics of the radioactivity measurements.
Compartment Analysis
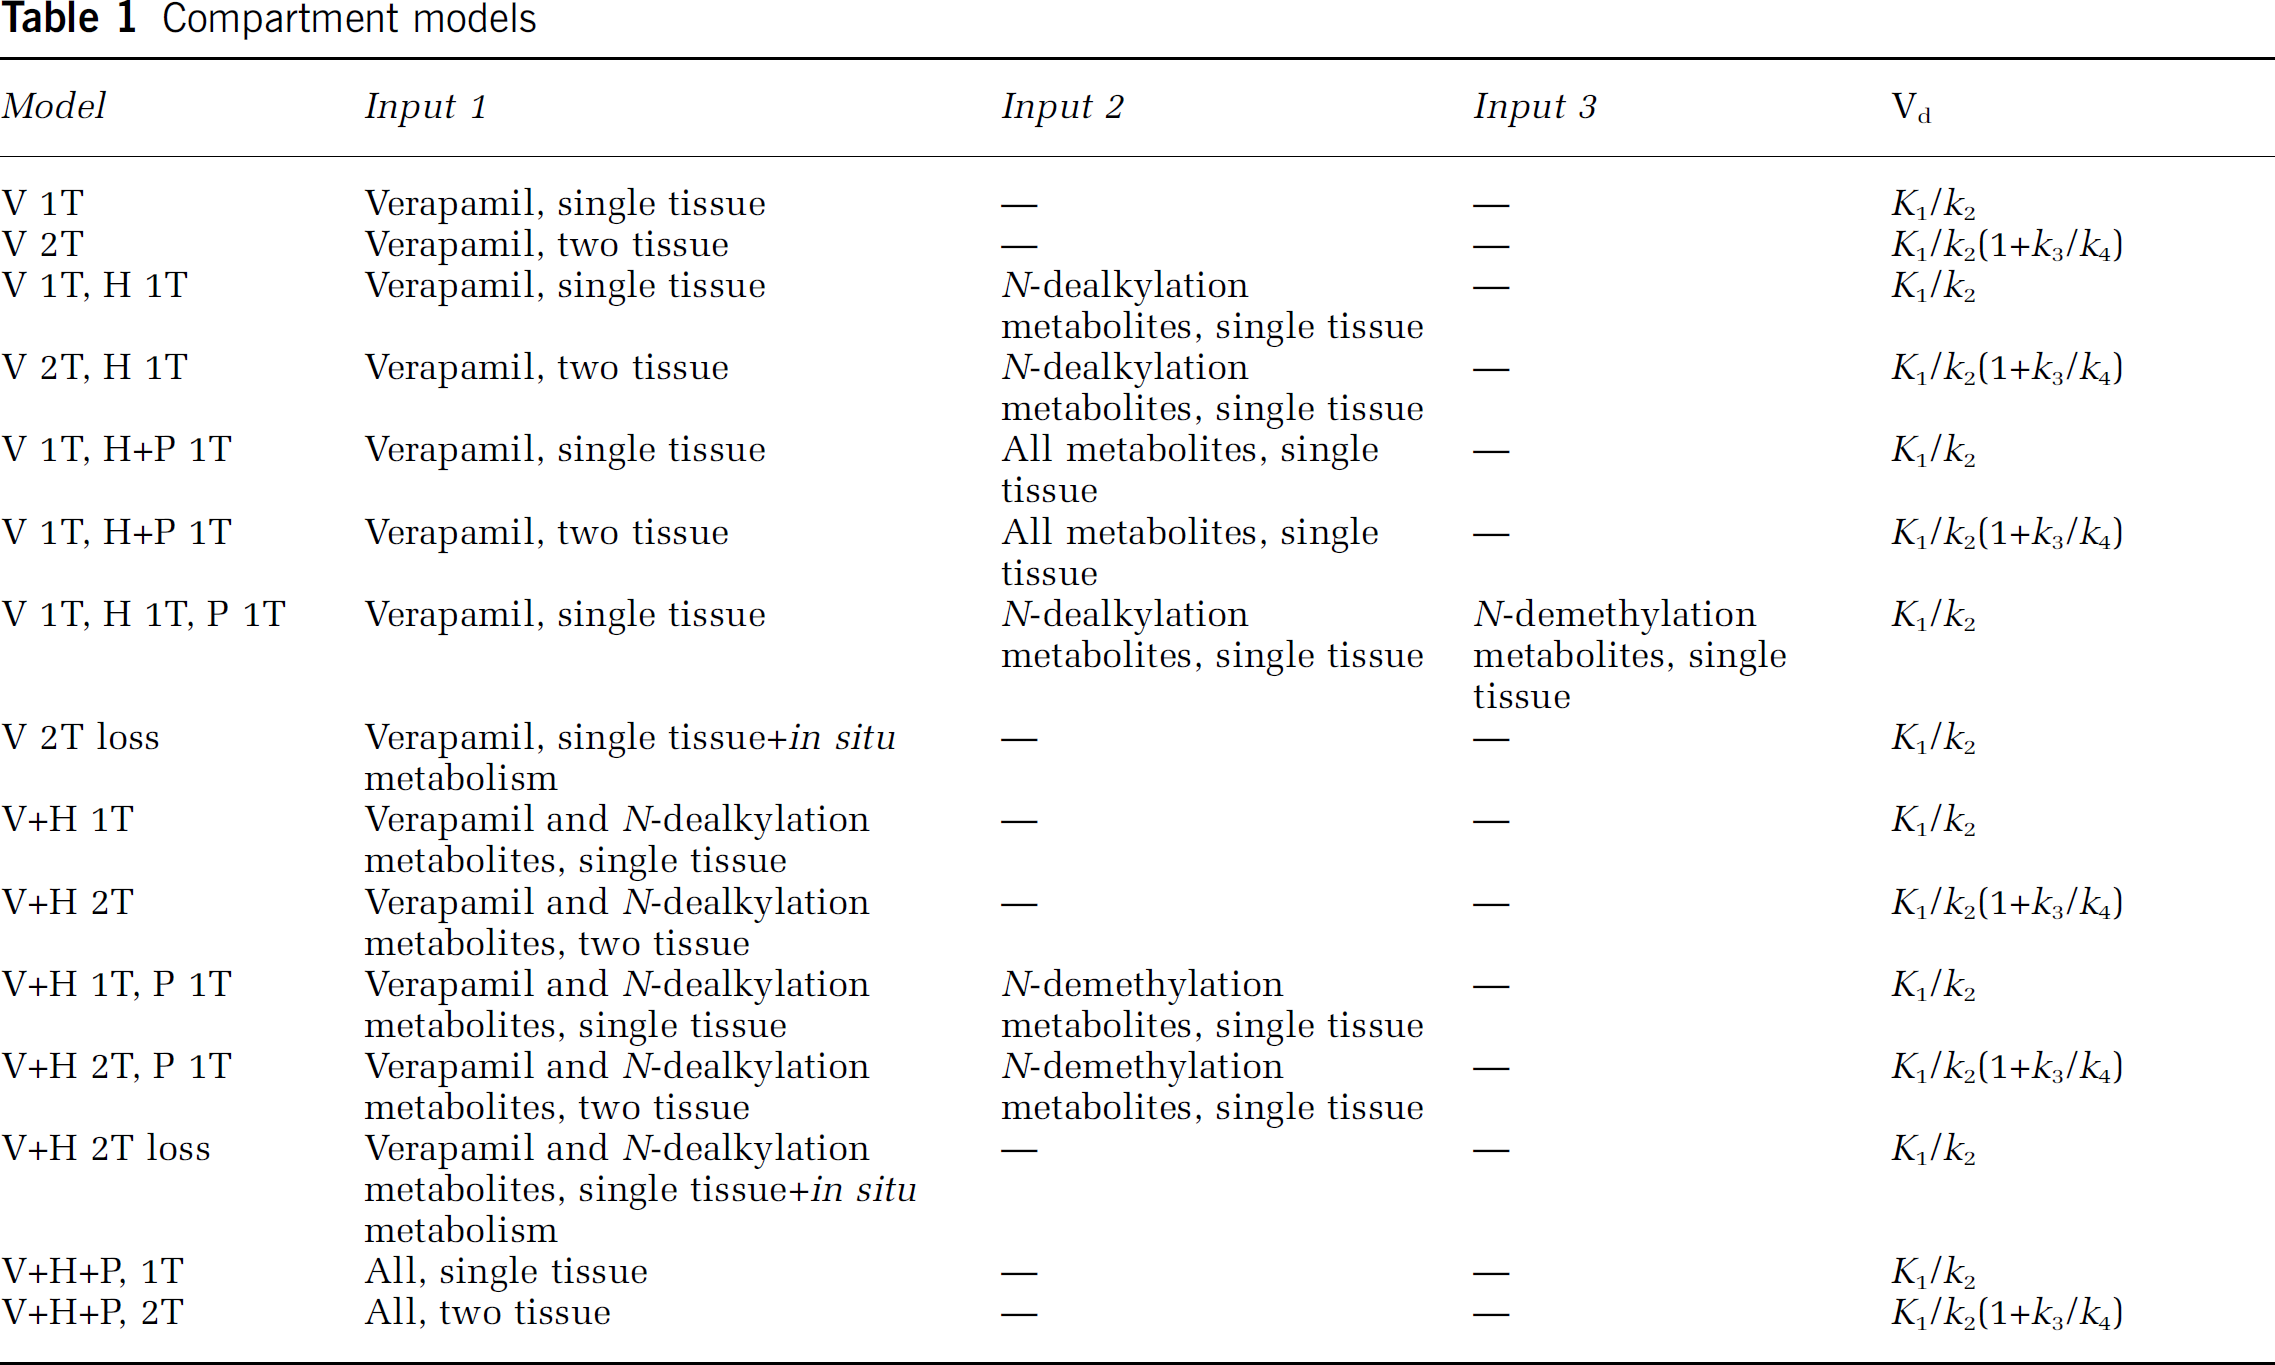
As mentioned in Introduction, a number of possibilities exists concerning transport of (R)-[11C]verapamil and its labelled metabolites across the BBB into the brain and their subsequent clearance from the brain. These involve uptake of none, one or both of the metabolite fractions in the brain, and kinetics that are either similar to or different from those of the parent tracer. In addition, the possibility of in situ metabolism in the brain can be considered. Each metabolite fraction was assumed to have homogeneous kinetics. Any combination of these assumptions was assessed, leading to a variety of compartment models based on the general model shown in Figure 2 and Table 1. As the concentration of P-gp was assumed to be approximately uniform in grey matter (e.g. see Figure 8), kinetics of (R)-[11C]verapamil were also assumed to be similar across the grey matter structures. Therefore, only whole brain grey matter time activity curves (TACs) were used in the present study to obtain the best possible statistics for model development.
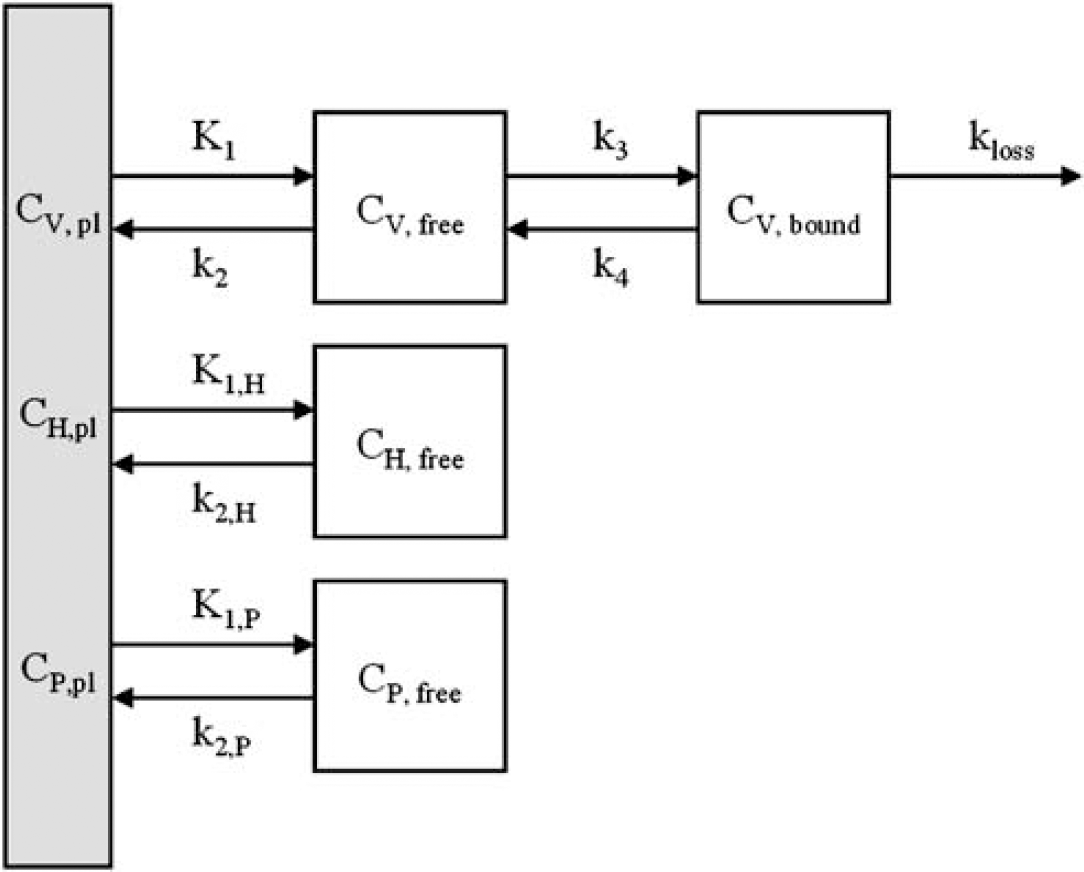
General three-input compartment model considered for kinetic analysis of (R)-[11C]verapamil. Each of the three inputs, verapamil (V), HPLC metabolites (H) and polar fraction (P), as also indicated in Figure 1, can have either different (e.g. V, H, and P) or similar (e.g. V + H + P) single-tissue compartment kinetics (K1, k2 > 0). In addition, a reversible two-tissue model for verapamil itself (K1, k2, k3, k4 >0) and a singletissue model with loss by in situ metabolism in the brain (K1, k2, k3, kloss > 0) were considered.
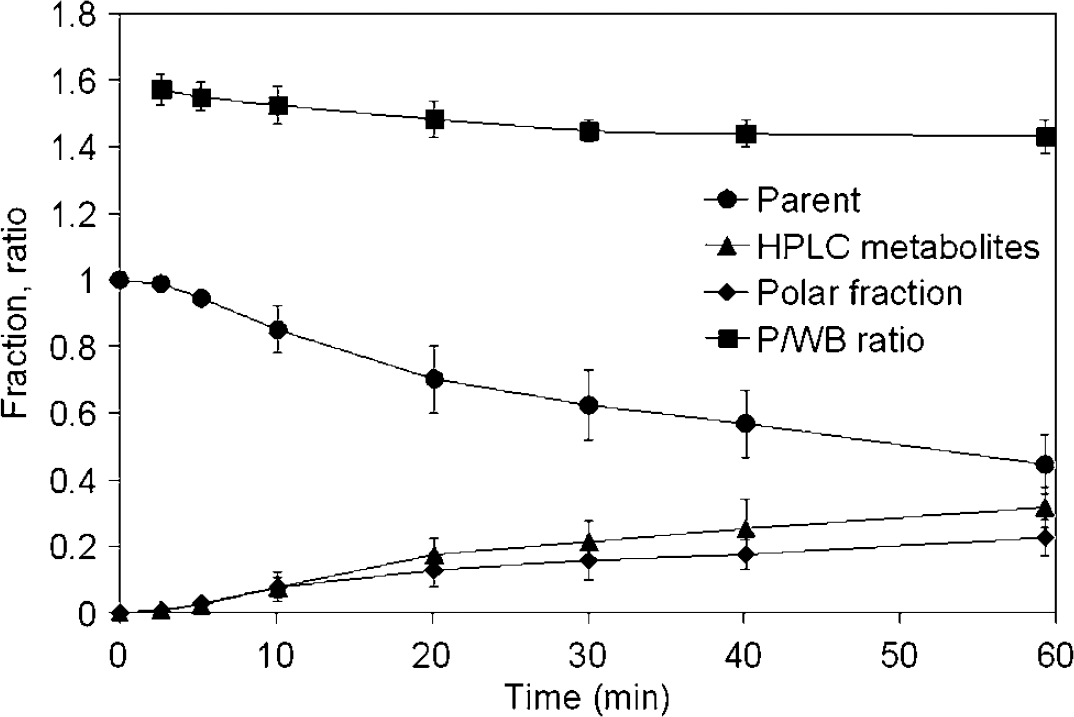
Mean (± s.d.) parent fraction, polar fraction, HPLC metabolite fraction and plasma to whole blood ratio (P/WB ratio) for all scans.
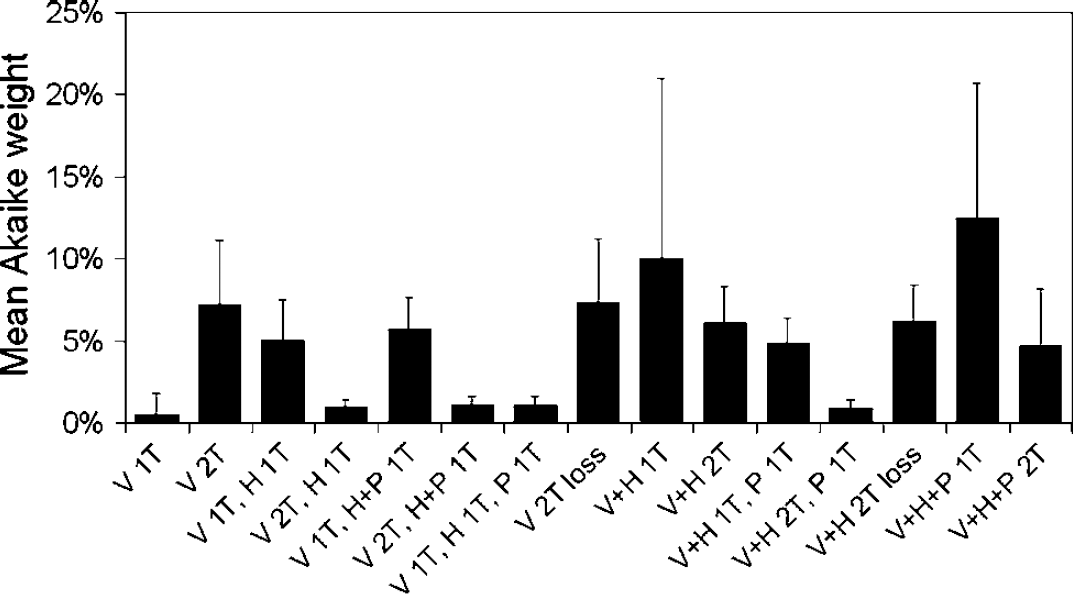
Mean Akaike weights for all considered models. The error bars reflect the s.d. between subjects.
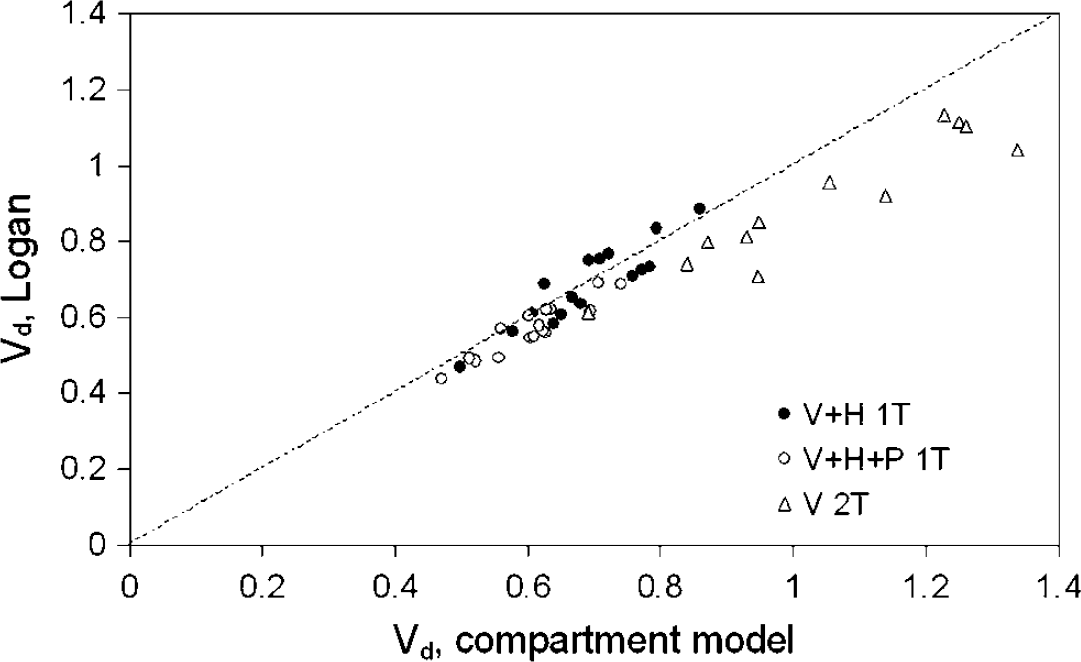
Vd obtained from Logan analysis versus Vd from compartment analysis, with no metabolite correction (r2 = 0.86), correction for polar metabolites only (r2 = 0.83), and full metabolite correction (r2 = 0.65). The dashed line is the line of identity.
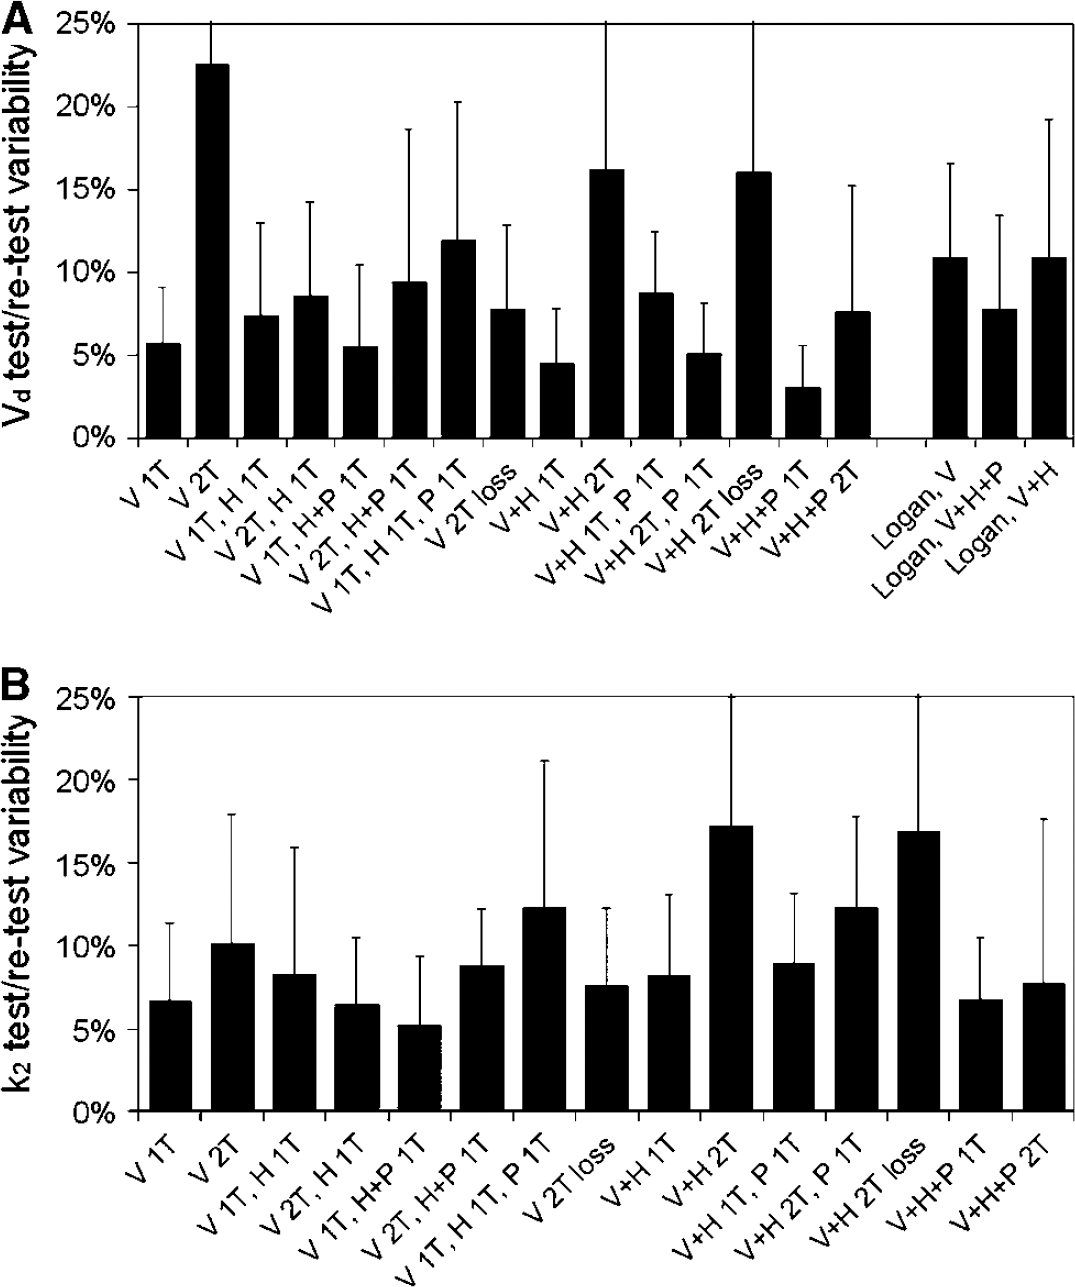
Test-retest variability of (
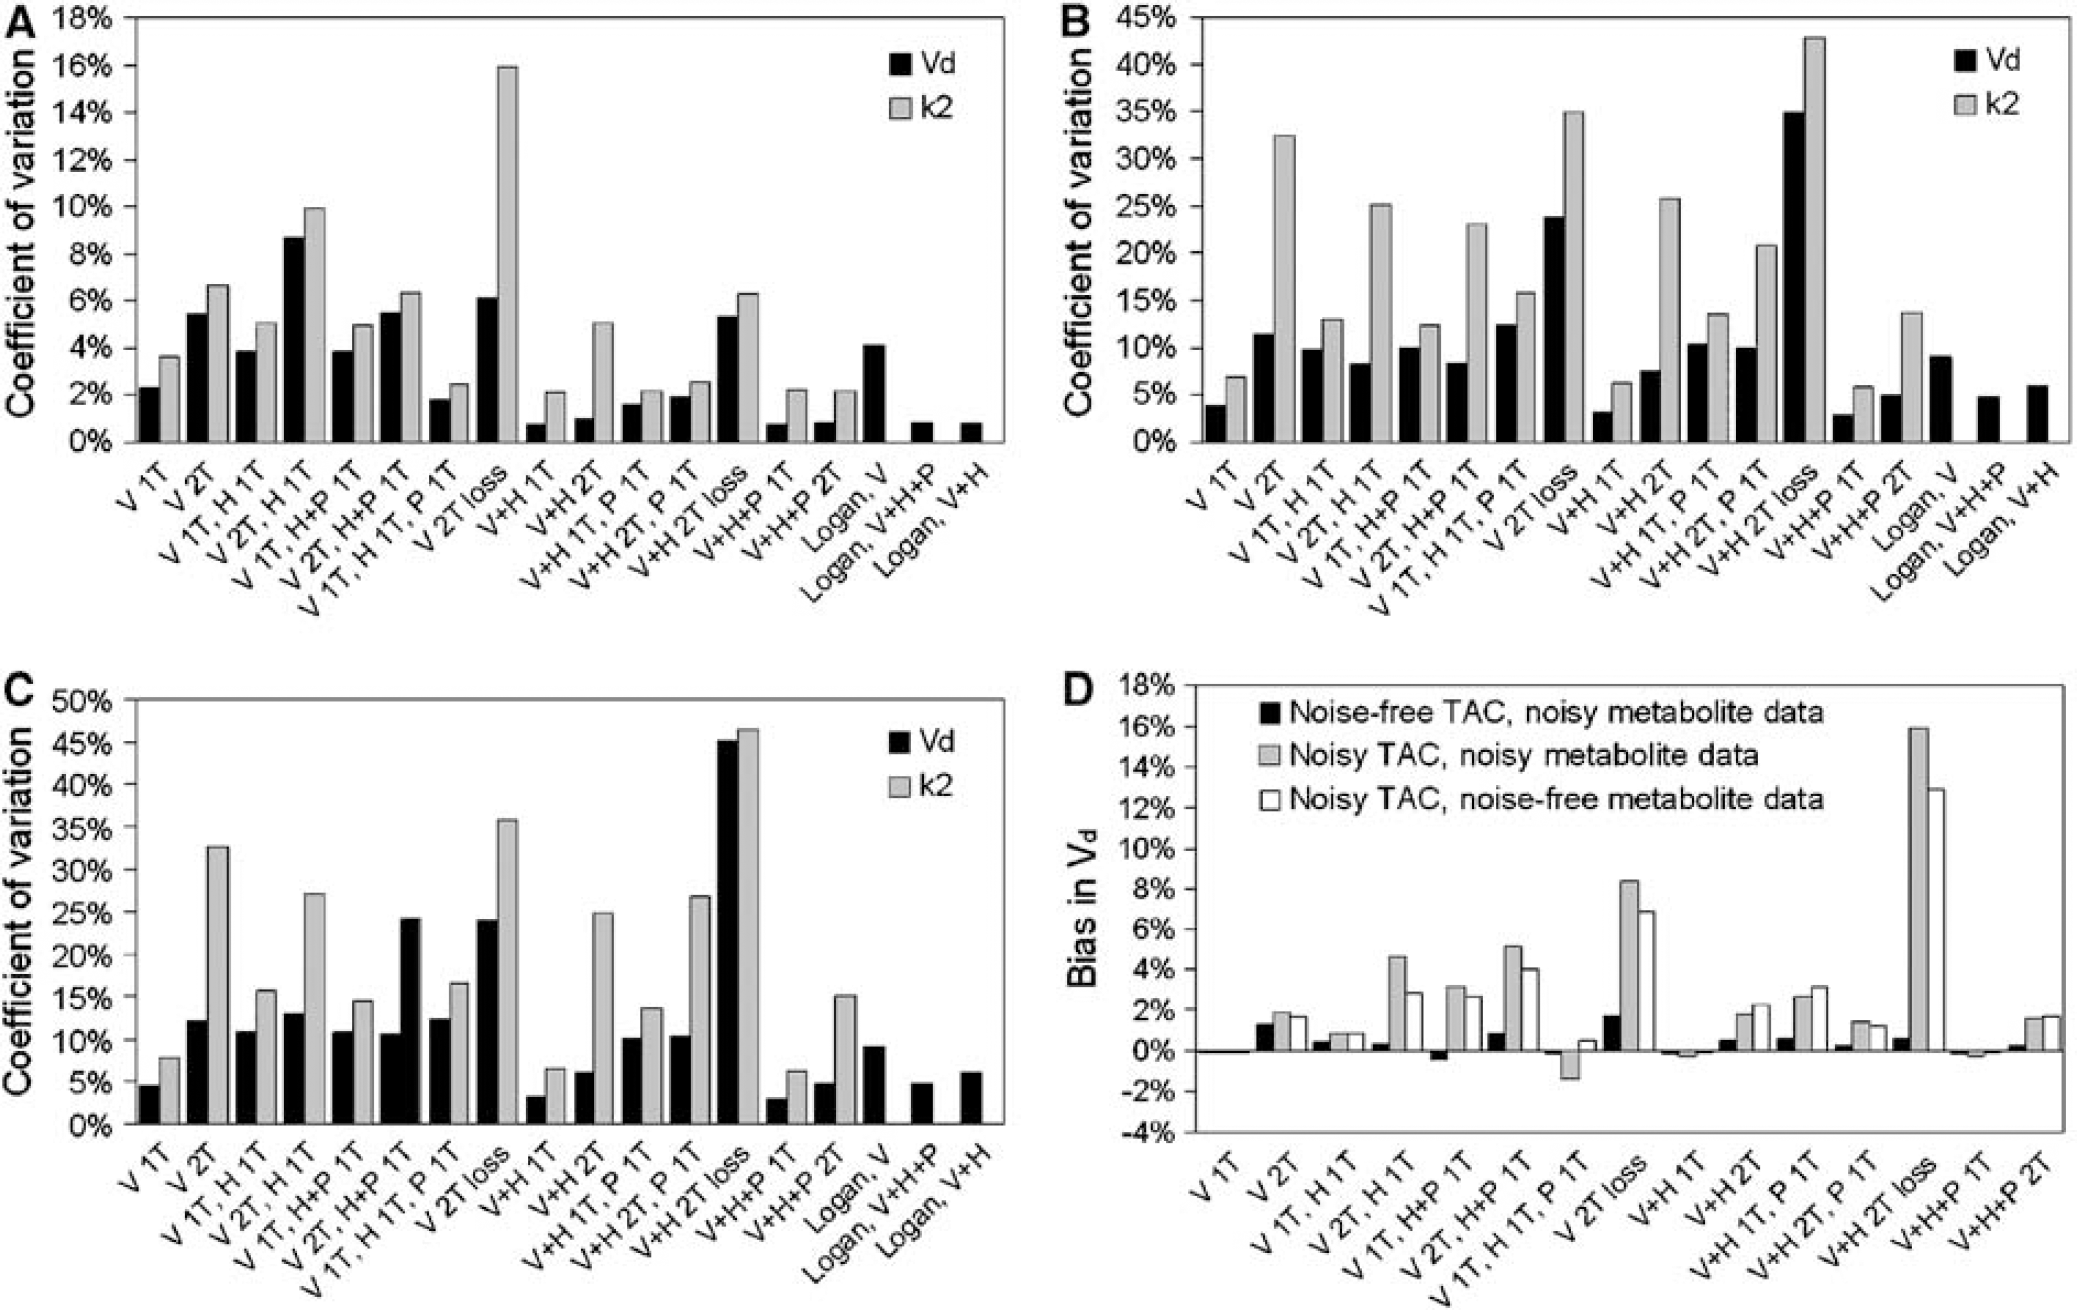
Coefficients of variation of Vd and k2 (
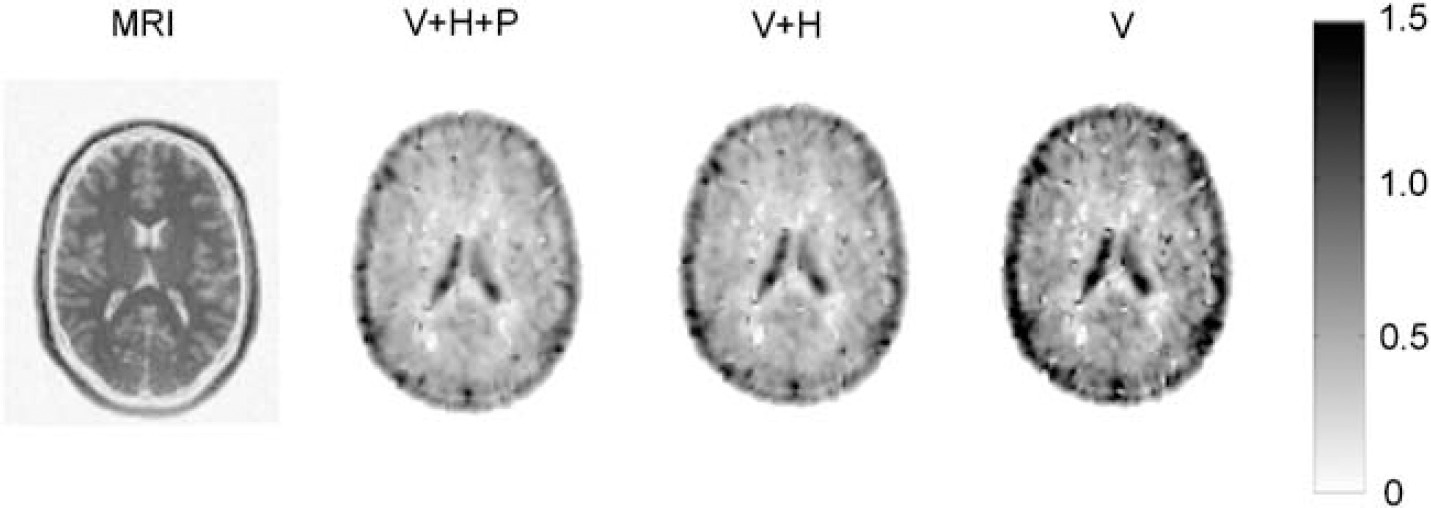
From left to right: T1-weighted magnetic resonance image and typical parametric Vd images of a central brain slice, obtained by Logan analysis without metabolite correction (V+ H + P), with correction for polar metabolites (V + H), and with correction for all metabolites (V). The colour bar reflects the scale of the Vd images.
Compartment models
Non-linear fits of whole brain grey matter only time–activity curves were performed using Matlab (The Math-works, Natick, MA, USA). Fractional blood volume was included as a fit parameter. For each of the fits the weighted sum of squared residuals (WSSR) and the Akaike information criterion (AIC) were calculated (Akaike, 1974). In addition, for each subject Akaike weights were calculated for all models (Turkheimer et al, 2003). Akaike weights, normalised to one for all fits together, give a relative probability of each model being the correct one for a given subject. These were then used for determining the model that performed best across subjects.
Graphical Analysis
Whole-brain grey matter Logan plots (Logan et al, 1990) were generated for each of the scans with or without correction for H and/or P metabolites. A standard blood volume of 7% was used for all subjects. In addition, parametric images of the volume of distribution were generated using voxel-by-voxel Logan analysis. The latter analysis was performed to address possible regional variations in uptake of (R)-[11C]verapamil.
Test–Retest Variability
Using data from the six subjects that were scanned twice, the test–retest variability of Vd, k2, and Vd, Logan was calculated for all models and Logan analyses as the absolute difference between the results of the test and retest scans, divided by the mean of these two values.
Simulations
The effects of metabolite correction, the number of compartments, and the inclusion of a metabolite input function on the accuracy and precision of the results of the kinetic analyses were assessed using Monte Carlo simulations. Poisson measurement uncertainties in tracer fraction and H and P metabolite fractions were calculated for five of the subjects based on the number of measured counts in the well counter for all measured samples. Subsequently, a standard, essentially noise-free data set was created by averaging the on-line whole blood radioactivity curves, parent fractions, H and P metabolite fractions, P/WB ratios and whole-brain grey matter TACs for all 16 scans. One hundred data sets were simulated by adding Gaussian noise, with s.d. corresponding to the estimated measurement uncertainties in tracer fraction, H and P metabolite fractions and P/WB ratios. An average noise level of 10%, distributed between frames according to the trues rate in each frame, was added to the TAC. All models were fitted to each of the simulated data sets and the coefficients of variation and bias relative to the result for noise-free data of Vd, k2, and Vd,Logan were calculated. For each of the simulated data sets, the optimal model was determined using AIC and WSSR.
Results
Plasma Metabolism
At 1 h p.i., the parent fraction was 45±9%, with 32±6% of the plasma radioactivity originating from H metabolites, and 23%± 6% from P metabolites. The H metabolite fraction consisted only of N-dealkylation products; O-demethylation products were not observed. Mean values for parent fraction, P and H metabolite fractions and P/WB ratio are given in Figure 3. The parent fraction measurement uncertainty varied from 1% for the first to 10% to 15% for the last sample, based on count statistics of the HPLC samples, which were comparable to those of other 11C-labelled tracers (Lubberink et al, 2004).
Fit Accuracy
All models, except the single-tissue (R)-[11C]verapamil only model, fitted the data well. Mean Akaike weights are given in Figure 4.
Graphical Analysis
Figure 5 shows Vd, tracer obtained from Logan analyses compared with corresponding compartment models. There is a good correlation between Logan analysis and compartment model without metabolite correction and after correction for P metabolites only.
Test-Retest Variability
No significant differences in parent and metabolite concentrations in plasma were found between test and retest studies. Figure 6 shows the test–retest variability for each of the evaluated models as well as for the various Logan analyses. There were no significant differences between Vd and k2 of test and retest studies using any of the compartment models. Logan analyses with full metabolite correction or correction for H metabolites only differed significantly according to a paired Student's t-test (P < 0.05), always showing a lower Vd for the retest scans.
Simulations
Figure 7 shows the CoV and bias of the volume of distribution of (R)-[11C]verapamil. The CoV of k2 is also given. With noise-free TACs, the highest mean Akaike weight was given to the two input, single-tissue compartment model assuming similar kinetics for both metabolite fractions. With noisy TACs, the highest mean Akaike weight was found for the single-tissue compartment model without any metabolite correction. This model also led to the lowest CoV irrespective of the TAC noise level.
Parametric Images
Figure 8 shows volume of distribution images obtained by Logan analysis, revealing a rather homogeneous uptake of (R)-[11C]verapamil across grey matter, with a slightly higher uptake in grey than in white matter and high uptake in the ventricles. The high cerebral spinal fluid (CSF) uptake of (R)-[11C]verapamil is caused by reversed P-gp transport at the blood-CSF barrier, resulting in active transport of verapamil into the CSF (de Lange, 2004).
Discussion
Plasma Metabolism
Previous studies have shown that metabolism in rats was mainly by N-demethylation, with minor fractions of N-dealkylation and O-demethylation metabolites. Around 70% of the blood radioactivity at 1 h p.i. was because of N-demethylation metabolites and a large accumulation of these metabolites in rat brain was found, amounting to up to 50% of the total brain activity at 1 h p.i. (Luurtsema et al, 2005). In humans, metabolism was found to be mainly by N-dealkylation and to a lesser extent N-demethylation, whereas O-demethylation products were not found. Approximately, 20% of the blood radioactivity in humans at 1h p.i. was because of N-demethylation metabolites, the polar fraction (P). Polar metabolites are generally not considered to enter the brain, but their high uptake in rat brain indicates either that part of this polar fraction does pass the BBB, or, less likely, that these metabolites are a product of in situ N-demethylation in the brain. The concentration of polar metabolites in the brain in humans is, if any, expected to be low because of the much smaller blood concentrations of these metabolites in humans compared with rats. In addition, N-dealkylation products (H) such as [11C]D617 probably cross the BBB and in vitro studies have shown that they are Pgp substrates that may have comparable kinetics as (R)-[11C]verapamil (Pauli-Magnus et al, 2000; Sasongko et al, 2005). The plasma kinetics measurements confirm that the metabolism of (R)-[11C]verapamil is slower than that of the racemic mixture and hence that of (S)-[11C]verapamil. In the present study, the percentage of unchanged metabolites in plasma was 57%± 10% at 40 mins p.i compared with around 35% at 45 mins p.i. for a racemic mixture (Sasongko et al, 2005), measured using the same method.
Model Evaluation
Based on the information above, a number of tracer kinetic models was evaluated assuming various underlying similarities or differences in kinetics of (R)-[11C]verapamil and the two metabolite fractions found in humans (Figure 2). In situ metabolism in the brain was also considered. Since, apart from the information above, there is no actual knowledge of the kinetics of the metabolites, the optimal model cannot be selected based on the accuracy of its description of the underlying biologic processes. Instead, fit accuracy together with precision and accuracy of the model outcome, being either Vd or k2, were used to determine the optimal model.
Fit Accuracy
Single-tissue compartment models without any metabolite correction or with correction for polar fraction only resulted in the highest mean Akaike weights. The spread in Akaike weights between subjects, however, was high, as indicated by the relatively large s.d. of the mean Akaike weights of these models in Figure 4. Additional models obtaining high Akaike weights were the two-tissue model with uptake of (R)-[11C]verapamil only followed by loss by metabolism, and the reversible two-tissue model with uptake of verapamil only. Models with generally low Akaike weights were the single-tissue model with uptake of only (R)-[11C]verapamil, which was the only model that resulted in visibly poor fits, and all models containing six parameters.
Model Precision and Accuracy
Test-retest variability and model precision as found in the simulation study was generally lower for Vd than for k2. This is expected because of the generally better precision and accuracy of macro-parameters compared with micro-parameters. No good correlation between Vd and k2 was found for any of the models. A reason for this may be that although k2, if measured accurately, may be a more direct measure of (R)-[11C]verapamil efflux and hence P-gp function, it is flow dependent, and it is more dependent on the late part of the input curve and thus on possible ingrowth of radioactive metabolites. The robustness of Vd, combined with earlier findings that increased P-gp modulation with cyclosporine leads to increased Vd of [11C]verapamil in rodents as well as humans (Bart et al, 2003; Sasongko et al, 2005), make it a better surrogate marker for measuring P-gp function.
Differences in test–retest variability between models corresponded well with differences in precision found in the simulation study. Five models showed an acceptable Vd test–retest variability of approximately 5% or better: single input models without metabolite correction (V + H + P 1T), with correction for P metabolites only (V + H 1T), and with correction for all metabolites (V 1T), and dual input models with either a two-tissue compartment fit for (R)-[11C]verapamil and H metabolites and a single-tissue compartment fit for P metabolites (V + H 2T, P 1T) or a single-tissue compartment fit for (R)-[11C]verapamil and a single-tissue compartment fit for all metabolites together (V 1T, H + P 1T).
The model with full metabolite correction (V 1T) can be discarded because of its poor fit quality. The V 1T, H + P 1T model leads to a higher bias than the other models in case of noisy PET data, and is biologically not very likely because P metabolites are expected to behave differently from (R)-[11C]verapamil and H metabolites. This argument also applies to the model without any metabolite correction, V + H + P 1T, although it fits the data well and results in the highest mean Akaike weight.
Thus, considering both fit quality and precision, two models remain: the single input, single-tissue compartment model with correction for P metabolites (V + H 1T) and the two-tissue compartment model assuming similar kinetics for (R)-[11C]verapamil and H metabolites combined with a P metabolite compartment (V + H 2T, P 1T). The singletissue compartment model with correction for P metabolites only has the second highest mean Akaike weights, although the variations between subjects are large. The other remaining model (V + H 2T, P 1T) gave a low Akaike weight because of the large number of parameters, and a poorer precision than the other models in case of noisy PET data as seen in Figure 7. However, it is the only model that separately accounts for possible uptake of P metabolites that has good test–retest variability, and its bias is the lowest among the more complex models.
Effects of Metabolites
For any given model, noise in TACs has a much larger effect on precision than noise in metabolite data. The variations in precision between the different models can be explained by both metabolite data noise, resulting in a poorer precision for models with more input functions, and by the number of model parameters. This results for example in a poorer precision of a model assuming different kinetics of (R)-[11C]verapamil and H metabolites (V 1T, H 1T) than of a model assuming similar kinetics of these two fractions (V + H 1T). This effect is less pronounced with separate treatment of the P metabolite fraction since its measurement uncertainty is smaller than that of the other two fractions. As seen in Figure 8, any model where (R)-[11C]verapamil and H metabolites are treated separately shows a poorer precision than models where these two fractions were treated as having similar kinetics.
Assuming different kinetics for (R)-[11C]verapamil and metabolite fractions generally leads to a slightly lower Vd of (R)-[11C]verapamil as compared with assuming similar kinetics. Furthermore, addition of an extra P metabolite compartment to a V + H compartment model or assuming similar kinetics of the P metabolite fraction both lead to a relatively small decrease in Vd, which indicates that the contribution of P metabolites to the brain signal is indeed small. This is confirmed by the fact that Vd values obtained using only the first 30 min of the scan, when the P metabolite fraction is even smaller, are very similar to those found using the whole scan (Figure 9).
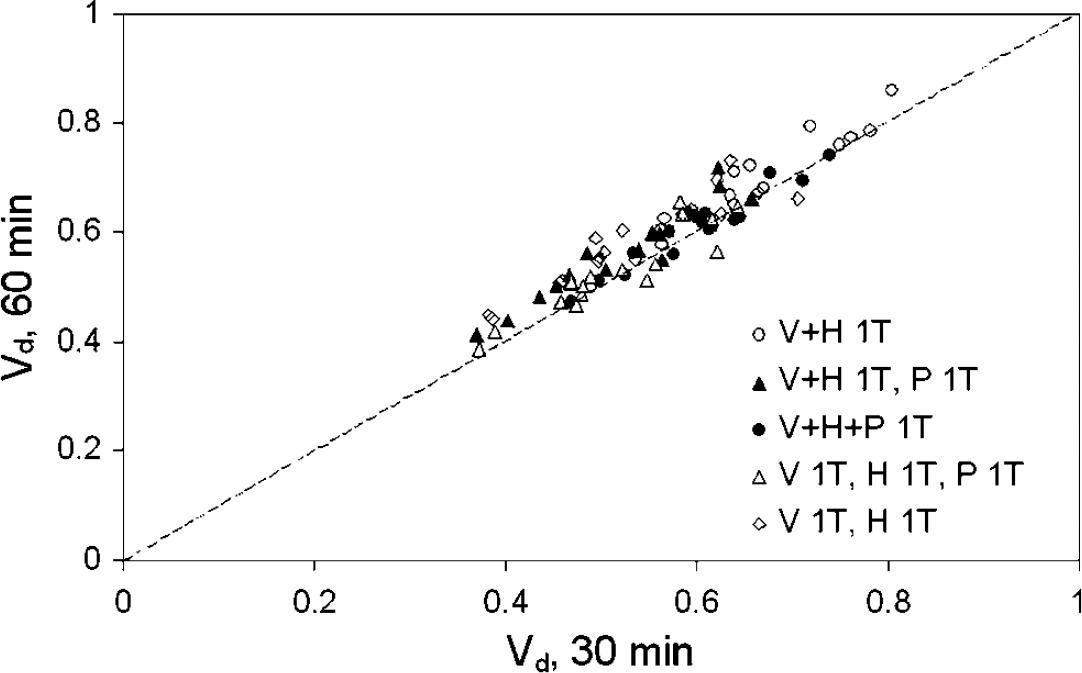
Vd values based on the first 30 min of the PET data compared with corresponding data over the complete 60 min interval.
Individual patient data do not give an unambiguous answer to the question of how many input functions and compartments can best describe the measured whole brain time–activity curves. A model without any metabolite corrections most likely does not reflect biologic reality, since P metabolites are expected to behave very differently than (R)-[11C]verapamil and H metabolites. Performing no metabolite correction at all is tempting, especially as it describes the data well with only few parameters. In that case, however, it would not be possible to account for possible differences in metabolism because of age, disease or medication. This, in turn, may lead to erroneous outcomes (variable bias) when studying effects of diseases on P-gp function with (R)-[11C]verapamil. Full metabolite correction, however, assuming that none of the metabolites cross the BBB, gives a poor description of the data in case of a singletissue compartment model, and a low precision in case of a two-tissue compartment model. Two models that are biologically possible, describe the data well, and show good precision and accuracy are the single- and two-tissue compartment models assuming identical kinetics for (R)-[11C]verapamil and H metabolites. The two-tissue model, however, requires a separate P metabolite compartment, which leads to higher bias in case of noisy PET data. Since the single input, singletissue compartment model using the sum of (R)-[11C]verapamil and H metabolites in plasma as input function is the preferred model according to the AIC and has the lowest test–retest variability, this will be the model of choice for further studies with (R)-[11C]verapamil. Nevertheless, futher studies are required to assess the contribution of labelled metabolites to the signal, for example by performing separate studies after injection of these metabolites.
Graphical Analysis
Correlation between Vd obtained by Logan graphical analysis and by corresponding compartment models was good, as shown in Figure 5. A disadvantage of the Logan method is that fractional blood volume can at best be included as a fixed parameter. The significant difference between test and retest Vd values found using Logan analysis is likely the result of fixing blood volume, as the actual blood volumes, determined as fit parameter in the compartment fits, were on average 9% lower in the afternoon scans than in the morning scans (P< 0.05). This did not affect the results of the compartment analyses since blood volume was included as a fit parameter, that is no significant difference between test and retest Vd was observed with any of the compartment models. An important advantage of Logan analysis is the possibility to create parametric Vd images as shown in Figure 8. This would make it an ideal method for a first pass analysis, such as voxel-by-voxel statistical analysis or for selecting tissues of interest for ROI definition. The results of the present study, however, make it clear that the final quantitative analysis should be based on fitting time–activity curves including a blood volume parameter.
Conclusion
In the present study, tracer kinetic models for quantification of P-gp function using (R)-[11C]verapamil were evaluated. Studies of various neurodegenerative diseases with (R)-[11C]verapamil may be affected by the inclusion of radioactive metabolites in the tracer kinetic model, primarily by showing reduced sensitivity to changes in P-gp function. PET scans of labelled metabolites of (R)-[11C]verapamil themselves could give more insight in the kinetics of these metabolites (Gunn et al, 2000; Price et al, 2001). Such future studies should indicate whether the contribution of labelled metabolites should be taken into acount in a more sophisticated manner. Heterogeneous tissue uptake and P-gp function, although not observed by visual inspection of the radioactivity concentration or parametric images (Figure 8), may complicate the search for the optimal model using a whole-brain grey matter ROI. Therefore, future investigations will involve the use of smaller ROIs and parametric images to study regional differences in uptake of either (R)-[11C]verapamil or its metabolites using multiinput spectral analysis, allowing for parametric images based on more than one input function (Lubberink et al, 2005). Further studies should also increase the understanding of the biologic meaning of the rate constants in the kinetic models.
In conclusion, at present, the model of choice for kinetic analysis of (R)-[11C]verapamil is a single input, single-tissue compartment model with the sum of (R)-[11C]verapamil and N-dealkylation metabolites in plasma as input function, using Vd as a surrogate marker for P-gp function. This model is the optimal compromise between fit accuracy, precision and biologic likelihood.
Footnotes
Acknowledgements
The authors thank Abbott Pharmaceuticals, The Netherlands, for their kind gift of the precursor nor-verapamil and (R)-verapamil, the staff at the Department of Nuclear Medicine and PET Research for their assistance with the production of (R)-verapamil and PET scanning and Dr Harry Hendrikse for valuable discussions.