
Abstract
There is increasing interest in using algorithms combining multiple magnetic resonance imaging (MRI) modalities to predict tissue infarction in acute human stroke. We developed and tested a voxel-based generalized linear model (GLM) algorithm to predict tissue infarction in an animal stroke model in order to directly compare predicted outcome with the tissue's histologic outcome, and to evaluate the potential for assessing therapeutic efficacy using these multiparametric algorithms. With acute MRI acquired after unilateral embolic stroke in rats (n = 8), a GLM was developed and used to predict infarction on a voxel-wise basis for saline (n = 6) and recombinant tissue plasminogen activator (rt-PA) treatment (n = 7) arms of a trial of delayed thrombolytic therapy in rats. Pretreatment predicted outcome compared with post-treatment histology was highly accurate in saline-treated rats (0.92±0.05). Accuracy was significantly reduced (P=0.04) in rt-PA-treated animals (0.86±0.08), although no significant difference was detected when comparing histologic lesion volumes. Animals that reperfused had significantly lower (P < 0.01) GLM-predicted infarction risk (0.73±0.03) than nonreperfused animals (0.81 ± 0.05), possibly reflecting less severe initial ischemic injury and therefore tissue likely more amenable to therapy. Our results show that acute MRI-based algorithms can predict tissue infarction with high accuracy in animals not receiving thrombolytic therapy. Furthermore, alterations in disease progression due to treatment were more sensitively monitored with our voxel-based analysis techniques than with volumetric approaches. Our study shows that predictive algorithms are promising metrics for diagnosis, prognosis and therapeutic evaluation after acute stroke that can translate readily from preclinical to clinical settings.
Keywords
Introduction
Thrombolysis with intravenous recombinant tissue plasminogen activator (rt-PA) has been shown to be an effective therapy for acute ischemic stroke patients when administered within 3 h of symptom onset (NINDS rt-PA Stroke Study Group, 1995). However, it has been argued that this therapeutic time window of 3 h is too narrow in some cases, thereby unnecessarily excluding patients who may benefit from thrombolytic therapy (Rother et al, 2002; Fiehler et al, 2004; Hacke et al, 2004). It has been suggested that neuroimaging can provide a guideline for optimizing treatment on an individual patient basis (Warach, 2001; Schellinger et al, 2003; Levine, 2004). Diffusion-weighted and perfusion-weighted magnetic resonance imaging (MRI) (DWI and PWI, respectively) are sensitive and specific tools for diagnosing acute human stroke (Sorensen et al, 1996; Lutsep et al, 1997; Gonzalez et al, 1999). Cluster-analysis algorithms combining multimodal MRI have been validated against histology in experimental stroke settings (Jiang et al, 1997; Carano et al, 2000; Jacobs et al, 2001; Soltanian-Zadeh et al, 2003; Shen et al, 2004). However, these models are limited to outputs that represent discrete states of infarction, thereby ignoring the fact that degree of tissue injury or salvageability varies continuously. These drawbacks are circumvented by use of statistical algorithms that calculate the likelihood of future infarction on an individual voxel basis (Wu et al, 2001; Shen et al, 2005). Shen et al (2005) showed that algorithms using probability density functions produced infarction risk maps that correlated well with histology in experimental animal stroke models. However, the performance of these models in acute stroke patients has not been shown. Wu et al (2001) have successfully applied multiparametric algorithms using a generalized linear model (GLM) to predict risk maps of infarction in a cohort of acute-stroke patients with both high sensitivity and specificity. Although the development of the models is computationally complex, the prediction of infarction risk on an individual voxel basis is straightforward once the coefficients have been derived. Furthermore, the coefficients can provide insight into the relative importance of the different imaging parameters. However, the GLM's performance has so far been only compared against follow-up imaging studies in humans, which can be confounded by inexact infarct assignment, and other factors such as variations in follow-up times, patient management or disease etiology. Applying predictive algorithms to experimental models minimizes such confounding factors, and allows for direct comparison of predicted outcome with histologically measured tissue infarction. Moreover, one is able to test these algorithms' efficacy to monitor dynamics of neuronal injury and recovery for both ‘natural history’ and treatment settings.
The goals of this study were (1) to determine whether MRI-based GLM-predicted lesion volumes correlate with histologically measured infarction volumes in experimental animal models of embolic stroke, and (2) to assess the efficacy of these algorithms for identifying treatment-induced changes to tissue in animals with stroke that receive therapeutic intervention. One can speculate that the pretreatment predicted infarction risk is the likely fate of tissue if the ischemic cascade is allowed to proceed unimpeded. Thus, if the post-treatment measured tissue outcome is significantly smaller than the pretreatment predicted tissue outcome, one can infer that an intervention was successful by saving tissue that would otherwise have infarcted. Toward this goal, three groups of experimental embolic stroke studies in rats were retrospectively analyzed. A predictive model was trained on data from untreated animals. The model's ability to predict histological outcome and detect treatment effects was then tested in a second and third group, consisting of animals from, respectively, the control and treatment arms of a trial of delayed thrombolytic treatment with rt-PA (Dijkhuizen et al, 2001).
Materials and methods
Animal procedures
Experimental protocols were institutionally approved in accordance with the NIH Guide for the Care and Use of Laboratory Animals. All analyses were performed retrospectively and results involving volumetric MRI findings have been reported previously (Dijkhuizen et al, 2001, 2003). Unilateral stroke was induced in male normotensive Sprague-Dawley rats (SDR) (290 to 380 g) and male spontaneously hypertensive rats (SHR) (300 to 350g; Taconic, Germantown, NY, USA) by embolic occlusion of the right middle cerebral artery (MCA) with a homologous blood clot, as described previously (Asahi et al, 2000). Before MRI, rats were tracheotomized and mechanically ventilated with 1% halothane in O2:N2O (1:2). The right femoral artery was catheterized for monitoring of arterial blood pressure, pCO2, pO2 and pH. The right femoral vein and jugular vein were cannulated for administration of therapeutic agent and contrast agent, respectively.
For the SDR, approximately 1 h after MCA occlusion, saline (n = 8) was intravenously injected. For the SHR, approximately 6 h after MCA occlusion, saline (n = 6) or human rt-PA (Genentech, San Francisco, CA, USA) (n = 7) was intravenously administered (2 mg/mL; 10 mg/kg). After the MRI experiments for the SHR groups, rats were killed by a lethal overdose of sodium pentobarbital and transcardially perfused with phosphate-buffered saline. Brains were removed, cut in 2-mm coronal sections and stained with 2% 2,3,5-triphenyltetrazolium chloride (TTC) for 30 mins.
Magnetic resonance imaging
All MRI was acquired on a 2.0-T nuclear magnetic resonance system (SISCO/Varian Instruments), using a surface coil (3 cm diameter). During the MRI experiments, body temperature, blood pressure and blood gases were carefully controlled, and maintained at normal values. Magnetic resonance imaging experiments were performed between 0.5 and 6 h after MCA occlusion for the SDR, and between 4 and 9 h after MCA occlusion, that is, 2 h before and 3 h after saline or rt-PA administration, for the SHR.
Multislice DWI was performed using a spin-echo sequence (repetition time/echo time (TR/TE) = 2000/40 ms; field-of-view (FOV) = 25 × 25 mm2; 64 × 64 data matrix; nine contiguous 1.5 mm slices), with three b-values (150, 850, 1550 secs/mm2) and diffusion-encoding gradients in x, y and z direction, allowing calculation of direction-independent mean trace apparent diffusion coefficient (ADC) maps.
Single-slice PWI (gradient recalled echo planar imaging; TR/TE = 175/22 ms; FOV = 25 × 25 mm2; 32 × 32 data matrix, zero-filled to 64 × 64; slice thickness 1.5 mm; 500 consecutive images) was acquired in combination with an intravenous bolus injection of Gd-diethylenetetraminepenta-acetic acid (Berlex Laboratories, Wayne, NJ, USA) (0.5 mmol/L; 0.5 mL/kg). A brain slice encompassing a relatively large portion of the MCA territory, at approximately 1 mm posterior to bregma according to Paxinos and Watson (1997), was selected. Estimates of the relative regional cerebral blood flow (rCBF), cerebral blood volume (rCBV) and mean transit time (rMTT) were produced by deconvolving concentration of contrast agent in tissue versus time curves (converted from PWI signal intensity curves) with an arterial input function measured from the contralateral hemisphere (Østergaard et al, 1996).
Data analysis
Acute MRI data from the SDR (Group 1) were used to train models that predict the risk of infarction on a voxel-wise basis. Saline-treated SHR (Group 2) were used to assess the accuracy of this model to predict the histological outcome. rt-PA-treated SHR (Group 3) were used to evaluate assessment of treatment effects with predictive models.
Apparent diffusion coefficient maps were coregistered to the single slice acquired in the PWI experiments using a 2D affine six-parameter transformation calculated by semiautomated image registration software package (AIR 5.2.3, UCLA) (Woods et al, 1992). The coregistered acute MRI slices were normalized with respect to mean measured parenchymal values in the contralateral hemisphere. These relative values (rADC, rCBF, rCBV, rMTT) were used to train a GLM to estimate infarction risk (Wu et al, 2001). In brief, in this algorithm, the outcome status of tissue is modeled as a binary variable, P, where the value 1 represents infarcted tissue and the value 0 noninfarcted tissue. In a GLM, the probability that tissue will infarct given a set of input parameters, x, can then be represented by the logistic function:
where η(x), the predictor, is a linear function of x:

and β is a vector of calculated coefficients and α is the bias or intercept term for the GLM.
The coefficients and intercept term that characterize a GLM are calculated using a supervised learning algorithm, where the tissue outcome is a priori known in the training data group, in this case Group 1. For Group 1, tissue outcome was defined as the ADC lesion volume, that is, ipsilateral parenchymal brain tissue with ADC values greater than two standard deviations (s.d.) from the mean ADC in contralateral tissue, at the final MRI time point (6 h post-stroke). Training regions were then defined as the ADC lesion volume and all other ipsilateral brain tissue as noninfarcted. Given the acute rADC, rCBF, rCBV and rMTT values in these coregistered training regions as the input parameters, x, the coefficients and intercept terms for the GLMs, β and α, were then calculated using an iterative re-weighted least-squares algorithm (S-PLUS 6.1.2, Insightful). The number of parameters to include in the model was based on the Akaike Information Criterion (AIC), whereby terms were included if their addition resulted in reductions in prediction error values that were a function of both training error and complexity (Bishop, 1995). In selecting covariates, independent parameters rADC, rCBF and rCBV were considered first for inclusion, followed by the higher-order parameter rMTT. Using the calculated coefficients and equations (1) and (2), the risk of tissue infarction can then be produced on an individual voxel-wise basis for data from a new subject.
To evaluate the performance of the GLMs within Group 1, a jack-knifing or leave-one-out approach was followed, where the coefficients for each rat was calculated using the data from the other Group 1 rats for training data (Efron, 1982). Jack-knifing was used to avoid bias that otherwise occurs if the model's performance were evaluated on the same data that was used to train the model. For predicting the risk of infarction for the SHR cohort, data from all Group 1 rats were used to train a GLM (ALL model). For all models, the bootstrapped estimate of the mean of the GLM coefficients were used, with care taken that an equal number of infarcted and noninfarcted samples were used for each iteration (Efron, 1982). To test the effects of reperfusion on our models, analyses were repeated for the following Group 1 cohorts: rats with no reperfusion (No-Reperfusion) and rats with reperfusion (Reperfusion). Based on the final relative CBF values (at approximately 6 h after-MCA occlusion for SDR; at approximately 9 h after-MCA occlusion for SHR) with respect to pretreatment values (ΔCBF), rats were categorized as nonreperfused (ΔCBF < 50%) or reperfused (ΔCBF <50%). The calculated coefficients for each of these submodels were compared with a model trained using data from all data using one-tailed Z-tests.
For evaluating the accuracy of the GLM predictions, sensitivity or true positive ratio (TPR) and specificity or true negative ratio (TNR) of the model for identifying abnormal tissue were calculated along with receiver-operating characteristic (ROC) curves, by varying the probability threshold for classifying tissue as infarct or not between 0% and 100%. The TPR is the ratio of the number of voxels correctly predicted to infarct to the total number of voxels predicted to infarct. The TNR is the ratio of number of voxels correctly predicted to not infarct to the total number of voxels predicted to not infarct. The area under the ROC curves (AUC), which represents the probability that tissue will be correctly classified normal or abnormal, was used to assess the performance of the models (Hanley and McNeil, 1982). The AUCs were calculated using numerical integration and compared across groups (one-tailed Wilcoxon rank-sum test). The Youden's J index (Youden, 1950), defined as sensitivity + specificity—1, was also calculated and compared across groups to assess the overall performance of the algorithms at a single decision threshold of 50% for classification of infarcted tissue. Youden J index = 0 indicates no diagnostic value, while J= 1 indicates perfect diagnosis. Negative values can arise if results are negatively associated with the true diagnosis (Armitage and Berry, 1994).
The predicted lesion volume was defined as tissue where the GLM predicted risk of infarction ⩾ 50%. Hemispheric lesion volume percentages were calculated by dividing the lesion volume by the volume of the ipsilateral hemisphere (Dijkhuizen et al, 1997). Due to the retrospective nature of this study, TTC-stained sections were not available for Group 1 (Dijkhuizen et al, 2003). As ADC lesion volumes > 3 h from occlusion had been shown to be similar to the TTC infarct volume at 24 h for SDR (Bardutzky et al, 2005), for Group 1, infarct volumes were objectively calculated from ADC maps acquired at the last MRI (6 h post-occlusion) as described above. For Groups 2 and 3, lesion volumes were defined manually as unstained regions on TTC-stained sections by a neuroscientist blinded to the results of the GLM. Correlations between measured hemispheric lesion volume (MLV) based on either final ADC maps (Group 1) or TTC-stained sections (Groups 2 and 3) and predicted hemispheric lesion volume (PLV) were tested (Pearson product-moment correlation coefficient).
Follow-up images for all groups were coregistered to the acute PWI slice using a 2D affine six parameter transformation calculated using the same image registration package used to coregister acute MRI parameters to one another. For TTC-stained brain sections (Groups 2 and 3), images were first converted to gray-scale images. The derived affine transformations were then applied to delineated lesions volumes using nearest-neighbor interpolation to define regions of interest (ROI) in acute PWI coordinates. Generalized linear model predicted values in the PLV in regions that truly infarcted (true positives (TP)) versus tissue that did not (false positives (FP)) were compared (paired one-tailed Wilcoxon signed-rank test). For tissue not in the PLV (< 50%), the GLM calculated risk of infarction in tissue that infarcted (false negatives or FN) was compared with those that did not (true negatives (TN)) (paired one-tailed Wilcoxon signed-rank test).
Results
Volumetric analysis
Table 1 shows values of acute pretreatment DWI and PWI parameters in tissue that infarcted as compared with noninfarcted tissue in the coregistered data sets. For all groups, acute rADC, rCBF and rCBV were significantly lower in tissue that became infarcted. Only Group 1 had rMTT values significantly greater in tissue that became infarcted. For infarcted tissue, rADC values were significantly lower in Group 2 than in Group 1 (P < 0.01) and Group 3 (P < 0.01). No significant difference was found between Group 1 and Group 3 rADC values. Though there was a tendency for rCBF to be lower in Group 2 than Group 1 and Group 3, no significant difference was found in infarcted tissue for acute rCBF, rCBV and rMTT values between all groups. This suggests that Group 2 animals may have had more severe initial ischemic injury compared to Group 1 and to Group 3. No significant differences between Group 1 and Group 3 acute imaging parameters were found.
Acute DWI and PWI parameter values in tissue that becomes infarcted (% of contralateral)
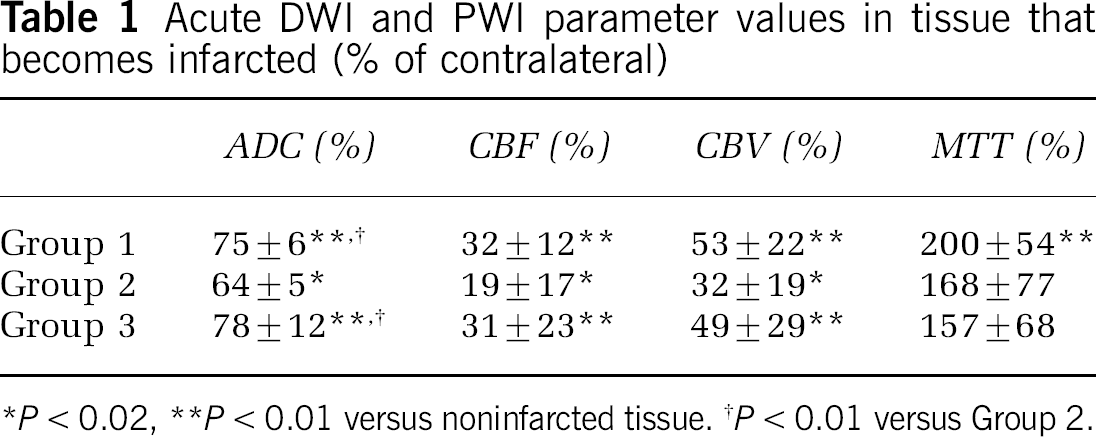
P < 0.02
P < 0.01 versus noninfarcted tissue.
P < 0.01 versus Group 2.
Reperfusion by the final MRI time point occurred in two animals in both Group 1 and Group 3. No animals in Group 2 reperfused. In Group 1, one animal that reperfused had increased flow immediately after administration of saline (∼ 1 h postocclusion), but showed secondary perfusion deficit at 2 h, only to reperfuse by the end of the study at 3 h. For the second reperfuser, sustained reperfusion was noted after saline injection (∼ 1 h post-occlusion). For the Group 3 reperfusers, both rats showed restored flow after rt-PA administration (∼ 7 h postocclusion). No significant differences in MLV were found between Group 1 (55% ± 16%), Group 2 (54% ± 7%) and Group 3 (42% ± 23%).
Voxel-wise analysis
The GLM coefficients of the aggregate model derived from all Group 1 training data are shown in Table 2 for models using all data from Group 1 (ALL), only data from the nonreperfusers (No-Reperfusion), and using data from only the reperfusers (Reperfusion). Based on the AIC, a model incorporating all input parameters, rADC, rCBF, rCBV and rMTT was found to provide the best prediction. There was no significant difference between the coefficients for the model using all eight rats and the No-Reperfusion animals, except for the rMTT coefficient. For the Reperfusion model, all coefficients, with the exception of Bias, were significantly different from the model built using all eight animals (ALL).
GLM coefficients for Group 1 models for population subgroups
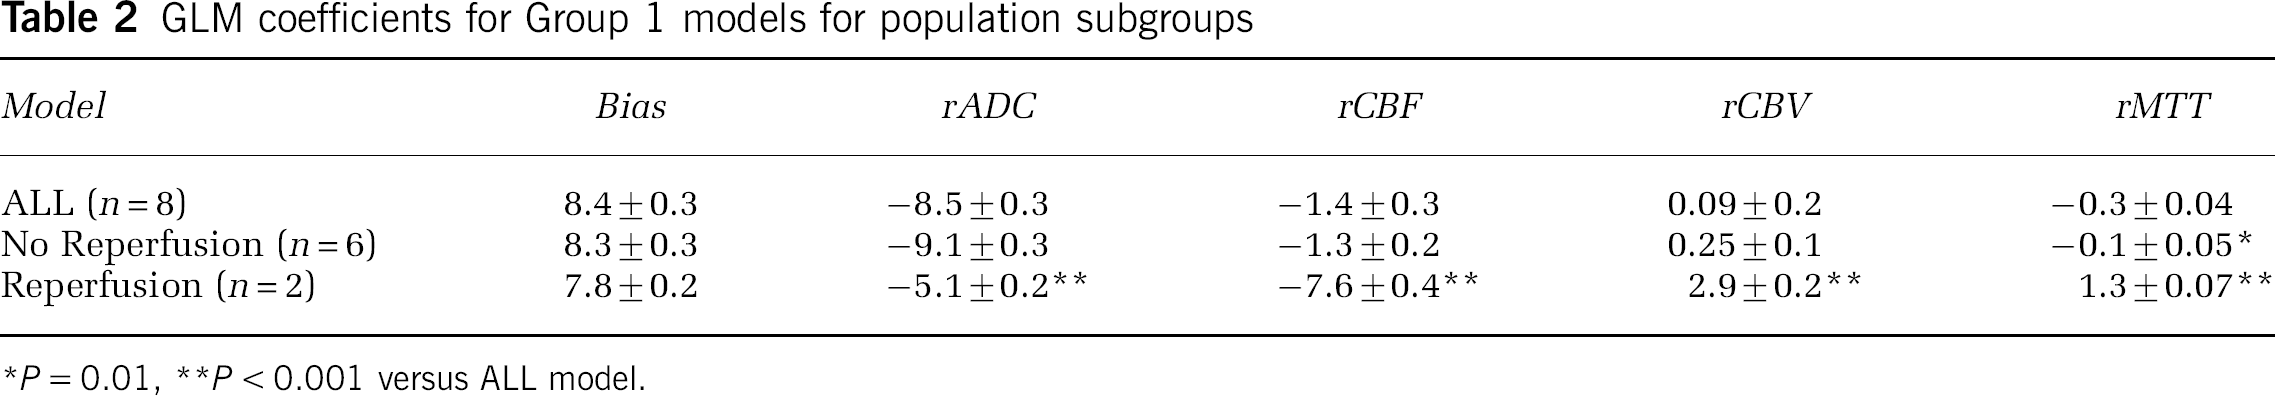
P = 0.01
P < 0.001 versus ALL model.
The coefficients of these models were then applied to acute MRI data from Group 2 and Group 3. The Youden J index for each individual rat for discriminating infarcted from noninfarcted tissue was calculated using a decision threshold of 50%. The J index was significantly larger (P =0.03) for the saline-treated Group 2 (0.76± 0.1) than for rt-PA-treated Group 3 (0.52 ± 0.3). No significant difference was found between Group 1 (0.71± 0.1) and the other groups. The Youden J index significantly decreased (P < 0.01) in Group 1 when evaluated with the Reperfusion model. This is likely due to the reliance of training only on two data sets for six of the eight rats, and use of only one data set in the jack-knifed evaluation for the two animals that reperfused. There is no statistically significant difference between the Youden J indices for the three GLM models (ALL, Reperfusion, No-Reperfusion) for Group 2 and Group 3. However, the Youden J index increases for the two Group 2 rats that exhibited reperfusion using the reperfusion model (from 0.15 to 0.65 and 0.03 to 0.43). This is offset by a reduction of the Youden J index in animals that did not reperfuse (from 0.69 ±0.1 to 0.59 ± 0.09). Because of its greater accuracy, we limit the remainder of this results section to the ALL model.
Figure 1 shows GLM risk maps predicted using the ALL model along with corresponding input parameters and histology for a saline-treated Group 2 rat (A) and rt-PA treated Group 3 rats (B, C). For the rt-PA-treated animals, examples of GLM performance in the absence (B) and presence (C) of reperfusion are shown. The predicted infarct volumes correspond well with the infarct volumes exhibited on the TTC-stained brain sections for the saline-treated (A) and rt-PA-treated (B) rats that did not reperfuse. In comparison, infarct size was overestimated in rt-PA-treated rats that exhibited reperfusion (C). This effect is also evident in the ROC curves for pooled data across all animals within Group 2 and Group 3 (Figure 2). Poorer predictive performance is observed in animals that received rt-PA (Group 3) compared with animals receiving saline (Group 2). The AUCs for salinetreated animals using the ALL model for Group 1 (0.927 0.05) and Group 2 (0.92± 0.05) were significantly larger (P =0.04) than the AUCs for rt-PA-treated animals (0.86 ±0.08). No statistically significant difference in AUCs was found between the two saline-treated groups (Group 1 and Group 2).
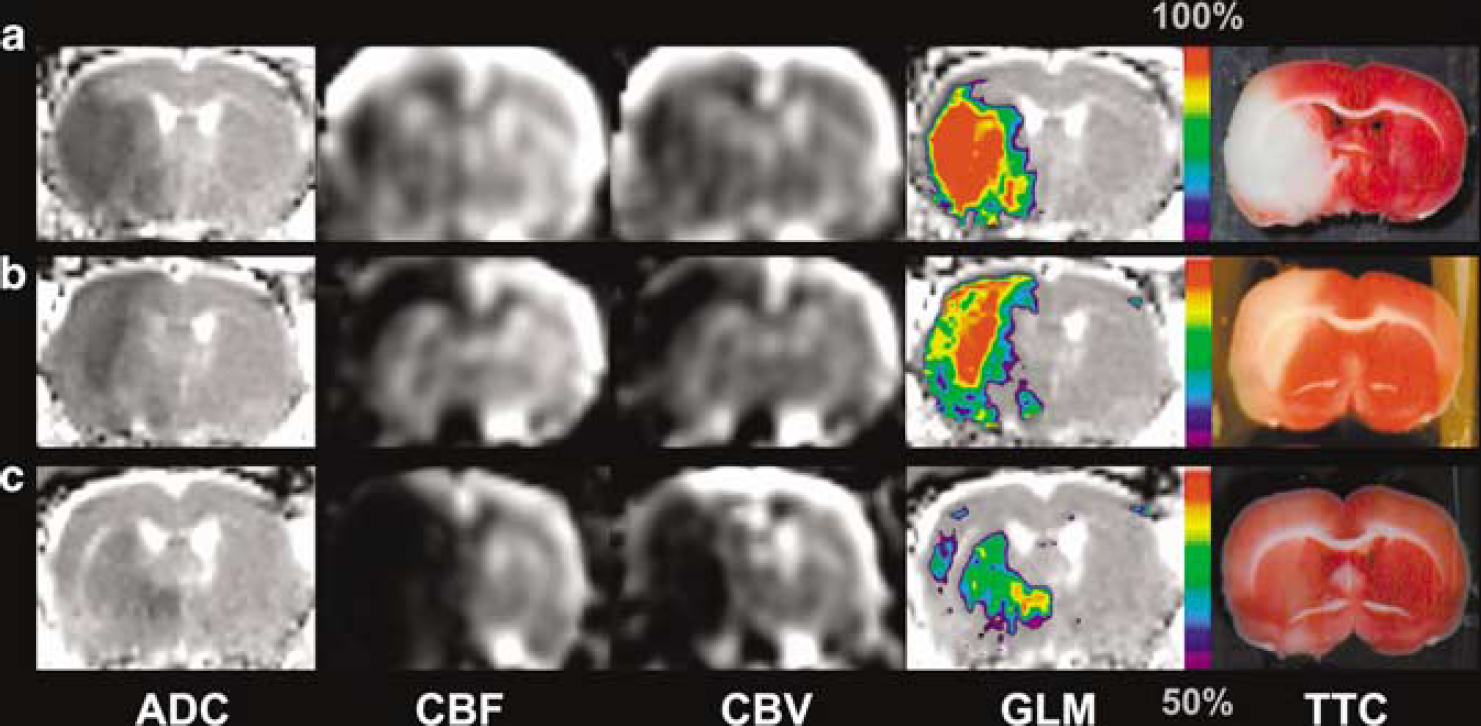
Acute ADC, cerebral blood flow (CBF), cerebral blood volume (CBV) maps and GLM-based calculated risk of infarction along with corresponding TTC-stained brain sections for saline-treated (
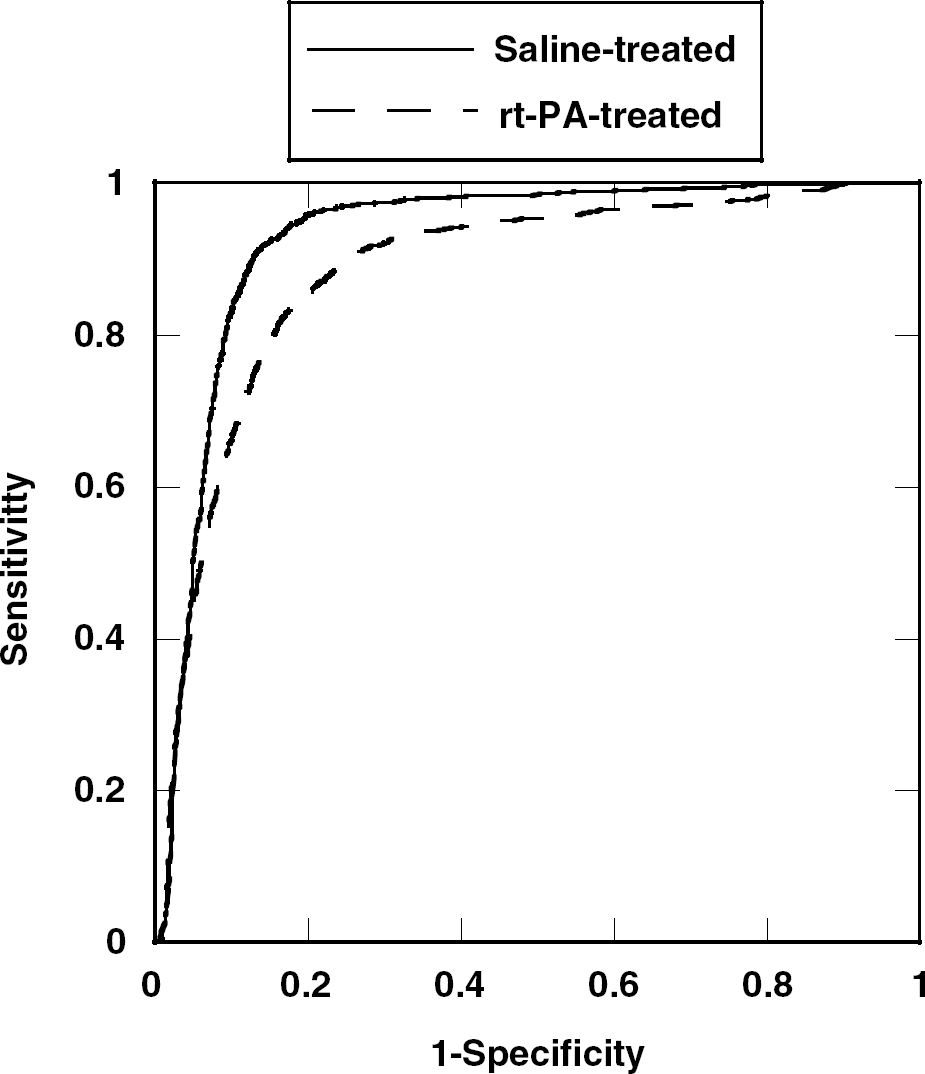
Receiver-operating characteristic curves reflecting performance of the algorithm in predicting tissue outcome for saline-treated compared with rt-PA-treated animals. The lower AUC indicates poorer predictive performance of the algorithms for animals that received rt-PA (P = 0.04).
Predicted hemispheric lesion volumes for Group 1 and Group 2 were significantly positively correlated with the measured lesion volumes (r =0.77, P =0.01; r= 0.73, P < 0.05, respectively), but not for Group 3 (r =0.66, P > 0.05). In one Group 3 animal with reperfusion, the predicted lesion volume (36%) was much larger than the measured lesion volume (3%). The other treated animal with reperfusion had similar predicted and measured lesion volumes (17%). However, in this animal, the final lesion was displaced from its predicted lesion volume, as reflected by the low J index (0.03), suggesting that the clot was only partially lysed. For the spontaneous reperfusers in Group 1, in the rat with secondary hypoperfusion, the measured lesion volume (53%) was slightly larger than what was predicted (43%), while in another with sustained reperfusion, the MLV (22%) was smaller than the PLV (41%). The Youden J indices for these cases were 0.67 and 0.42, respectively.
Analysis of the predicted risk of infarction in the PLV in TP versus FP showed significantly greater risk of infarction in the TP regions for only the saline-treated animals (Group 1, P < 0.01; Group 2, P = 0.02). For tissue predicted not to infarct, the risk of infarction for all animals was significantly greater in FN compared with TN (Group 1, P < 0.01; Group 2, P =0.02; Group 3, P < 0.01) (Figure 3). Furthermore, average predicted risk of infarction in the PLV in animals that reperfused (n = 4) (0.73 ± 0.03) was significantly less (P < 0.01) than in animals showing no reperfusion (n = 17) (0.81±0.05).
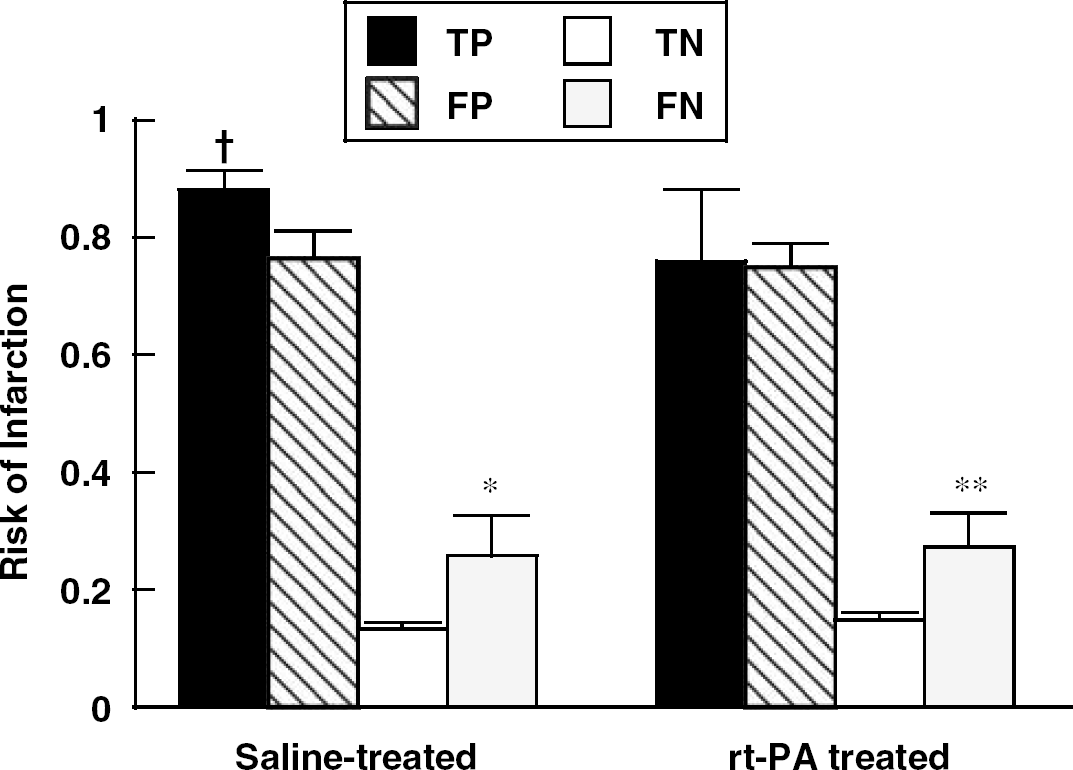
Predicted risk of infarction (mean ± s.d.) in TP FF, TN and FN regions for saline- and rt-PA-treated SHR. For saline-treated rats, the mean predicted infarction risk was significantly higher in TP than in FP while no difference was found for rt-PA-treated rats. For both groups, FN was significantly higher than TN. †P = 0.02 TP versus FP *P = 0.02, **P < 0.01 TN versus FN.
Discussion
This experimental stroke study shows that multiparametric MRI-based algorithms that have recently been applied for estimating tissue outcome on a voxel-wise basis in stroke patients can predict histologic infarction with high accuracy. In fact, the accuracy of the models in the experimental setting is much higher than that reported for humans using similar statistical analysis (Wu et al, 2001), but comparable to those reported for animal models using alternate statistical methods (Shen et al, 2005). This is likely because of reduced variation in the experimental setting in terms of occlusion location and duration, as well as follow-up times as compared with human stroke studies. This suggests that infarction prediction in human acute stroke may be improved if these parameters are taken into consideration in predictive algorithms. Moreover, even with these parameters factored in, it is likely that there is larger variation in human clinical stroke population than is being properly captured in existing experimental stroke models, as has often been observed empirically (Traystman, 2003). In predicting tissue outcome, in addition to algorithmic design, it is therefore important to recognize that another variable affecting predictive performance is physiologic variation, as reinforced by our findings of reduced model accuracy in rats that reperfused compared with those that did not.
The derived GLM models produced results that corresponded significantly with histology, with prediction accuracy in the saline-treated SHR arm, Group 2, being comparable to that of the SDR training arm, Group 1. This is despite differences in extent of ischemic injury due to interstrain variation, model variability and/or imaging time from occlusion. Algorithms were not trained and tested on the SHR animals using jack-knifed models, owing to the very few control animals in the SHR cohort, which would likely lead to poorer prediction on that arm compared with the rt-PA-treated arm. Nonetheless, the accurate performance of our models in the saline-treated groups shows that statistical algorithms trained on data from one strain of animals can be used to assess infarction risk in another strain if the same imaging techniques are used, supporting the hypothesis that thresholds of tissue viability, for example, depth of CBF and ADC reductions, are translatable under standardized conditions. We posit that the high accuracy, despite differences in strain and experimental conditions, are because these algorithms are identifying relatively gross differences between ischemic and normal tissue. Similar to when empirically observing DWI and PWI lesion mismatches in acute stroke, one often predicts infarction growth in cases of permanent ischemia, regardless of occlusion duration and animal strain. The rate of lesion growth and response to rt-PA will likely vary as a function of these parameters (Traystman, 2003; Bardutzky et al, 2005), but, since our study concentrated on final infarction, our results are not severely affected by these potentially confounding factors. Clearly, the retrospective nature of this study limited some aspects of model development. However, development of predictive models in human studies would be similarly constrained, owing to differences in patient demographics such as onset times, age and gender. Studies are under way on incorporating nonimaging parameters into MRI-based predictive algorithms to improve their predictive performance (Wu et al, 2005, 2006).
In this study, all three cohorts used the same imaging protocols and magnetic resonance system, eliminating a potential confounding factor in predicting infarction in different experimental groups. Although the analysis was limited to quantitative parameters, it is likely that the coefficients calculated from Group 1 may not be suitable for predicting infarction in animals studied using other scanning protocols with different acquisition schemes (spin-echo versus gradient-echo), in-plane resolution, TR, TE, etc. Future studies using data acquired with the same imaging protocols but on different scanners should be performed to properly examine the sensitivity of these models to data acquisition. This is an important issue, which needs to be resolved as an initial step for investigating the feasibility of combining data from multiple centers, which would likely be the scenario in acute human stroke trials that use these algorithms.
Our study also shows that voxel-based statistical algorithms can be used to objectively evaluate the effects of therapeutic intervention that may not be readily detected with volumetric approaches (i.e. comparison of final infarct volumes). In the animals receiving rt-PA treatment (Group 3), infarct prediction was less accurate than in saline-treated animals (Group 1 and Group 2). From this reduced accuracy, one can infer that the natural evolution of the infarct was modified by thrombolytic treatment. Although early recanalization has been associated with reduced lesion volumes (Jansen et al, 1999), this is not always necessarily the case, since persistent microvascular sludging (del Zoppo, 1994; Meng et al, 2004) or fractionally lysed clots occluding distal arteries (Dijkhuizen et al, 2001) may lead to persistent perfusion deficits. Our results are consistent with findings in humans where only carefully selected subsets of patients may benefit from thrombolytic therapy administered later than 3 h (Hacke et al, 2004). However, this is at the increased risk of hemorrhagic transformation (NINDS rt-PA Stroke Study Group, 1995, 1997; Knight et al, 1998; Clark et al, 1999), as has been reported for the Group 2 and Group 3 animals used in this study (Dijkhuizen et al, 2001).
There have been previous attempts to acutely predict which animals were most likely to respond favorably to thrombolytic therapy using MRI, but these studies were either on a volumetric basis (Jiang et al, 2000; Pillekamp et al, 2001) or utilized discrete tissue signatures (Jiang et al, 1998; Ding et al, 2004). Voxel-based approaches, such as presented here and by others (Shen et al, 2005), however, provide insight into the spatial heterogeneity of infarction risk that may not be evident in volumetric-based approaches. In addition, statistical algorithms that output a continuous variable allow for the estimation of risk of individual tissue voxels that can be monitored quantitatively by a single variable as the stroke lesion evolves. Hypothetically, this may provide a means to assess recruitment of voxels from the ‘ischemic penumbra’ to the ‘infarcted core’, by measuring the conversion of tissue at moderate risk to higher risk of infarction over time. Moreover, one advantage of using parametric techniques, such as the GLM, over nonparametric methods is that the coefficients used to generate the model may provide insight into stroke pathophysiology. For example, the No-Reperfusion model coefficients did not differ significantly from the ALL model using all eight rats. However, for the Reperfusion model, we find that perfusion abnormalities become more heavily weighted, suggesting that tissue with greater perfusion deficits is more likely to infarct even after reperfusion. However, because of the limited number of spontaneous reperfusers (n = 2), any conclusions drawn must be done with caution. We speculate that similar comparisons of GLM coefficients derived from training groups that differ in physiological aspects, such as age or gender, may provide insight into differences in ischemic evolution as a function of these parameters.
Another benefit of using statistical algorithms is that the distribution of GLM predicted infarction risk values may also provide insight into levels of salvageability. Detailed examination of risk values in different brain regions of saline-treated rats found that, in tissue predicted to infarct (> 50% risk), GLM values were significantly greater in tissue that truly infarcted than in tissue that was falsely classified as likely to infarct. This might imply that tissue with lower GLM infarction risk values are merely oligemic or injured, but not irreversibly damaged. In contrast, for the rt-PA-treated animals, there were no significant baseline differences in GLM values between TPs and FPs in individual rats. This suggests that thrombolytic therapy saved tissue that was at high risk of infarction. Furthermore, the level of pretreatment GLM predicted risk of infarction may provide insight into which animals are more likely to reperfuse or may be more responsive to intervention. The spontaneous reperfusion rate seen in our study among all the saline-treated animals (14%) is consistent with that observed in humans (17% within 6 to 8h) (Kassem-Moussa and Graffagnino, 2002). Spontaneous reperfusion has been observed by others in experimental rat embolic stroke models (Overgaard et al, 1994; Zhang et al, 1997). Reperfusion rates in our rt-PA-treated group (29%) were higher than in the saline-treated group. In animals that reperfused, either spontaneously or in response to treatment, significantly lower baseline GLM infarction risk values were found in the predicted lesion. This suggests that animals with moderate initial ischemic injury, reflected by the lower GLM predicted infarction risk values, may have a higher chance of reperfusion. This reduction of tissue injury may also be possibly monitored in the individual input parameters. However, as has been shown by several studies (Wu et al, 2001; Shen et al, 2005), multiple imaging parameters are likely necessary to properly characterize salvageable tissue. Tissue signature algorithms, whether producing discrete tissue states (Welch et al, 1995; Jiang et al, 1997; Carano et al, 2000; Jacobs et al, 2000; Soltanian-Zadeh et al, 2003; Shen et al, 2004) or probability of infarction values (Wu et al, 2001; Gottrup et al, 2005; Shen et al, 2005), synthesize these complex data sets into a tractable synopsis of tissue injury. This means the potential success of thrombolytic treatment may be able to be more rapidly assessed on an individual basis before treatment using these tools. Future prospective studies are required to confirm whether GLM predicted infarction risk values can be used prog-nostically for identifying individuals most likely to respond to even late thrombolysis by successfully recanalizing.
Conclusions
In conclusion, this study has shown the potential of identifying tissue at risk of infarction in rat embolic stroke models using MRI-based statistical algorithms that can be straightforwardly translated to clinical settings. With a baseline estimate of tissue likely to infarct, the efficacy of novel interventions can be evaluated by comparing post-treatment infarct volumes with pretreatment predictions. Furthermore, the predicted infarction risk may reflect degrees of ischemic injury, providing a means to identify tissue, and ultimately subjects, which may maximally benefit from novel therapeutic interventions.