
Abstract
[Carbonyl-11C]WAY-100635 has been used extensively in positron emission tomography (PET) imaging of serotonin 1A receptors (5-HT1A) in vivo in the human brain. Specific binding to receptors is usually estimated using compartmental modeling with arterial plasma input function. The use of reference tissue input (cerebellum) enables quantification without the need of arterial blood sampling, but the accuracy of this method is highly dependent on the validity of the reference region in terms of both specific and nonspecific binding. In this paper, we report exceptionally high uptake of [carbonyl-11C]WAY-100635 in the gray matter of cerebellum in one healthy male subject, which was reproducible in repeated PET scanning and most likely represents specific binding to 5-HT1A receptors in cerebellar gray matter. Serotonin 1A receptors are transiently expressed in the human cerebellum during early childhood and usually level off until adolescence but may persist in some individuals. As a methodological implication, the results of this study with regard to test–retest characteristics of [carbonyl-11C]WAY-100635 measurements in healthy volunteers using both arterial plasma and reference tissue input functions support the use of cerebellar white matter as reference region, to avoid the potential bias originating from binding of [carbonyl-11C]WAY-100635 to 5-HT1A receptors in cerebellar gray matter.
Introduction
The neurotransmitter serotonin (5-HT) and its actions via the 1A receptor subtype (5-HT1A) are implicated in the pathophysiology of various neuropsychiatric disorders such as major depression (Albert and Lemonde, 2004) and schizophrenia (Bantick et al, 2000). These receptors are somatodendritic presynaptic autoreceptors in the raphe nuclei, and postsynaptic receptors in hippocampus, insular cortex and neocortex (Albert and Lemonde, 2004). WAY-100635 is the first 5-HT1A receptor silent antagonist to show high-affinity (in vitro KD 0.1 to 0.4 nmol/l) and selectivity (Forster et al, 1995; Khawaja et al, 1995). Labeling of this antagonist with carbon-11 isotope at the carbonyl position yields [carbonyl-11C]-WAY-100635, which shows feasible properties for positron emission tomography (PET) imaging of 5-HT1A receptor binding in the living human brain (Farde et al, 1998; Pike et al, 1996). Accordingly, [carbonyl-11C]WAY-100635 has been used in clinical settings to show 5-HT1A receptor binding alterations in major depression (Bhagwagar et al, 2004; Drevets et al, 1999; Meltzer et al, 2004; Parsey et al, 2006), schizophrenia (Tauscher et al, 2002; Yasuno et al, 2004), panic disorder (Neumeister et al, 2004), eating disorders (Bailer et al, 2005; Tiihonen et al, 2004), chronic fatigue syndrome (Cleare et al, 2005), Parkinson's disease (Doder et al, 2003), epilepsy (Meschaks et al, 2005; Savic et al, 2004), amyotrophic lateral sclerosis (Turner et al, 2005) and type 2 diabetes (Price et al, 2002).
[Carbonyl-11C]WAY-100635 binding has been successfully subjected to compartmental kinetic modeling to yield estimates of specific binding to 5-HT1A receptors (Farde et al, 1998; Gunn et al, 1998; Parsey et al, 2000). These models often use the metabolite-corrected arterial plasma activity curve as input function. Methods based on reference tissue input are devoid of arterial blood sampling and, therefore, preferable in clinical settings. Ideally, the reference tissue should be devoid on specific binding and should be described with a single-tissue compartmental model. However, as with many other radioligands such as [11C]raclopride (Farde et al, 1989), [carbonyl-11C]WAY-100635 binding in the cerebellum is better described with a two-tissue compartmental model, an effect attributable to the existence of specific binding, buildup of radioactive metabolites, kinetically distinguishable nonspecific binding or tissue heterogeneity. Recently, Parsey et al (2005) demonstrated the presence of 5-HT1A receptors in the cerebellum, especially in the vermis, and found that the use of total cerebellum input introduced bias to reference tissue compartmental models. Instead, the authors concluded that cerebellar white matter could be used as a valid reference tissue since this structure is practically devoid of 5-HT1A receptors. This issue is of interest, since 5-HT1A receptors are present in the cerebella of fetal and infant human brain, but apparently level off during the course of early brain maturation until early childhood (Slater et al, 1998). In addition, it has been suggested that this regression of cerebellar 5-HT1A is disturbed in patients with schizophrenia (Slater et al, 1998). In this paper, we describe an individual with exceptionally high accumulation of [carbonyl-11C]WAY-100635 in cerebellar gray matter as assessed twice using PET. We also examine the validity of using different cerebellar regions for reference tissue input for compartmental modeling of [carbonyl-11C]WAY-100635 kinetics in a test–retest setting in healthy volunteers. Estimates for specific binding were derived using both arterial plasma and reference tissue as the input function.
Materials and methods
This study was approved by the Joint Ethical Committee of the University of Turku and Turku University Central Hospital, and was conducted according to the Declaration of Helsinki. All subjects gave ethical committee-approved written informed consents.
Subjects
Five healthy male subjects free of any psychiatric or somatic illness participated in the study. All but one were right-handed and all were nonsmokers. The age, height and weight of the subjects were 24.6 ± 5.2 years, 182 ± 4 cm and 79.6 ± 8.2kg, respectively (means ± s.d.). All subjects underwent 1.5 T magnetic resonance (MR) imaging of the brain for anatomical reference for image analysis and to exclude morphological brain abnormalities.
Preparation of [Carbonyl-11C]WAY-100635
WAY-100634 dioxalate (1-(2-methoxyphenyl)-4-(2-(2-pyridylamino)ethyl)piperazine dioxalate and WAY 100635 (N-(2-(4-(2-methoxyphenyl)-1-piperazinyl)ethyl)-N(2-pyridyl)cyclohexanecarboxamide) were kindly supplied by University Centre for Pharmacy, Department of Medicinal Chemistry, University of Groningen, Groningen, The Netherlands.
[11C]Carbon dioxide was produced at the Accelerator Laboratory of Abo Akademi with a 103 cm isochronous Efremov cyclotron using the 14N(p,α) 11C reaction. [carbonyl-11C]WAY 100635 was prepared from [11C]cyclohexylcarbonyl chloride and WAY 100634 essentially according to a published procedure (Hall et al, 1997). The volume of the final product solution was calculated by weighing the sterile product vessel before and after sterile filtration and division with the density of the sterile solvent. The radiochemical purity and the specific radioactivity of the radioligand was analyzed by reversed-phase HPLC using a PC controlled Merck Hitachi system. Acetonitrile and 0.05 mol/l phosphoric acid (35/65) was used as the mobile phase with a flow rate of 2 ml/min. Ultraviolet (UV)-absorbance was measured at 270 nm. Samples of [carbonyl-11C]WAY 100635 were analyzed in triplicate, and concentrations were determined from calibration curves made by injection of three known concentrations of WAY 100635 on the same day as the [carbonyl-11C]WAY 100635 synthesis. The measured concentration was used together with the measured radioactivity and volume and the molecular weight of WAY 100635 in the calculation of the specific radioactivity of the product at end of synthesis.
Image Acquisition
PET experiments were performed using a whole-body 3D PET scanner (GE Advance; GE, Milwaukee, WI, USA) with 35 slices of 4.25-mm thickness covering the whole brain, running in 3D mode. The basic performance characteristics tests of this camera indicate transaxial and axial spatial resolution of 4.3 and 4.3 mm, at full-width of halfmaximum (FWHM). Scatter correction was performed based on deconvolution methods (Bergstrom et al, 1983) and attenuation information. Before each emission scan, a transmission scan was performed using 68Ge rod sources. An intravenous bolus of [carbonyl-11C]WAY-100635 was administered in the right antecubital vein and flushed with saline. The uptake of [carbonyl-11C]WAY-100635 was measured for 57 mins using 14 time frames: three 1-mins frames followed by four 3-mins frames and seven 6-mins frames. All subjects were scanned twice during the same day between 1000 and 1830 with at least 2 h between injections. The injected dose, specific radioactivity, and mass of injected radioligand were 347.3 ± 44.5MBq, 64.0 ± 16.8 MBq/nmol and 2.43 ± 0.73 μg for the test scan, and 314.1 ± 33.8 MBq, 107.1± 15.6 MBq/nmol and 1.25 ± 0.11 μg for the retest scan (means ± s.d.). Specific radioactivity tended to be higher, and accordingly, the mass of injected radioligand tended to be lower in the retest scan (P =0.02 and 0.03, respectively). However, the mass of radioligand was still within the limits of a tracer dose (range 1.08 to 3.26 μg) and on average lower than in previous reports on [carbonyl-11C]WAY-100635 studies in humans (Farde et al, 1998; Gunn et al, 1998; Parsey et al, 2000).
To obtain arterial input function for modeling, the left radial artery was cannulated for taking arterial samples. An automated continuous blood sampling system was used for the first 3.5 mins, and manual samples (2 ml) were obtained thereafter at 4.5, 7.5, 11, 14, 18, 24, 30, 36, 42, 48 and 54 mins after radioligand injection. To measure the fraction of unchanged [carbonyl-11C]WAY-100635 in arterial plasma, arterial blood samples (2 ml) were collected at 2, 6, 12, 20 and 30 mins. The unchanged [carbonyl-11C]WAY 100635 in arterial plasma was measured as follows and plasma proteins were precipitated with acetonitrile containing WAY 100635 (approx 30 μg) essentially as described elsewhere (Osman et al, 1998). The liquid chromatograph consisted of a Merck L-7100 gradient pump system, a Rheodyne 7725i injector with a 1 ml loop, a Waters μ-Bondapak C18 column (7.8 × 300 mm2, 10 μm), a Merck L-7400 UV-detector operated at 235 nm followed by a Packard Radiomatic 150TR detector with a 0.6 ml PET-cell. The data were processed by a Merck D-7000 HPLC System Manager. The column was eluted with a mixture of acetonitrile in 0.05 mol/l phosphoric acid from 25% acetonitrile to 60% in 5.5 mins, isocratic 60% between 5.5 and 7.5 mins and back to 25% at 8.5 min, with end of run at 9 mins. All the acquired data were corrected for physical decay, and the results were calculated as the percentage of corrected radioactivity in a given peak in relation to the sum of the corrected radioactivity in all peaks. A Hill-type function was fitted to the unchanged fraction data. Subsequently, an arterial plasma input curve for [carbonyl-11C]WAY 100635 corrected for metabolites was constructed. Clearance was calculated as the ratio of injected dose and area under the metabolite-corrected plasma radioactivity curve from zero to infinity and expressed as L/h.
Quantification of [Carbonyl-11C]WAY-100635 Binding
Dynamic PET images were realigned within-subject using the normalized mutual information method as implemented in SPM2 (Friston et al, 1995) and realignment parameters estimated from summed PET images. For the calculation of regional time–activity curves, regions of interest (ROI) were drawn on the MR images coregistered according to the mean image of PET-PET coregistered summed PET images using the normalized mutual information method as implemented in SPM2. Regions of interes were drawn using Imadeus software (version 1.2, Forima Inc., Turku, Finland). The same set of ROIs was then applied to PET-PET coregistered test and retest images. Regions of interest were delineated manually on anterior cingulate (AC), dorsal raphe nuclei (DRN), dorsolateral prefrontal cortex (DLPFC), inferior parietal lobule (LPI), lateral temporal cortex (LTC), medial prefrontal cortex (MPFC), medial temporal cortex (MTC, including amygdala, hippocampus and parahippocampal gyrus), and posterior cingulate (PC). The ROI for DRN was drawn directly on the PET images, since this structure is not readily visible in MR images. To obtain reference tissue input function, several ROIs were drawn onto the cerebellum: cerebellar cortical gray matter (gmCER), cerebellar white matter (wCER), cerebellar vermis (vCER) and total cerebellum (totCER). The placement of cerebellar ROIs is given in Figure 1. All ROIs were drawn on three to four planes. No correction for partial volume effects or segmentation of white and gray matter was applied. Before modeling, contributions of total blood radioactivity to regional tissue time–activity curves was eliminated by assuming 5% blood volume in ROI and subtracting it directly from regional radioactivity.
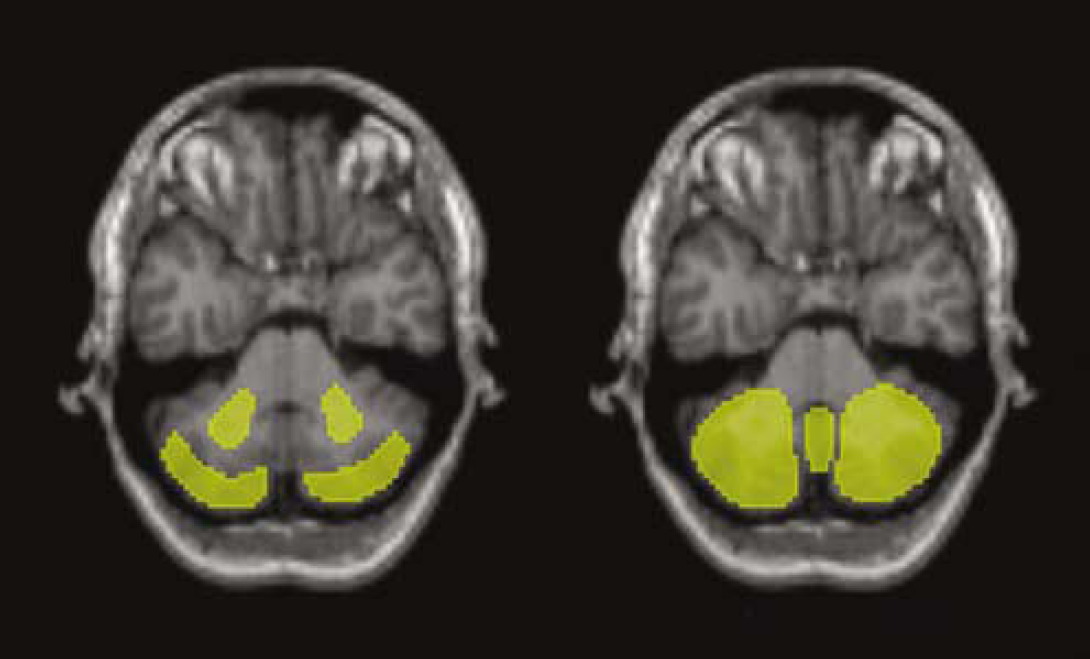
Placement of cerebellar ROIs demonstrated on axial slices of an MR image. On the left-hand side, ROIs for cerebellar white matter (smaller ROIs) and cerebellar cortical gray matter (larges ROIs) are shown. On the right-hand side, ROIs for total cerebellum (larger ROIs) and cerebellar vermis (in the middle) are shown.
A linearized method based on non-negative least-squares optimization was used to calculate regional total distribution volumes (VT), according to the standard two-tissue compartmental model (2TM):
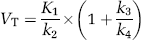
where K1 to k4 represent the rate constants for radiotracer transit between plasma, free and nonspecific radiotracer in tissue, and specifically bound radiotracer (Slifstein and Laruelle, 2001). According to the one-tissue compartmental model (i.e., k3= k4 = 0) (1TM):

VT values were estimated directly without division (Zhou et al, 2004). Akaike information criteria (AIC) were used to evaluate and compare goodness of fit between 1TM and 2TM. Specifically, we wanted to test whether cerebellar tissue activity would be better described by one or two tissue compartment models.
Binding potential (BP) values were estimated using three methods. First, BP was calculated indirectly from regional VT values by
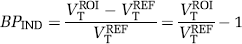
where VROIT and VREFT represent total tissue distribution volumes in region of interest and reference regions, respectively. Second, BP was estimated using the simplified reference tissue model (SRTM) (Lammertsma and Hume, 1996). This model assumes that free plus nonspecific and specific binding in tissue equilibrate rapidly enough to allow for treating them as a single compartment, and BP is obtained after the assumption of the equivalence of the 1TM and 2TM VT configurations for the ROI. These BP estimates were denoted BPSRTM. Third, BP was estimated using the ratio method:
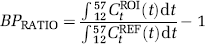
Here, CtROI is the radioactivity concentration in the region of interest and CtREF is that in the reference region. The time interval of 12 to 57 mins was selected based on a previous optimization study with [carbonyl-11C]WAY-100635 (Ito et al, 1999). For all BP analyses, wCER and totCER were used as reference regions, and comparisons between these were made.
At tracer doses, the BP as defined in this paper relates to pharmacological receptor binding parameters by
where Bmax is the total receptor concentration in tissue, kD the apparent affinity, and f2 the fraction of free radiotracer in the nondisplaceable tissue compartment (Slifstein and Laruelle, 2001).
Statistical Analyses
Statistical analyses were performed using SPSS for Windows (Release 12.0.1, SPSS Inc., 1989 to 2003). Test-retest variability (reproducibility) was assessed as follows:
Here scan1 and scan2 refer to parameter estimates of interest (e.g., BP) in test and retest scans, respectively. Test–retest reliability was evaluated in terms of intraclass correlation coefficients (ICC):
Here BSMS is the between-subject mean square, WSMS is the within-subject mean square, and n is the number of repeated observations (in this case, n = 2). Intraclass correlation coefficients can have values between −1 and 1; values close to 1 indicate that most variance is due to between-subject rather than within-subject variation (good reliability), whereas values below zero imply greater within-subject than between-subject variation (poor reliability). Differences in parameters of interest between test and retest scans were tested with paired samples t-test, and a P-value of 0.05 was considered a threshold criterion of statistical significance. Values represent mean ± standard deviation (s.d.) unless otherwise stated.
Results
Brain Uptake of [Carbonyl-11C]WAY-100635
The brain uptake of [carbonyl-11C]WAY-100635 was rapid and consistent with the known distribution of 5-HT1A receptors in the human brain. The accumulation of radioactivity was highest in neocortical and medial temporal regions and lowest in the basal ganglia and cerebellum, except for one individual who displayed high accumulation in the cerebellum (from here on denoted ‘Case 2’). Figure 2 illustrates the spatial distribution of [carbonyl-11C]WAY-100635 in one of the subjects as well as Case 2.
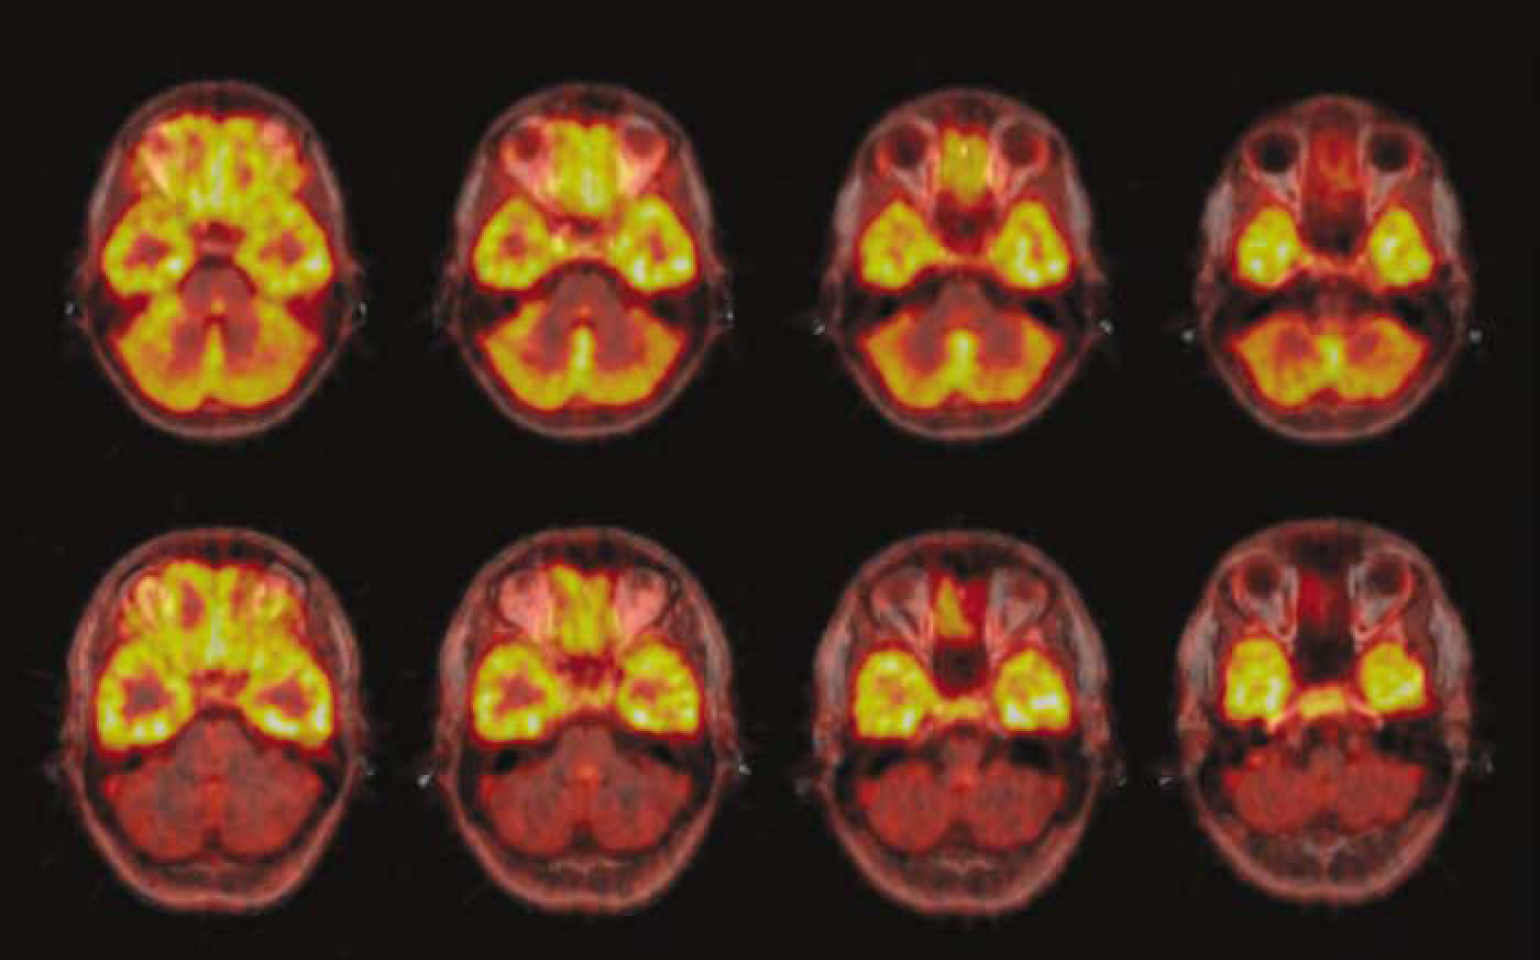
A visualization of [carbonyl-11C]WAY-100635 uptake in axial slices at the level of the cerebellum. Summated PET images are laid on co-registered MR images. Note the conspicuous cerebellar uptake in Case 2 (upper row), that is not evident in another individual from this sample (lower row).
VT values for different brain regions are given in Table 1. These measurements demonstrated good reproducibility and reliability as indicated by low VAR values and high ICC values. There were no statistically significant differences in VT values between test and retest scans in any region studied. VT values for Case 2 are presented in Table 2.
Regional [carbonyl-11C]WAY-100635 VT values and their test–retest reproducibility from two-tissue compartmental modeling (2TM) (n = 5)
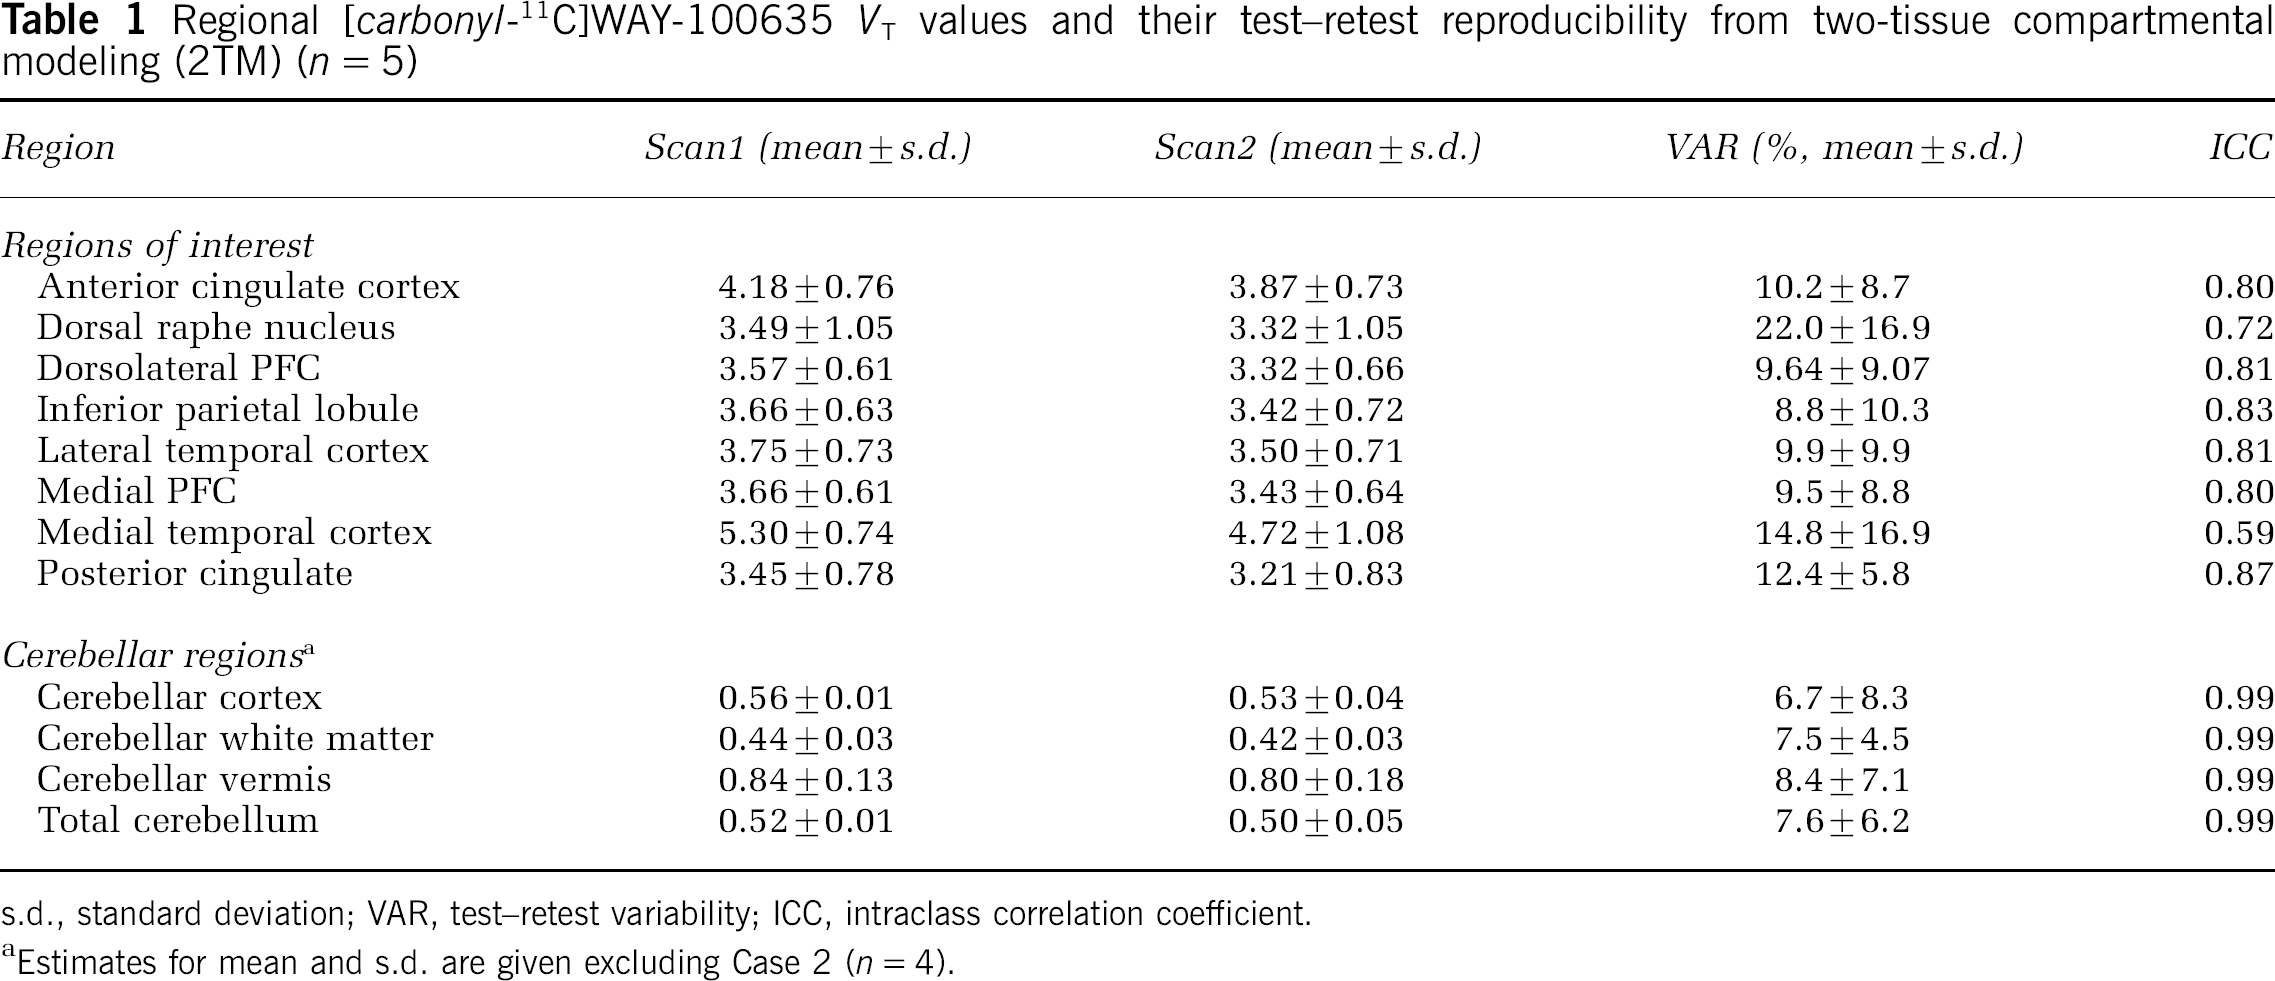
s.d., standard deviation; VAR, test–retest variability; ICC, intraclass correlation coefficient.
Estimates for mean and s.d. are given excluding Case 2 (n = 4).
Plasma Analysis of [Carbonyl-11C]WAY-100635
[Carbonyl-11C]WAY-100635 was rapidly metabolized: on average, only around 6% of the total radioactivity originated from unchanged [carbonyl-11C]WAY-100635 at 12 mins. The groupwise mean fraction of unchanged [carbonyl-11C]WAY-100635 as well as values from the case with prominent cerebellar uptake (see below) are plotted in Figure 3. There were no significant differences in the fractions between test and retest scans. Fraction of unchanged [carbonyl-11C]WAY-100635 demonstrated good reproducibility and moderate to large between-subject differences at 2 mins (VAR 3.9 ± 2.2%, ICC 0.49) and 30 mins (VAR 8.9 ± 3.5%, ICC 0.75) but not at intermediate time points (mean VAR 20.5 to 25.8%, ICC −0.51 to 0.35).
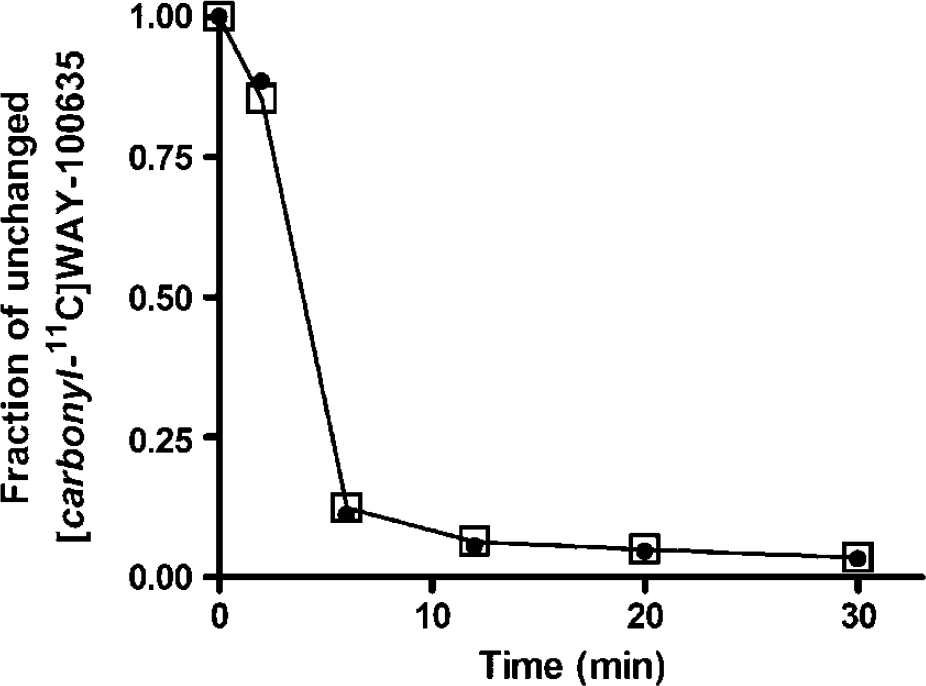
Fraction of unchanged [carbonyl-11C]WAY-100635 in arterial plasma in Case 2 (filled circles) and the mean fraction in other study subjects (n = 4, open squares). The mean value of fractions in test and retest scans are presented since these values did not appreciably change between scans.
Clearance of unchanged [carbonyl-11C]WAY-100635 was on average 111±14 L/h. Clearance showed moderate reproducibility (VAR 13.2± 8.3%) and weak reliability (ICC 0.31).
Cerebellar [Carbonyl-11C]WAY-100635 Binding
According to AIC values, the 2TM described the data better than did the 1TM in all cerebellar regions, and this difference was statistically significant (paired t-test, P < 0.05, data not shown). Thus, 2TM was selected for VT analysis in cerebellar regions.
VT values for cerebellar subregions are given in Table 1. These values showed excellent test–retest reproducibility. Case 2 had conspicuously higher values in all subregions compared with others, but less so in the wCER than in other regions. Values for this individual are given in Table 2, and time–activity curves for cerebellar regions are illustrated in Figure 4.
Regional [carbonyl-11C]WAY-100635 VT values for Case 2 from two-tissue compartmental modeling (2TM) (n = 5)
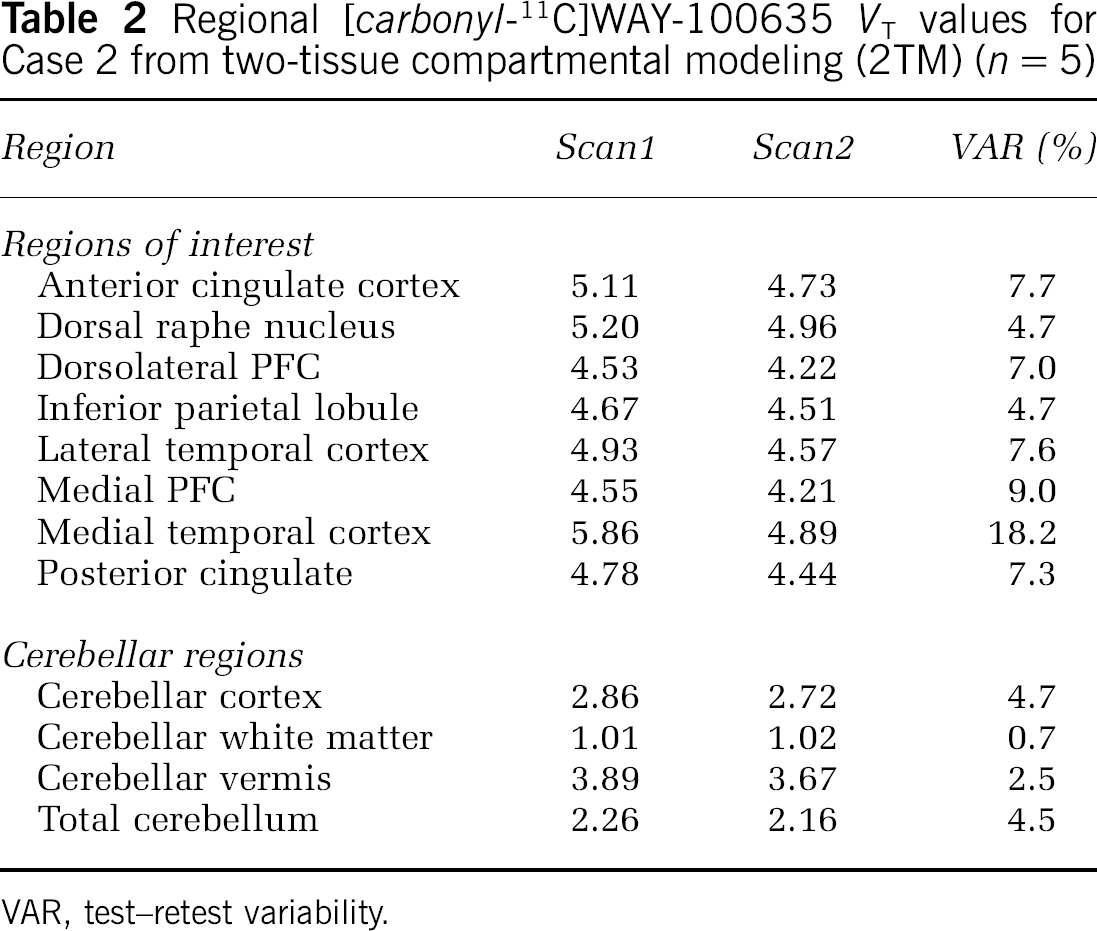
VAR, test–retest variability.
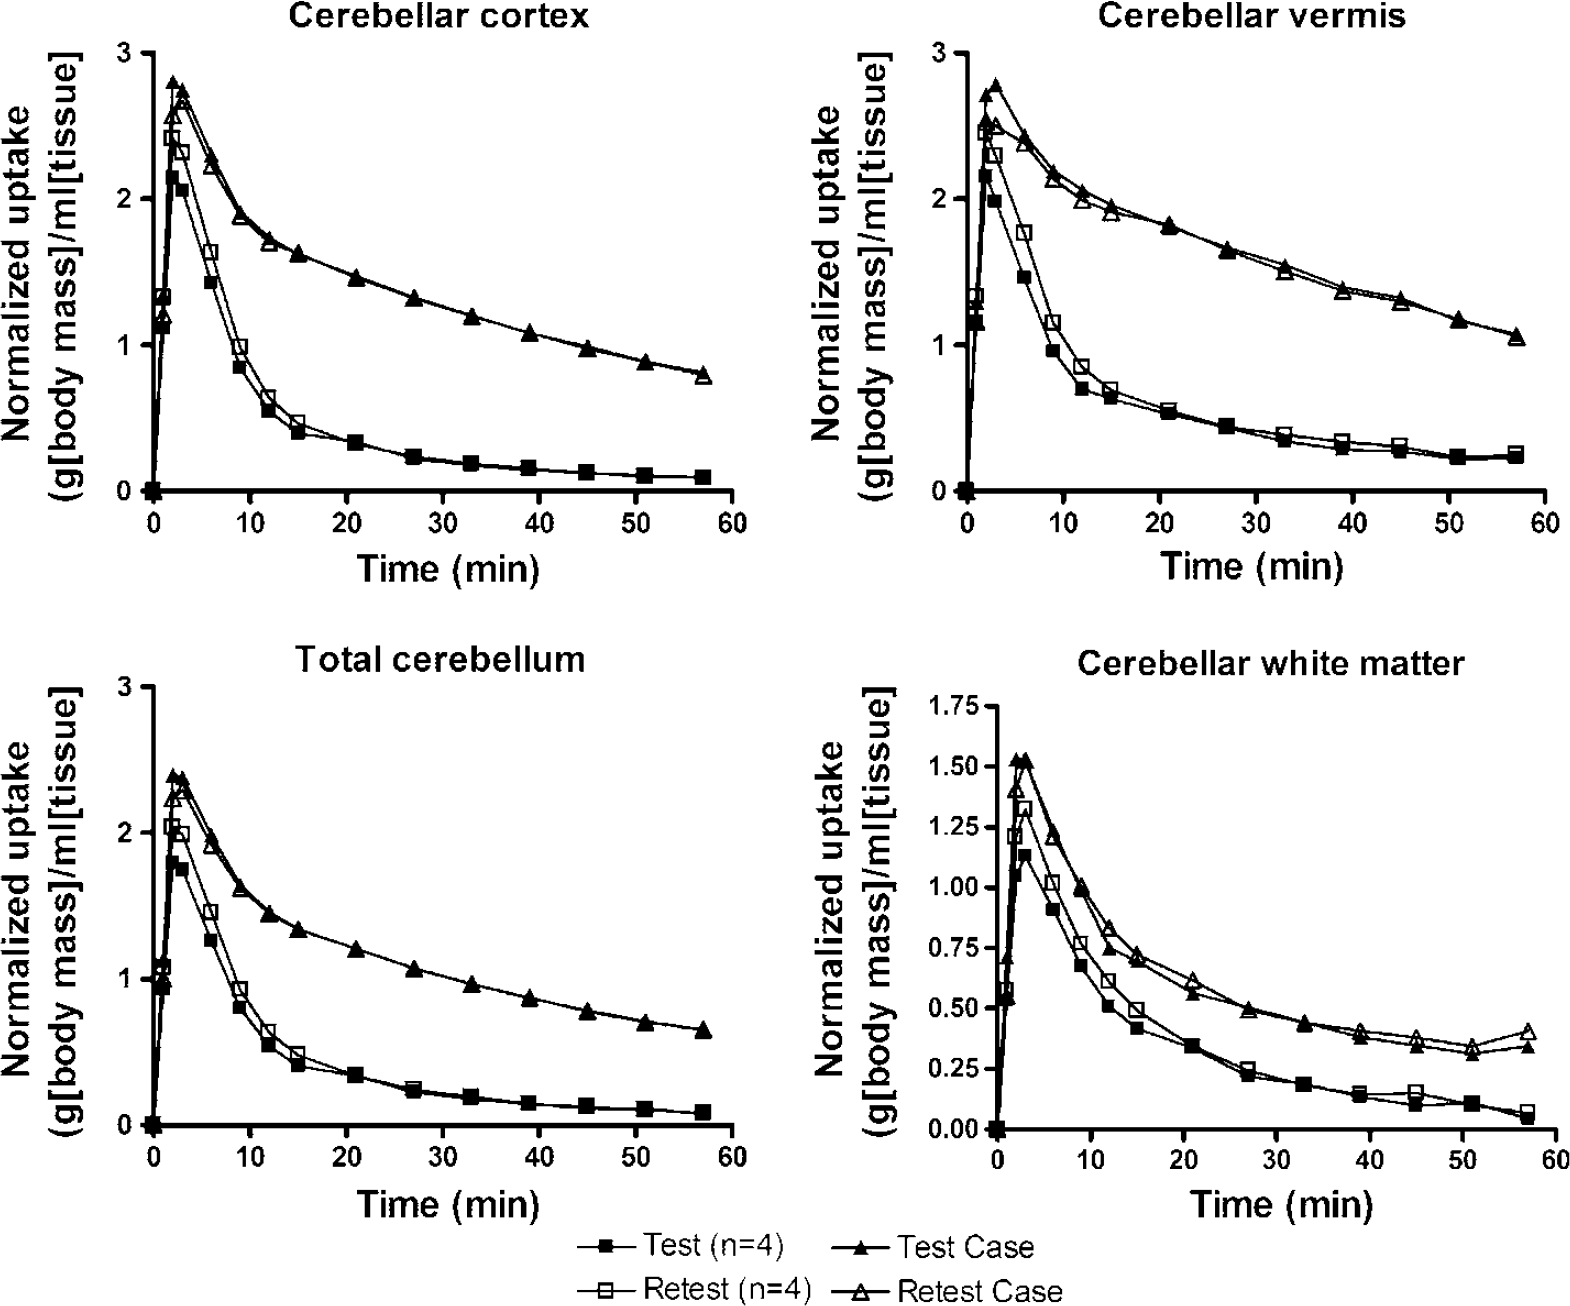
Radioactivity concentrations in cerebellar regions plotted against time. Values were corrected for injected dose and body mass, and are thus given in units of (kBq/ml tissue activity)/(MBq injected activity/kg body weight). Values for test (filled symbols) and retest (open symbols) scans are given separately, as well as values for Case 2 (triangles) and the mean value of other subjects (n = 4, squares).
Specific [Carbonyl-11C]WAY-100635 Binding Estimated Using Reference Tissue Input
BPIND, BPSRTM and BPRATIO values estimated using both wCER and totCER as reference region input are given in Tables 3–5. As expected, the use of totCER relative to wCER resulted in underestimation of all BP values. Test–retest reproducibility was comparable using either wCER or totCER for BPIND and BPRATIO but not for BPSRTM, in which within-subject variation was higher as reflected in higher VAR values. There were no statistically significant differences in any of the BP measurements between test and retest scans in any region studied.
Regional [carbonyl-11C]WAY-100635 BPIND values and their test–retest reproducibility using total cerebellum and cerebellar white matter as reference tissue input (n = 5)
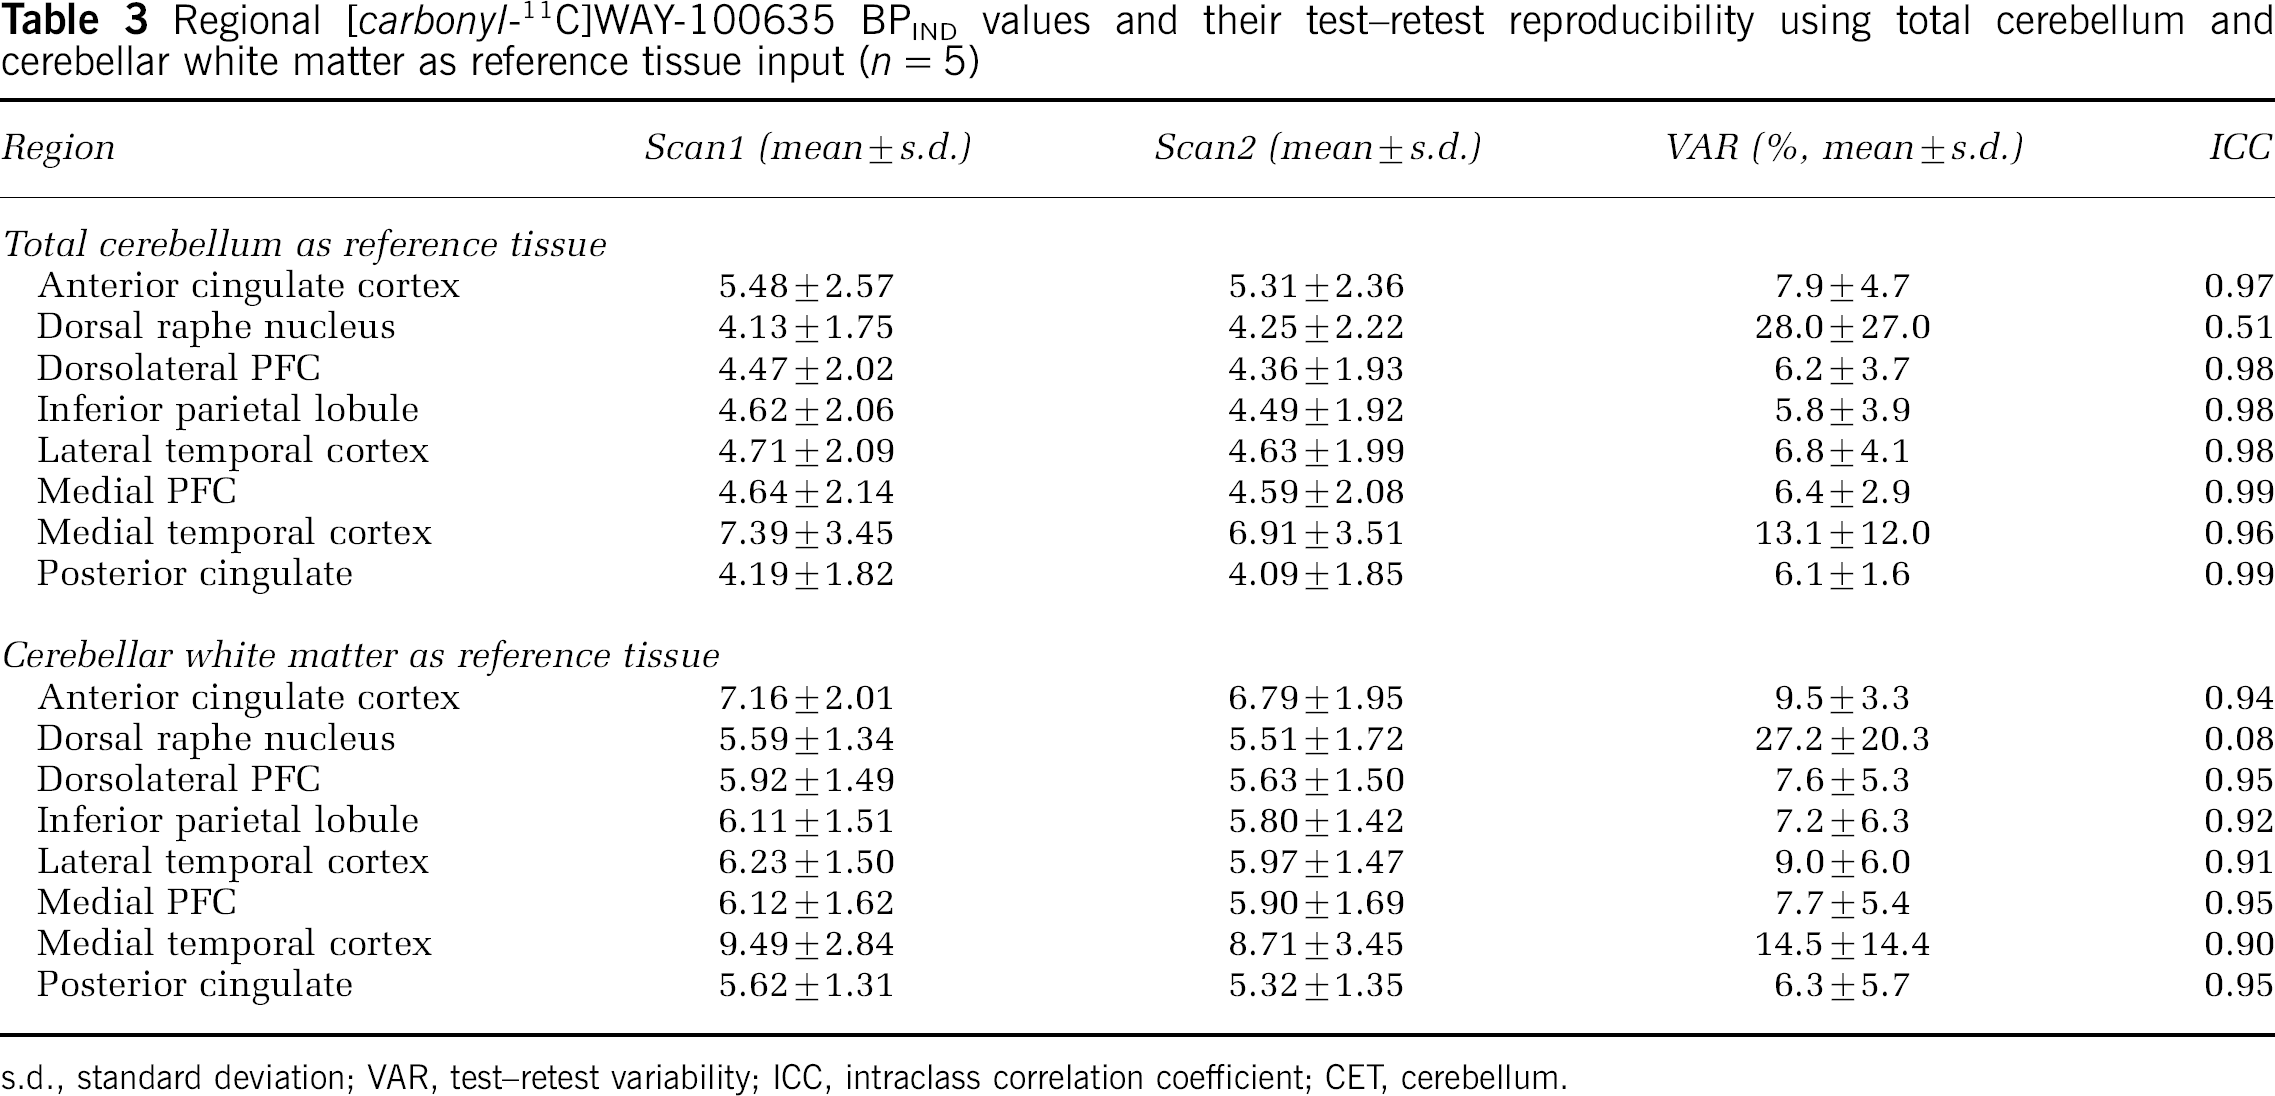
s.d., standard deviation; VAR, test–retest variability; ICC, intraclass correlation coefficient; CET, cerebellum.
Regional [carbonyl-11C]WAY-100635 BPSRTM values and their test–retest reproducibility using total cerebellum and cerebellar white matter as reference tissue input (n = 5)
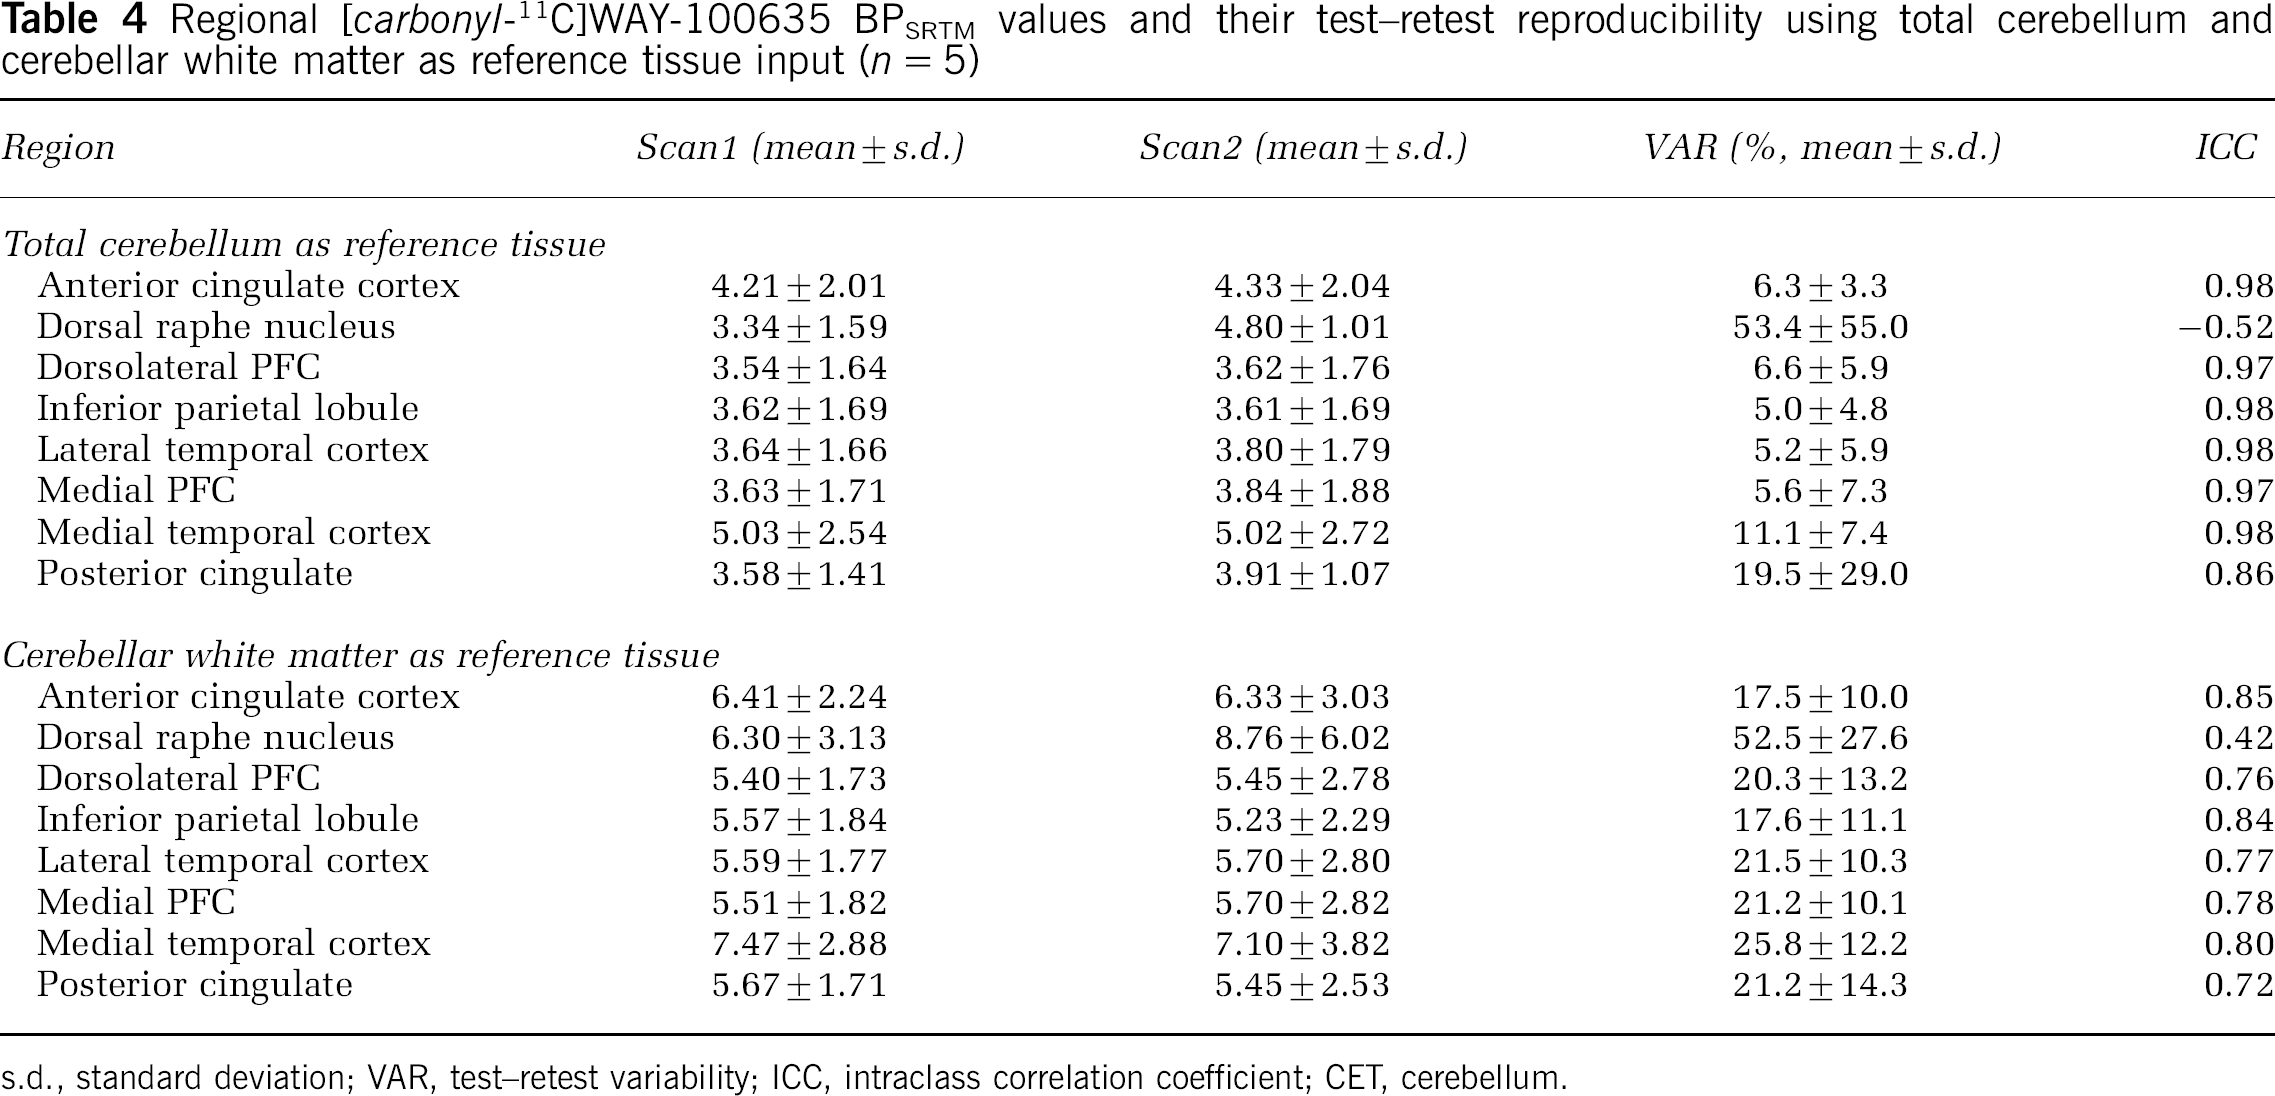
s.d., standard deviation; VAR, test–retest variability; ICC, intraclass correlation coefficient; CET, cerebellum.
Regional [carbonyl-11C]WAY-100635 BPRATIO values and their test–retest reproducibility using total cerebellum and cerebellar white matter as reference tissue input (n = 5)
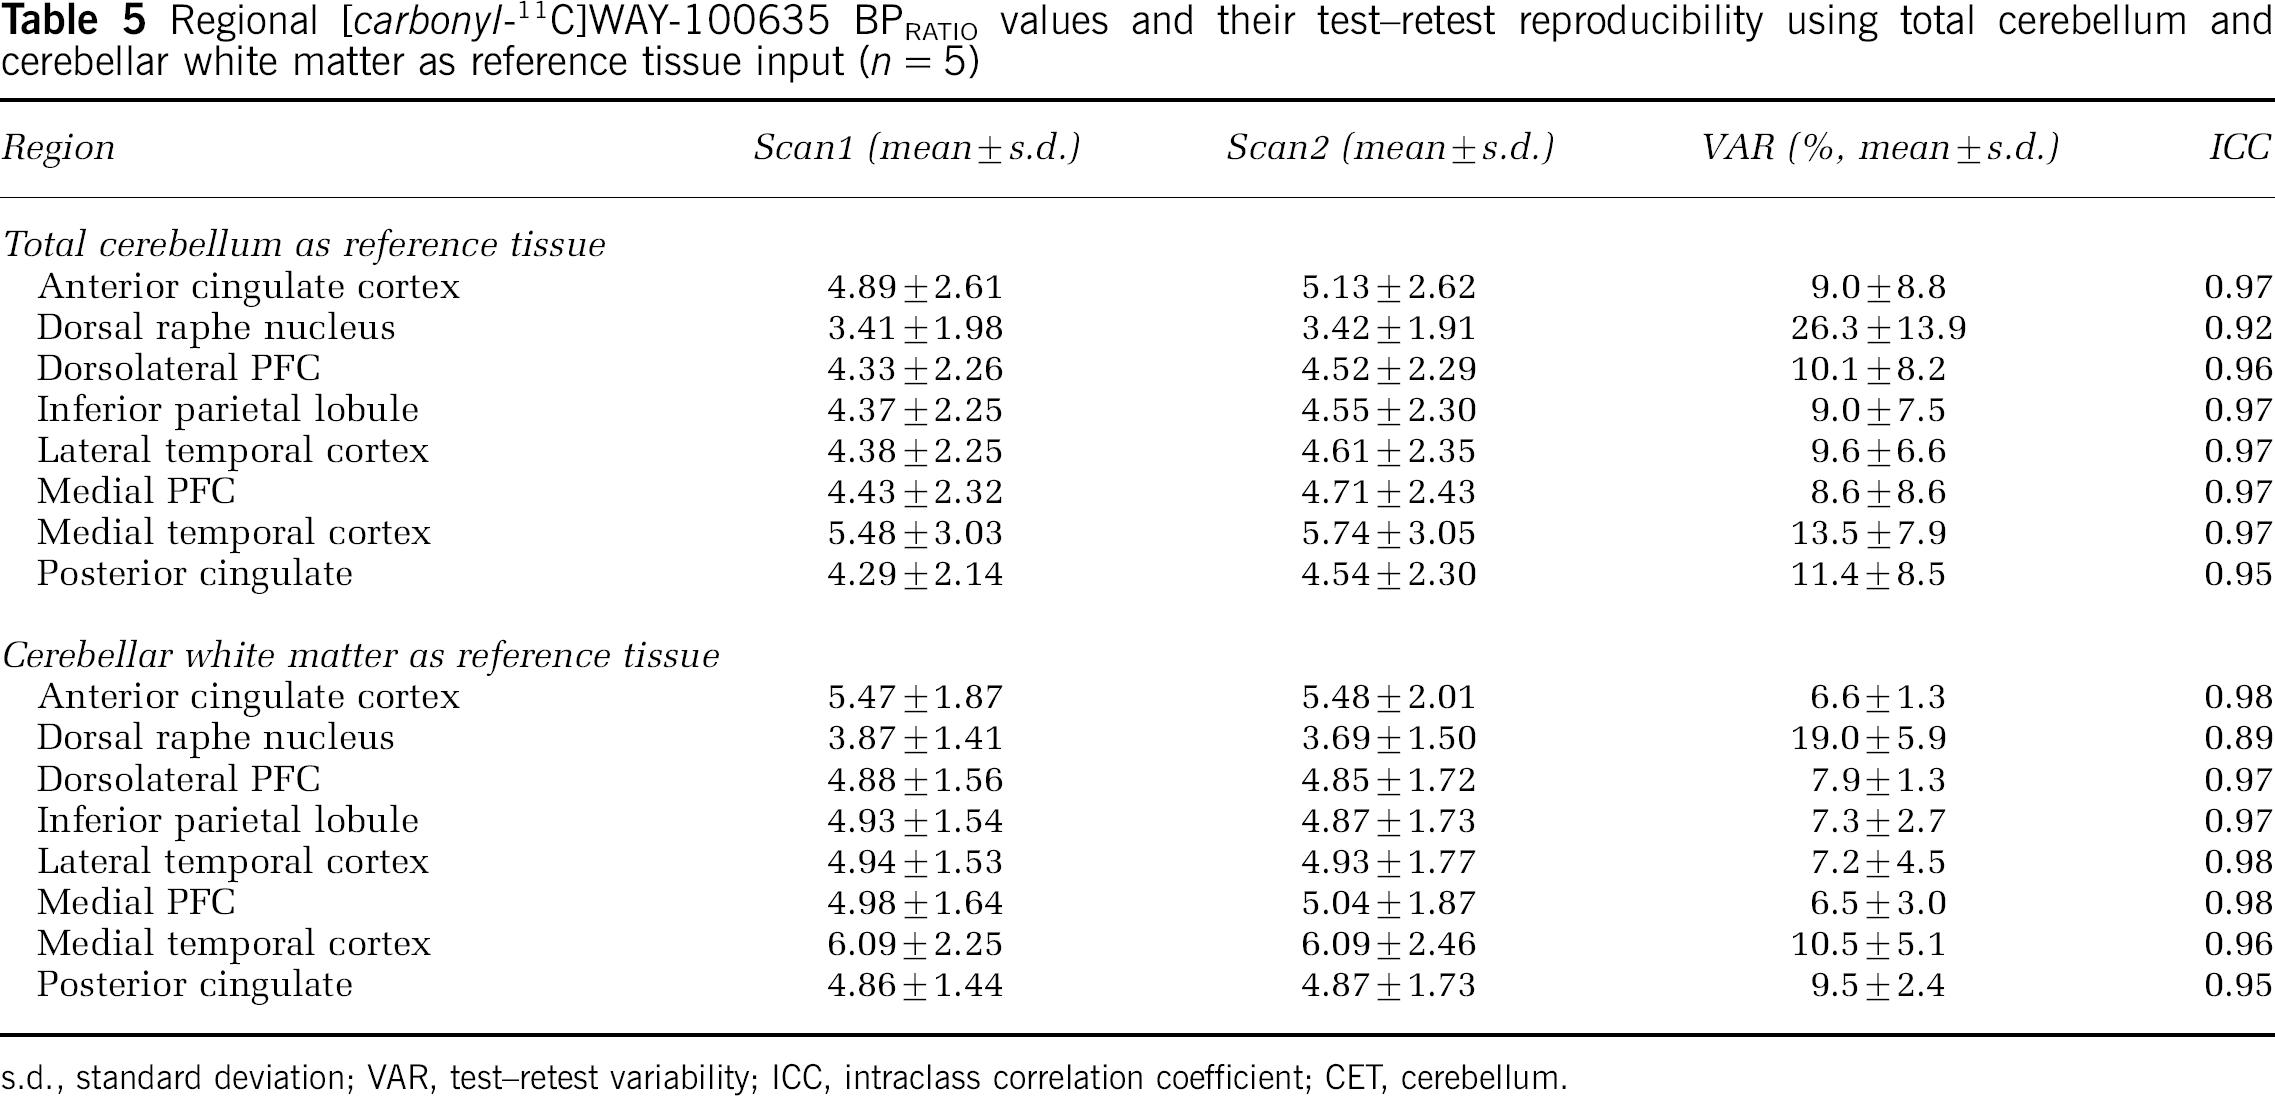
s.d., standard deviation; VAR, test–retest variability; ICC, intraclass correlation coefficient; CET, cerebellum.
Discussion
Distribution of [Carbonyl-11C]WAY-100635 Binding in the Brain
Distribution of [carbonyl-11C]WAY-100635 binding in the brain was consistent with previous postmortem (Burnet et al, 1997; Hall et al, 1997) and PET studies (Farde et al, 1998; Gunn et al, 1998; Pike et al, 1996) with this ligand: specific binding was highest in medial temporal regions (including the hippocampus and amygdala), insular cortex and neocortical regions such as the prefrontal cortex. Raphe nuclei displayed moderate uptake. Very low uptake was found in the basal ganglia and thalamus, and hence no attempt was made to quantify specific binding in these regions. VT values ranged from around 3 in the raphe nuclei to around 5 in the medial temporal regions. In the cerebellum, the uptake of [carbonyl-11C]WAY-100635 was generally low, as indicated by VT values less than unity. In contrast, we present a case with prominent [carbonyl-11C]WAY-100635 binding in the cerebellum, which was most marked in cerebellar cortical gray matter and vermis.
Cerebellar Uptake of [Carbonyl-11C]WAY-100635
Case 2 in the present study had exceptionally high uptake of [carbonyl-11C]WAY-100635 in the cerebellum. For example, the mean VT of test and retest scans for vCER, gmCER and wCER were 3.78, 2.79 and 1.02, compared against the respective mean values for others (n = 4) of 0.82, 0.55 and 0.43, yielding respective ratios of 4.6, 5.1 and 2.4. Thus, this increased uptake was predominantly seen in cerebellar gray matter. However, as indicated by the two-fold VT in wCER in Case 2 as compared with others, it is possible that the uptake into white matter is also altered, reflecting differences in nonspecific binding. It is worth noting that due to the small size of the wCER ROI and partial volume effects, spill-in of radioactivity from adjacent cerebellar gray matter regions is expected to be higher in this individual resulting in higher uptake in wCER. The high cerebellar uptake of [carbonyl-11C]WAY-100635 in Case 2 was a very consistent observation with highly reproducible cerebellar VT measurements in this subject as indicated by low VAR values (0.7 to 4.7).
Previous autoradiographic studies on central 5-HT1A receptor using either the agonist 8-OH-DPAT or the antagonist WAY-100635 have generally found very little receptor binding in the human cerebellum (Hall et al, 1997; Pazos et al, 1987). However, Parsey et al (2005) recently demonstrated specific [3H]WAY-100635 binding in the cerebellum, which was marked in the vermis, lower in cerebellar cortex and negligible in cerebellar white matter. Studies on the ontogenesis of 5-HT1A receptors using post-mortem samples of human cerebella have demonstrated that these receptors are present during the fetal and neonatal stages but not in adults (del Olmo et al, 1994; Slater et al, 1998). However, Slater et al (1998) also showed that patients with schizophrenia have conspicuous 5-HT1A binding in cerebellar vermis, a phenomenon that was interpreted as reflecting neurodevelopmental aspects of the disease (differences in other cerebellar regions were not reported). While Case 2 in the current study was healthy in somatic and psychiatric examination, it is possible that persistent 5-HT1A receptors in the adult cerebellum are a marker of delayed neurodevelopment and vulnerability to psychiatric disorders. However, it is not known whether cerebellar 5-HT1A receptors in schizophrenia or in the healthy individual in the current study reflect failure to regress or reappearance of these receptors after early childhood. The time course of these cerebellar 5-HT1A receptor alterations can only be addressed definitively using longitudinal study settings. At present, the prevalence of persistent cerebellar 5-HT1A receptor in the healthy adult population is not known. At our laboratory, we have not observed cerebellar uptake of this magnitude in any other of the about 35 healthy individuals, aged 15 to 50 years, examined with [carbonyl-11C]WAY-100635. Rabiner et al (2002) reported abnormalities in [carbonyl-11C]WAY-100635 cerebellar time–activity curves in 5 out of 66 healthy subjects, but these cases were excluded from further analysis and, thus, the exact nature of cerebellar uptake of [carbonyl-11C]WAY-100635 in these individuals remained unknown. On similar grounds, three out of 26 patients with Parkinson's disease were excluded (Doder et al, 2003). Unless arterial input is available for the absolute quantification of cerebellar VT, specific binding to 5-HT1A receptors in the cerebellum could induce modeling bias in studies investigating [carbonyl-11C]WAY-100635 binding in schizophrenia in vivo (Tauscher et al, 2002; Yasuno et al, 2004).
It could be argued that the high cerebellar uptake of [carbonyl-11C]WAY-100635 is due to buildup of radioactive metabolites in this structure. A major metabolic route for [carbonyl-11C]WAY-100635 is deacylation to [11C]cyclohexanecarboxylic acid, which represents approximately 15% to 20% of the radioactivity in human plasma at 10 mins after [carbonyl-11C]WAY-100635 injection (Farde et al, 1998; Osman et al, 1998). This radioactive metabolite enters the monkey brain to small extent and binds nonspecifically, and is ultimately further metabolized into even more polar metabolites (Osman et al, 1998). Differences in uptake of [11C]cyclohexanecarboxylic acid could theoretically explain the higher VT in wCER, but not cerebellar gray matter, in Case 2. Another metabolic route for [carbonyl-11C]WAY-100635 is demethylation into [carbonyl-11C]desmethyl-WAY-100635 ([carbonyl-11C]DWAY-100635), which is avidly taken up into human brain and shows higher signal to noise ratio than [carbonyl-11C]WAY-100635 (Andrée et al, 2001). However, we consider it unlikely that [carbonyl-11C]DWAY-100635 would explain the high cerebellar uptake in Case 2. First, the contribution from [carbonyl-11C]DWAY-100635 to total radioactivity is very low or undetectable (Farde et al, 1998; Osman et al, 1998), and was not measurable in Case 2. Second, we would expect this metabolite to show specific binding to 5-HT1A receptors throughout the brain, not specifically in cerebellar gray matter (Andrée et al, 2002). Case 2 had a VT in cerebellar vermis five times the group average (absolute difference of 2.96 in VT), whereas VT values in medial and LTC were only 10 to 40% higher than the group average (absolute differences of 0.45 and 1.45 in VT), respectively. In fact, the same applies also to hypothesized differences in binding of [carbonyl-11C]WAY-100635 to plasma proteins, which should change the measured radioactivity concentration in all regions. Unfortunately, measurements of the free fraction of [carbonyl-11C]WAY-100635 in plasma is not reliable (Parsey et al, 2000). Third, [carbonyl-11C]DWAY-100635 is metabolized into [11C]cyclohexanecarboxylic acid as rapidly as [carbonyl-11C]WAY-100635 (Andrée et al, 2002), and thus, the contribution of [carbonyl-11C]DWAY-100635 to the overall signal in the brain probably remains low in our study.
Considerations on the Cerebellum as a Reference Region for the Estimation of Specific Binding
First, BP values were estimated indirectly from regional VT values. A model with two tissue compartments (2TM) was used for both regions of interest and reference region. This derivation of BP was considered a reference method since it involved less assumptions than other methods such as the SRTM. Three previously published studies have looked at the test–retest characteristics of [carbonyl-11C]WAY-100635 binding measurements in healthy humans. In their study of six healthy subjects, Gunn et al (1998) reported good reproducibility and reliability for BPSRTM measures, while BPIND measurements were associated with higher variability and lower ICCs (data calculated from Tables 2 and 4 in Gunn et al, 1998). Parsey et al (2000) examined five healthy subjects, and, in contrast, found best reproducibility and reliability for BP values (in their notation, the distribution volume of the specifically bound radiotracer relative to the plasma concentration) and poorer test–retest characteristics for k3/k4 values (in their notation, BP normalized to the distribution volume of the reference region, equivalent to BP as defined in the current study). Tauscher et al (2001) reported good reproducibility and reliability for BPSRTM measured in a 60-mins scan in six subjects. In our data, using totCER as a reference region, BPIND values were well reproducible and reliable as indicated by low VAR and high ICC values. The use of wCER as the reference region produced numerically higher BPIND values and comparable test–retest characteristics. BPSRTM values were underestimated as compared with BPIND values, as previously reported (Gunn et al, 1998; Parsey et al, 2000). This may be secondary to violation of the inherent assumption of the SRTM that a 1TM adequately describes activity in the reference region. As with the indirect estimation, the use of wCER as the reference region yielded higher BP values. However, BPSRTM measurements with wCER demonstrated significantly poorer test–retest reproducibility and reliability compared with measurement using totCER. This is probably due to the noisy appearance of the wCER time–activity curve (Figure 4) and the fact that is it used as direct input into the SRTM. Finally, BP estimated using the integral method (BPRATIO) showed good test–retest characteristics using totCER as a reference region and even better using wCER. This is plausible considering that the shape of the wCER time–activity curve will not propagate error variance into the integral term as it does into the SRTM. With all methods, estimations of specific binding of [carbonyl-11C]WAY-100635 in the raphe nucleus was associated with poor reproducibility and reliability, which is consistent with previous studies (Gunn et al, 1998; Parsey et al, 2000). In conclusion, it seems that cerebellar white matter is a valid reference region for [carbonyl-11C]WAY-100635 studies. When arterial input function is available, BP should be estimated indirectly from VT values. When arterial input function is not available, simpler methods such as the integral method should be used to avoid bias originating from noisy reference region curve.
Conclusions
We have described a healthy individual with exceptionally high uptake of [carbonyl-11C]WAY-100635 in the gray matter of cerebellum that was highly reproducible and most likely reflects specific binding to 5-HT1A receptors. More studies are needed to properly elucidate the prevalence of cerebellar 5-HT1A receptors in the healthy population, and to establish the putative role of these receptors in vulnerability to psychiatric disorders. With regarding to modeling issues, we conclude that to avoid bias originating from specific binding of [carbonyl-11C]WAY-100635 to 5-HT1A receptors in the cerebellum, cerebellar white matter seems to be a useful reference region when using BP estimations from regional VT values calculated with arterial input function. However, this structure may not be appropriate for direct reference tissue input for SRTM analysis due to the noisy appearance of the cerebellar white matter time–activity curve. Instead, it does provide robust BP estimates with simpler methods, such as the ratio analysis, when no arterial input function is available. Finally, as gender differences in wCER VT has been reported (Parsey et al, 2005), the choice of outcome will ultimately depend on the study design.
Footnotes
Acknowledgements
The staffs of Turku PET Centre and the MRI Unit of Turku University central hospital are acknowledged for skillful assistance in performing PET and MRI scanning.