
Abstract
We examined the roles of diffusion, convection and capillary transporters in solute removal from extracellular space (ECS) of the brain. Radiolabeled solutes (eight with passive distribution and four with capillary or cell transporters) were injected into the brains of rats (n = 497) and multiple-time point experiments measured the amount remaining in brain as a function of time. For passively distributed compounds, there was a relationship between lipid:water solubility and total brain efflux:diffusional efflux, which dominated when kp, the transcapillary efflux rate constant, was >100h−1; when 10−1< kp< 10−2h−1 both diffusion and convection contributed, and when kp< 10−3h−1, convective efflux dominated. Para-aminohippuric acid (PAH) experiments (n = 112) showed that PAH entered the brain passively, but had efflux transporters. The total efflux rate constant, keff, was the sum of a passive component (kp = 0.0018 h−1), a convective component (kcsf = 0.2 h−1), and a variable, concentration-dependent component (kx = 0 to 0.45 h−1). Compounds with cell membrane transporters had longer clearance half times as did an oligonucleotide, which interacted with cell surface receptors. Manipulation of physiologic state (n = 35) did not affect efflux, but sucrose efflux half time was longer with pentobarbital anesthesia (24 h) than with no anesthesia or ketamine-xylazine anesthesia (2 to 3 h). These results show that solute clearance from normal brain ECS may involve multiple physiologic pathways, may be affected by anesthesia, and suggests that convection-mediated efflux may be manipulated to increase or decrease drug clearance from brain.
Keywords
Introduction
The entry of drugs and solutes from the blood into the brain has been studied extensively (Bradbury, 1979, 1992; Davson and Segal, 1996; Rapoport, 1976). For the overwhelming majority of compounds, the mechanism of entry into the normal brain is by simple diffusion from blood; for a few compounds, most of which are metabolic substrates, carrier systems exist at the blood–brain barrier (BBB) (Neuwelt, 2004).
In contrast, the rates and pathways by which drugs leave the brain have been studied much less extensively. Fenstermacher et al (1981) reviewed two major techniques available at that time for studying brain-to-blood efflux, which included the brain washout method and ventriculocisternal perfusion. Both methods indicated that influx and efflux across the BBB were symmetrical. However, they concluded that both methods had significant limitations, such as being limited to compounds with moderate to high BBB permeability. Cserr et al (1981) introduced another method of measuring solute efflux from the brain; with this method a small amount of solute was injected directly into the brain and the clearance of the solute from brain was measured over time. Their studies indicated that three different compounds, varying in size from 900 to 69,000 Da, left the brain at similar rates, from which they concluded that convective loss was a major pathway of solute removal from the brain. Cserr's method has been used in a modified fashion by Terasaki and colleagues (Kakee et al, 1996, 1997; Kusuhara et al, 2003), which they called the Brain Efflux Index (BEI).
Recent reviews about the BBB and brain efflux do not mention convection-mediated brain efflux (Edwards, 2005; Golden and Pollack, 2003; Neuwelt, 2004; de Boer et al, 2003). The introduction of convection-enhanced delivery (CED) as a drug administration methodology has renewed attention on drug removal pathways from the normal brain. Convection-enhanced delivery involves the infusion of drugs directly into the extracellular space (ECS) of the brain (Morrison et al, 1994; Laske et al, 1997; Groothuis, 2000). Consequently, the rates as well as the mechanisms by which drugs leave the extracellular fluid (ECF) become important issues. If efflux is dominated by diffusion across the BBB, the implications for the time course of drug concentration in tissue will be far different from that if bulk removal pathways dominate efflux. To the extent that efflux transporters contribute to solute removal, the issue becomes even more complex.
We re-explored the efflux of a broad range of solutes from the brain using a brain-loading approach similar to that of Cserr et al (1981). Since this method does not permit sampling of the input, we also evaluated delivery methods and parameters to assure that brain delivery was optimized. We included solutes that varied considerably in size and physicochemical properties and some that had transport systems across the BBB and/or cell membranes. We also included experiments to determine whether the rate of convection-mediated efflux from the brain was affected by the physiologic state of the animal and to study the source of the pressure gradient that drives the convective process.
Materials and methods
There were three objectives. (1) The objective of the first set of experiments was to determine the accuracy of the delivery methods used in these experiments, since there was no way of independently monitoring the input function. (2) In the second set of experiments, identical conditions were used to measure the efflux constant of 14 different radiolabeled compounds. Two different methods of evaluation were used (tissue sampling and quantitative autoradiography (QAR)) and experiments were performed in duplicate by separate individuals to evaluate reproducibility. Some of the compounds used in these experiments were known to passively distribute, while others had putative carrier-mediated transporters at the BBB or cell membranes. One compound with an efflux transporter, para-aminohippuric acid (PAH), was studied in more detail: competitive inhibition of influx and efflux was measured, using sucrose as a control. (3) In the third set of experiments, the efflux constant of 14C-sucrose, which was cleared by convection-mediated efflux, was measured in groups of animals using different anesthetics and with different vasoactive compounds.
Experiment Group 1. Validation of Solute Delivery
Three approaches were used to evaluate delivery and potential solute loss: in the first, isotope was injected into empty scintillation vials with different syringe systems; in the second, isotope was injected into brain to determine recovery efficiency; and in the third, we evaluated reflux along the cannula pathway during the infusions.
Validation of Delivery System: Vials: A stock solution of 14C-iodoantipyrine (14C-IAP, 40 to 60 mCi/mmol, New England Nuclear, Boston, MA, USA) was prepared at a concentration of 1 μCi per 50 μL in saline. The radiochemical purity of 14C-IAP was greater than TLC by 95% (Sakurada et al, 1978). Two different delivery systems were evaluated to simulate intracerebral injections. In the first, a 50-μL Hamilton syringe with a fixed ½-in, 30-gauge needle was loaded with 30 μL of 14C-IAP. The syringe was placed into a Kopf stereotactic apparatus and used to deliver 5 μL of the isotope solution into each of ten 7-mL tared scintillation vials that had been prepared with a layer of gel foam on the bottom of the vial and a layer of parafilm over the opening to retard evaporation. After delivery of the isotope solutions the vials were reweighed and 1 mL of tissue solubilizer was added, and after the gel foam was dissolved, 6 mL of scintillation fluor was added. The syringe and needle were flushed with saline and the saline placed in a separate scintillation vial. Radioactivity was counted in a liquid scintillation counter (LSC, Tricarb 2300TR, Packard Bioscience, Meridian, CT, USA) and corrected for quenching with 14C standards. In the second method, a 25-μL syringe was placed in an Orion ATI Sage Model 365 infusion pump, and attached to a brain infusion kit (Durect Corp., Palo Alto, CA, USA) with polyethylene tubing; 5 μL of 14C-IAP was delivered during 10 mins to each of 10 scintillation vials and radioactivity counted. The syringe, needle and tubing were flushed with saline and the saline placed in a separate scintillation vial. The data were evaluated to determine the mean ± s.d. and coefficient of variation (CV, %) of the two methods, as well as delivery efficiency (amount actually delivered/amount used in the injection system). The amount in the syringe, needle and tubing was measured to document the undelivered isotope.
Validation of Delivery System: Brain: These experiments represented zero-time controls as used by Cserr et al (1981) and were used to document recovery efficiency in a brain model. Animals (n = 10) were anesthetized with a mixture of ketamine (50 mg/kg), xylazine (7.5 mg/kg) and saline. Animals were decapitated to eliminate the possibility of any loss to systemic tissues, and the heads were mounted in the stereotaxic apparatus. A 50-μL gas-tight syringe with a fixed needle was used to deliver intracranial infusions of 5 μCi of 14C-sucrose ([14C(U)]-, 600 mCi/mmol), Moravek Biochemicals, Brea, CA, USA) in 5 μL of normal saline during a period of 10 mins into the caudate nucleus. The needle was allowed to remain in place for 5 mins and then removed in 1 min. The brain was removed, homogenized as described below, and samples of brain homo-genate and infusion solution used for LSC, along with the appropriate quenched standards. The amount in the syringe, needle and tubing was measured to document undelivered isotope.
Evaluation of Reflux During Infusion: These studies were conducted in rats that had been prepared for infusions into the caudate, using a 30-gauge needle attached to a 50-μL gas-tight syringe, as described. Absorbent material (absorbent cotton, gel foam or laboratory wipes) was placed around the needle and packed into the burr hole. An infusion of radioisotope was performed during 10 min, as described. Once the infusion needle was withdrawn, the absorbent material was placed into a tared scintillation vial and radioactivity content was measured by LSC. The percentage lost by reflux was calculated as ((total radioactivity in absorbent material)/(total radioactivity administered)) × 100. Rats from the zero time point controls (above, n = 10) and zero time point experiments (n = 42) were used (Table 1).
Summary of efflux experiments
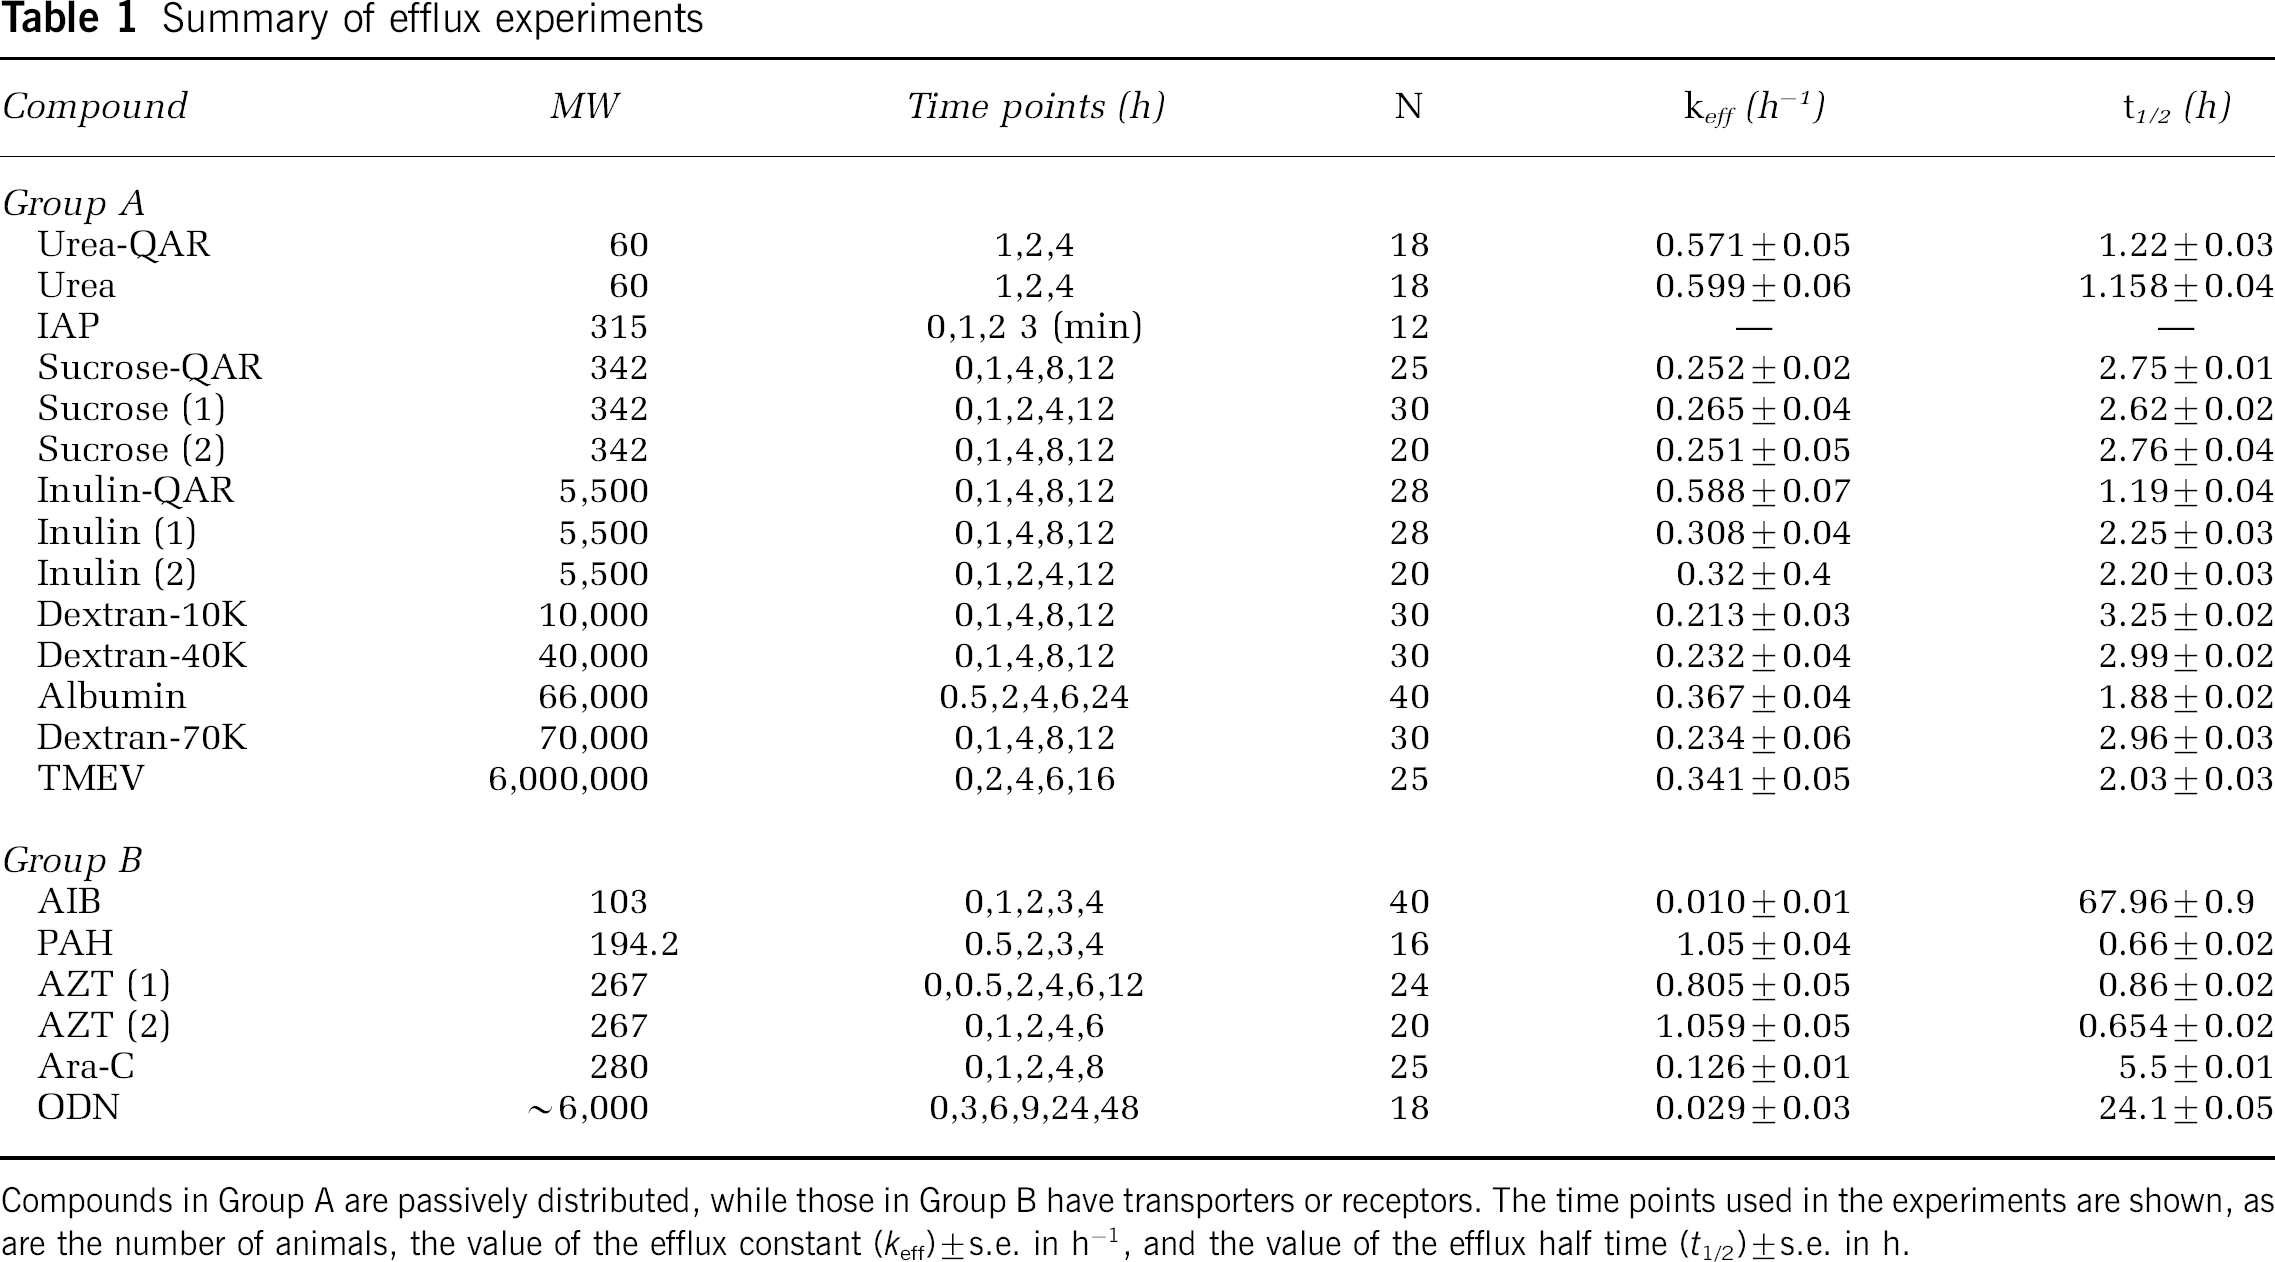
Compounds in Group A are passively distributed, while those in Group B have transporters or receptors. The time points used in the experiments are shown, as are the number of animals, the value of the efflux constant (keff) ± s.e. in h–1, and the value of the efflux half time (t1/2) ± s.e. in h.
Experiment Group 2: Efflux Constants of Different Solutes
Animal Preparation: The Institutional Animal Care and Use Committee of Evanston Northwestern Healthcare approved all animal experimentation. Sprague-Dawley rats (350 to 400 g) were anesthetized with ketamine and xylazine, the ear canals coated with 2% viscous xylocaine, and placed into a Kopf stereotaxic frame. A 1 cm incision was made through the scalp, the fascia on the skull cleared with a cotton swab, and a 23-gauge needle was used to make a burr hole through the skull that was 2.5 mm lateral and 1 mm anterior to the bregma. A test solution of 0.5% Evans blue dye was injected in test animals to confirm that the target was in the center of the caudate nucleus, according to the atlas of Paxinos and Watson (1986). For isotope injections, a 50-mL syringe with a fixed 30-gauge needle was inserted during 2 mins into the brain to a depth of 6 mm below the surface skull, 5 μL was injected during 10 mins, and the needle was withdrawn during 1 min. Body temperature was measured with a rectal probe, arterial blood gases were measured during the experiments, and hematocrit measured at the beginning and end of the experiments. The animals were euthanized at selected time points (Table 1), the brains removed from the skull and frozen at −80°C. Two methods were used to evaluate tissue radioactivity concentration. In the first, frozen brains were tared and homogenized with saline (2 times the brain weight). After homogenization, the mixture was vortexed, two 100-mL samples pipetted into tared 7 mL scintillation vials, and radioactivity concentration determined by LSC. The tissue radioactivity values were corrected for the weight of the brain in individual animals. In the second method, the frozen brains were serially sectioned at 20 μm thickness on a cryostat and placed on an X-ray film along with 14C-methylmethacrylate standards for QAR. The films were digitized at 50 μm resolution with a video digitizing system and tissue radioactivity concentration determined in sections through the center of the injection.
For experiments with PAH, more extensive experiments were performed to examine influx and efflux in the absence and presence of inhibitors. Brain influx was measured after the intravenous injection of a bolus of 50 μCi 14C-PAH in 1 mL saline in three groups (n = 8 in each group): no probenecid, 200 mg/kg probenecid and 400 mg/kg probenecid. Probenecid was administered intraperitoneally 30 mins before administration of PAH. Plasma samples were collected at timed intervals before euthanasia. The rats were decapitated at 20 min. Plasma samples were counted by LSC; brain radioactivity concentrations were measured with LSC and QAR; one half of the brain was used for each measurement technique. For efflux experiments, 14C-PAH was injected intracerebrally in three groups (n = 16 in each group): no probenecid, 200 and 400 mg/kg probenecid. In a control group of rats (n = 16) the effect of 400 mg/kg probenecid on efflux of 14C-sucrose was studied. Within each group, four animals were killed at each of the following time points: 0.5, 1, 2 and 4 h. Self-inhibition with unlabeled PAH was studied in six groups of four animals each, adding unlabeled PAH (0, 1, 10, 25, 50 and 100 mmol/L) to the 14C-PAH before intracerebral injection; animals were killed at 1 h.
Isotope Solutions and Preparation: For these experiments, a total of 14 radiolabeled compounds were used: 14C-IAP, 14C-α-aminoisobutyric acid (14C-AIB, [1-14C], 40 to 60 mCi/mol); 14C-urea (59 mCi/mmol); 14C-inulin (carboxyl-14C-inulin, 1.8 mCi/g), 125I-bovine serum albumin (125I-BSA, 231 Ci/mmol); 14C-para-aminohippuric acid (14C-PAH, 632 mCi/mmol); and 14C-sucrose (all Dupont NEN, Wilmington, DE, USA); 14C-azidothymidine (14C-AZT, 3′-azido 3′-deoxythymidine, [2-14C], 55 mCi/mmol); 14C-cytosine arabinoside (14C-AraC, cytosine-β-D-arabinofuranoside [2-14C]-, 56 mCi/mmol) (both Moravek Biochemicals, La Brea, CA, USA); 14C-dextran, 10, 40 and 70 kDa (dextran, 14C-methylated, 2 mCi/g) (Sigma Chemical Co., St Louis, MO, USA). Radiochemical purity of each compound was >98%. Experiments with 14C-sucrose, 14C-inulin and 14C-AZT were performed in duplicate by different individuals to document inter-experimental reproducibility. Experiments with 14C-urea, 14C-sucrose and 14C-inulin were evaluated separately by tissue sampling and QAR.
For experiments with an oligonucleotide (ODN), a scrambled sense version (5′-ttg tac ctt agg cgc gc-3′) of an antisense ODN against VEGF was used (NBI, Plymouth, MN, USA), in which approximately every third base was changed while keeping the same base composition. The ODN was end-labeled with 35S-dideoxyadenosine 5′ (alpha-thio)triphosphate (35S-thiophosphate, 1,250 Ci/mmol, Dupont NEN, Wilmington, DE, USA) (Yousef et al, 1984), and 106c.p.m. was injected into each animal by CED as described above. The brains were removed, homogenized, and aliquots were counted by LSC as described above. Oligonucleotide was extracted from brain to determine the fraction of intact ODN (Agrawal et al, 1991).
For experiments with Theiler's murine encephalomyelitis virus (TMEV), baby hamster kidney-21 cells were infected with the BeAn strain of TMEV, and 35S metabolic labeling reagent (Trans35S-Label Metabolic Labeling Agent, 989 Ci/mmol, ICN Biomedicals, Solon, OH, USA) in the presence of methionine and cysteine was used to label replicating virus (Hertzler et al, 2000). Radiolabeled virus was purified on 20 to 70% sucrose gradients. Each rat was injected with 0.08 μCi 35S-TMEV by CED, as described above. At the end of experiments, rats were euthanized and the brains processed for QAR.
Experiment Group 3: Manipulation of Physiologic State
Animal Preparation: Seven different experimental groups were used in these experiments, with five rats per group. The zero time point controls have been described above. For purposes of reference, the other six groups are referred to as: Adenosine, Epinephrine, Pentobarbital, Awake-Restrained, Awake-Roaming and Hypovolemic. Adenosine infusions and hypovolemic hypotension were used to create a hypotensive state. Epinephrine infusions were used to create a hypertensive state. Pentobarbital was used to duplicate the anesthetic conditions used by Cserr et al (1981). The Awake groups were used to study efflux without anesthesia; in one (Awake-Restrained) plasma samples were obtained and in the other (Awake-Roaming) they were not.
The rats of the Adenosine, Epinephrine and Hypovolemic groups were anesthetized with ketamine and xylazine. The Pentobarbital animals were anesthetized with 0.4 to 0.5 mL (40 mg/kg) of pentobarbital by intraper-itoneal injection, as performed by Cserr et al (1981). The animals in the two awake groups were anesthetized with gas anesthesia (isoflurane/nitrous oxide/oxygen, 2.0/30/70, v/v/v) during intracerebral infusion and then allowed to awaken. In all but the Awake-Roaming animals, unilateral femoral venous and arterial catheters were inserted. A 50 μL Hamilton syringe with an attached needle was used to deliver an infusion of 5 μCi of 14C-sucrose in 5 μL of normal saline (a single stock solution containing 1 μCi/μL was used for all experiments) over a period of 10 mins to the caudate, as described. After 5 mins the infusion needle was slowly removed over 1 min. Except for the rats in the Awake-Roaming Group, plasma samples were taken at 10, 30, 60, 90 and 120 mins and mean blood pressure, systolic blood pressure and pulse readings were recorded every 15 mins. Body temperature was measured with a rectal probe, arterial blood gases were measured during the experiments, and hematocrit measured at the beginning and end of an experiment. The venous catheters were used to deliver pharmacologic agents and/or anesthesia as needed. Animals in the Epinephrine group received a continuous infusion of epinephrine (1 μg/kg/min, Sigma Chemical Co., St Louis, MO, USA) into the femoral venous line and blood pressure was measured every 5 mins. Animals in the Adenosine group received a continuous infusion of adenosine (0.225 mg/min, Sigma Chemical Co., St Louis, MO, USA) and blood pressure was measured every 5 mins. The rats in the Awake-Restrained Group were secured in a plaster cast, placed on a lead brick, and allowed to awaken as described previously (Blasberg et al, 1981). The rats in the Awake-Roaming Group were allowed to awaken from anesthesia and to roam freely in a cage. Before infusing the 14C-sucrose, the rats in the Hypovolemic Group were subjected to hypovolemic hypotension by removal of 2 to 6 mL of blood from the arterial line to reduce systolic blood pressure to 60 mm Hg. At 120 mins, all animals were euthanized, decapitated and whole brains were tared and frozen for later homogenization. Two homogenate samples of 100 μL were taken and LSC was used to determine radioactivity levels in plasma, brain aliquots and samples of infusate.
Calculation of Efflux Constant: The approach of Cserr et al (1981) was used to calculate the value of the total brain efflux constant (keff):

where Nb is the amount remaining in the brain at the end of the experiment, Ni is the amount injected into the brain and t is the time. Tissue radioactivity concentrations (nCi/g) versus time were fitted to equation (1) by linear least-squares regression to obtain the value of keff. The slope of the best fit was expressed as the efflux rate constant ± s.e. (standard error) and the goodness of fit was evaluated with the sum of squares error.
Calculation of Brain Influx Constant: In the PAH experiments the influx constant was calculated from the expression:
where K1 was the influx constant (mL/gmin), Cbr was radioactivity concentration in brain (nCi/g), Cp was the plasma radioactivity concentration (nCi/mL), Cpf was the final plasma concentration, Vp was the tissue plasma space (mL/g) and T was the experimental duration (min). The value of Vp was obtained from published data for normal rat brain (Cremer and Seville, 1983; Nakagawa et al, 1987).
Statistics: Data between experiments were compared using Students t-test, and data among several experiments were compared by ANOVA.
Results
Validation of Solute Delivery and Reflux
The stock solutions contained 2.8 × 10⁵c.p.m./5 μL 14C-IAP. In the fixed needle, manual injection experiments, recovery was 2.0 ± 0.09 × 10⁵c.p.m., with an efficiency of 69.4% and a CV of 4.9%; the remaining isotope (29.7%) was recovered from the syringe and needle. In the fixed needle, infusion pump experiments, the recovery was 1.7± 0.8 × 10⁵c.p.m., with an efficiency of 59.7% and a CV of 50.2%; most of the remaining isotope (35.4%) was recovered from the syringe, tubing and removable needle. In two experiments in which recovery was low, there was a leak at a junction between the catheter and cannula. In the zero time point experiments, in which the stock solution contained 9.1 × 10⁵c.p.m./5 μL 14C-sucrose, recovery was 8.4 ± 0.8 × 10⁵c.p.m., with an efficiency of 91.7% and a CV of 10.2%; the remaining isotope (8.2%) was recovered from the syringe and fixed needle. In these experiments a single syringe was loaded with isotope for five rats to minimize the effects of dead space. In every case where reflux loss was measured, it was less than 1% of the amount administered (for zero time controls: 0.31%± 0.02%, n = 10; for other zero time point experiments: 0.42%±0.04%, n = 42). Based on these results, all experiments were performed with the fixed-needle, manual injection technique. The syringe was loaded with isotope for multiple injections to minimize dead space.
Efflux of Passively Distributed Solutes
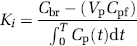
The compounds with passive distribution are listed as Group A in Table 1. An example of the data from a tissue-sampling inulin experiment is shown in Figure 1. Except for IAP, the remaining compounds had a range of efflux half times from 1.21 h (urea tissue sampling) to 3.25 h (dextran 10K). The data from IAP, which were collected at 0, 1, 2 and 3 min after the completion of the injection, showed that only 0.004% of the injected dose had been recovered in brain tissue at those time points, indicating that passive capillary efflux occurred at a rate that was too rapid to be measured by these methods. If the data from the two urea experiments are excluded (for reasons reviewed in Discussion), the mean efflux half time was 2.4 ± 0.7 h, with a range from 1.9 to 3.3 h. For sucrose, inulin and AZT, experiments were conducted in duplicate by different individuals and there was no significant difference between the calculated efflux half times (P> 0.05). The efflux rates of three compounds (urea, sucrose and inulin) were measured by both tissue sampling and QAR. In each case there was no significant difference between the efflux half times measured by the two methods (P < 0.05). The molecular size of the compounds used in this study varied from 60 Da (urea) to 8.4 million Da (TMEV).
Plot of efflux data for inulin. The mean±s.d. of data from 0, 1,2,4 and 12 h are shown, along with the linear least-squares fit, efflux constant and efflux half time. The sum of squares fit for the data was 0.0002.
Efflux of Compounds With Carrier-Mediated Transport
Those compounds with known or putative transport systems are presented as Group B in Table 1. Three (AIB, Ara-C and the ODN) had decreased efflux half times. In the case of AIB, the efflux half time was 68 h. Recovery of intact ODN was >90%, showing that it was not degraded during the time course of these experiments. Two solutes (PAH and AZT) had increased efflux half times.
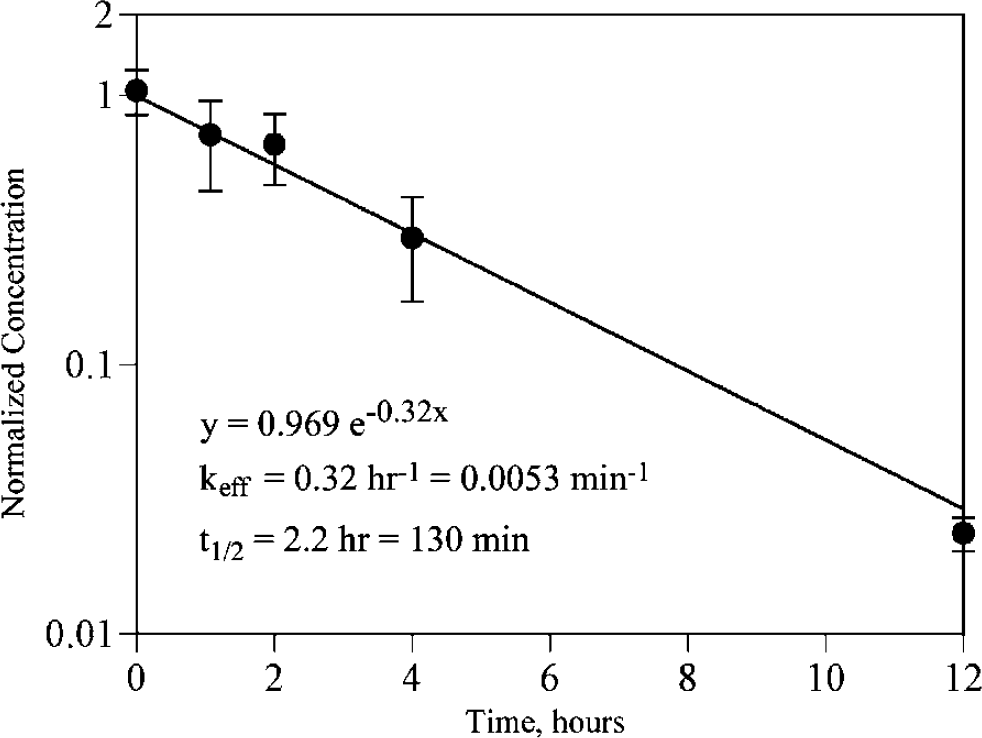
In the PAH influx experiments, more data were available than simply efflux half time. Probenecid had a profound effect on plasma 14C-PAH values, which was not unexpected because of known competitive inhibition between PAH and probenecid in the kidney. There was no difference in the plasma values between the 200 and 400 mg/kg groups, however, suggesting that the probenecid effect was saturated. As a result, there was a marked increase in the plasma arterial integral (PAI), from 3353± 700 (nCi/g) min in the 0 probenecid group to 15,543 ±1288 (nCi/g) min in the 200 mg/kg group and 15,467 ± 4584 (nCi/g) min in the 400 mg/kg group. Owing to the increased PAI, brain radioactivity concentration was increased in the probenecid groups over the control group. However, the transfer constant (K) of PAH was the same in all the three groups (Figure 2), indicating that brain influx of PAH is not carrier mediated; in the cortex, K =0.0002 ±0.0002 mL/g min (= 0.012 mL/gh). In contrast, the brain efflux constant was reduced by probenecid. The efflux rate constant with no probenecid was 0.65±0.11 h−1, with an efflux half time of 1.07±0.3 h (Figure 3). With 200 mg/kg probenecid, the efflux rate constant was 0.24±0.12 h−1 and the efflux half time was 2.80±0.6 h, and with 400 mg/kg, the efflux half time was 0.22±0.7 h−1 and the efflux half time was 3.31±0.9 h (Figure 3). In competitive inhibition experiments with unlabeled probenecid (Figure 4), Km was 14.8 μmol/L, and Vmax was 21.8 nmol PAH/gmin. When these data were analyzed to express keff as a function of concentration, keff at 0 mmol/L was 0.61 ± 0.09 h−1, and at 100 mmol/L keff was 0.21 ± 0.03 h−1. In the experiments with probenecid and 14C-sucrose, there was no difference between radioactivity concentrations in the 0 probenecid group (237±17.2 nCi/g) and the 400 mg/kg probenecid group (246±8.2 nCi/g).
Plasma transfer constant of 14C-PAH with and without probenecid. The transfer constant (K) of 14C-PAH is shown for two brain regions and choroid plexus in rats receiving no probenecid, 200 and 400 mg/kg. There is no difference between the groups, indicating the lack of blood-to-brain transport for PAH. The capillaries of the choroid plexus have increased permeability compared with those of brain.
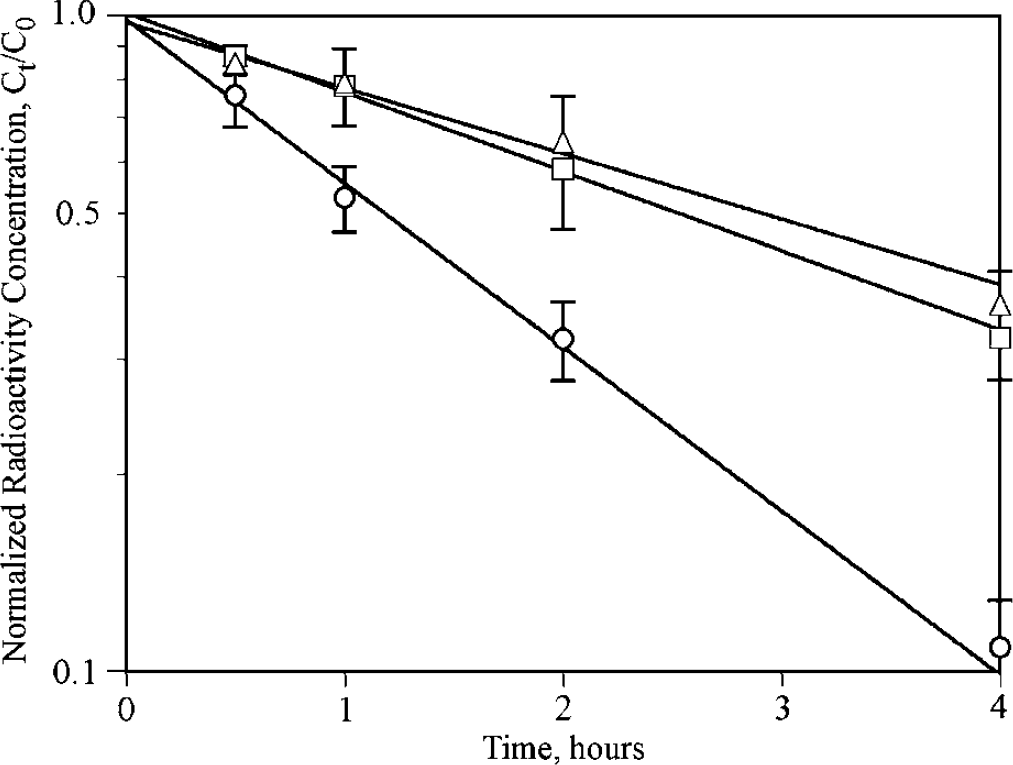
Efflux of 14C-PAH with and without probenecid. The time–concentration data for PAH are shown for no probenecid (open circles), 200 mg/kg probenecid (open triangles) and 400 mg/kg probenecid (open squares). Values on the × axis are normalized concentrations (concentration at time t divided by concentration at time 0). Values are mean±s.d. Probenecid inhibits efflux of PAH from brain, which saturates at 200 mg/kg.
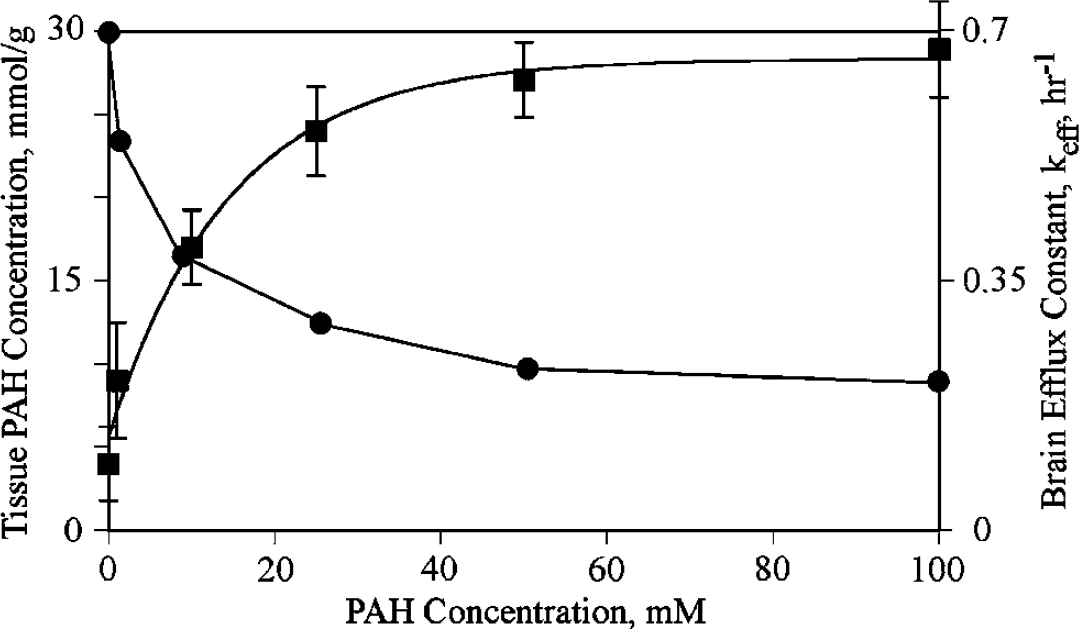
Michaelis-Menten plot of brain radioactivity of 14C-PAH with different concentrations of unlabeled PAH. On the left axis (squares) is shown tissue 14C-PAH concentration, mmol/g, as the concentration of unlabeled PAH is increased from 0 to 100 mmol/L. The rate decreases as a function of increasing amounts of unlabeled PAH, indicating that the brain efflux of PAH is competitive. On the right axis is shown the total brain efflux constant (keff, circles), which decreases as unlabeled PAH is increased. For tissue PAH, values are mean±s.d.
Manipulation of Physiologic State
These experiments were added to evaluate the possibility of physiologic state-dependent effects on convective efflux. The Pentobarbital Group was included to duplicate the experiments of Cserr et al (1981) and to examine the effect of pentobarbital anesthesia on efflux and compare it to ketamine-xylazine anesthesia (Table 1). The Awake-Restrained and Awake-Roaming groups were included to provide groups without anesthesia (although inhalation anesthesia was used during the infusion of 14C-sucrose). Two groups (Adenosine and Hypovolemia) were used to examine the effects of hypotension. The Epinephrine Group was used to examine the effects of hypertension. Table 2 compares the heart rate, systolic blood pressure, mean blood pressure and pulse pressure of the five groups for which physiologic data were available (the Awake-Roaming Group did not have measurements), as well as the calculated keff and t1/2 values. There was no difference in body temperature, arterial pO2, pCO2 or hematocrit between any of these groups. As expected, systolic BP and mean BP were lowest in the Adenosine and Hypovolemia Groups and highest in the Epinephrine Group. Only the Epinephrine Group showed a significant change in pulse pressure (98.2 ± 15.6 mm Hg; P < 0.05). The efflux half times of the Epinephrine, Awake-Restrained, Hypovolemia and Awake-Roaming groups were not statistically different (Table 2) from each other or from the original experiments (Table 1). The Adenosine Group had a more rapid efflux half time (1.7 ± 0.4 h; P = 0.04) and that of the Pentobarbital Group was significantly longer (24.5 ±8.8 h; P < 0.01). Since we could not measure the input function independently, we had collected plasma during the time course of these experiments as an independent way of confirming that the same amount of isotope had actually been administered to each animal. Conservation of mass stipulates that the sum of isotope from brain and from plasma should be the same for each group, assuming negligible loss to the rest of the body. Figure 5 shows a plot of brain tissue radioactivity concentration versus integrated plasma activity (PAI) for each of the five groups in which plasma activity was measured, along with values of total radioactivity (S = (brain radioactivity concentration × brain weight) + PAI). Brain tissue radioactivity was lowest and PAI highest in the Adenosine Group; conversely, brain tissue radioactivity was highest and PAI was lowest in the Pentobarbital Group, confirming that the observed change in the tissue radioactivity levels corresponded to an appropriate, and opposite, change in the plasma radioactivity levels. Total recovered radioactivity values did not differ between groups (Figure 5).
Effect of physiological state on efflux constant of 14C-sucrose
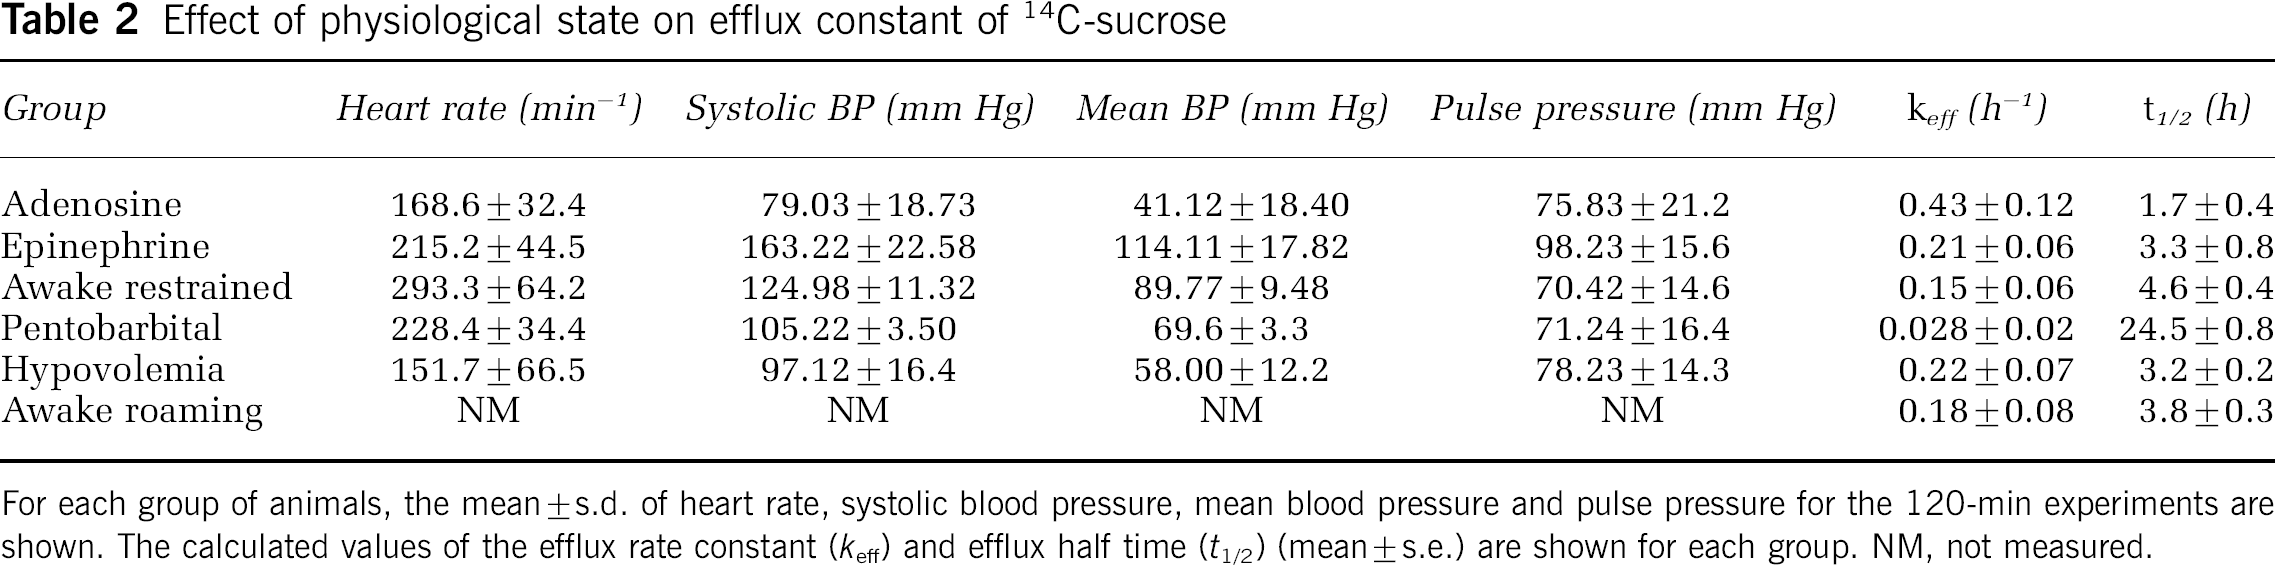
For each group of animals, the mean±s.d. of heart rate, systolic blood pressure, mean blood pressure and pulse pressure for the 120-min experiments are shown. The calculated values of the efflux rate constant (keff) and efflux half time (t1/2) (mean±s.e.) are shown for each group. NM, not measured.
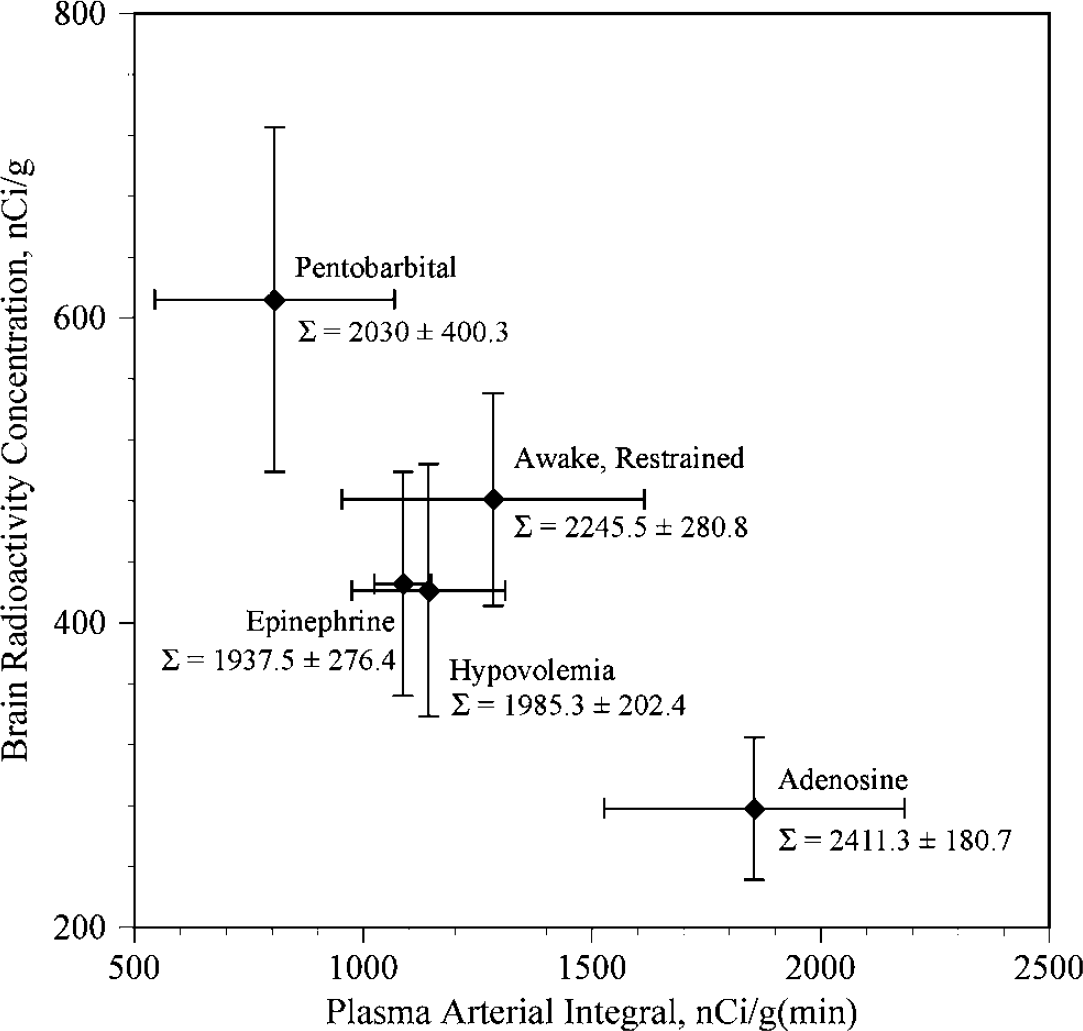
Tissue radioactivity versus integrated plasma radio-activity in five different groups of rats. The vertical axis shows tissue radioactivity concentration (nCi/g±s.d.) at the end of the experiments (120 mins). The horizontal axis shows the integrated plasma radioactivity (nCi/gmin ± s.d.) at the end of the experiments. The Awake-Restrained group, the Epinephrine Group and the Hypovolemic Group showed similar values from both brain and tissue, as would be expected if loss of radiolabel from the brain was not affected by the experimental conditions. The Pentobarbital Group showed higher brain radioactivity levels and lower integrated plasma levels, suggesting that less radiolabeled solute had left the brain during the 120-min experiment than in the three previous groups. In contrast, the Adenosine Group had the lowest brain radioactivity concentration and the highest integrated plasma value, indicating that the radiolabeled solute had left the brains of this group more rapidly than any of the others. The sum [plasma arterial integral ± (brain radioactivity concentration × brain weight)] is shown as S ± s.d. for each group, indicating that recovered radioactivity did not differ among the groups.
Discussion
The results of these experiments confirm that both the routes and rates at which solutes leave the ECS of the brain are more complex than their rates of entry, and furthermore that the rate of convective efflux varies with experimental conditions. Cserr et al (1981) stated that the total efflux from brain (keff) can be considered to be the sum of three parallel conductances: kp, for efflux across the BBB, kcsf, for efflux into cerebrospinal fluid (CSF), and kx, for as yet undefined pathways:
For consistency, the abbreviations defined by Cserr et al (1981) are used throughout this discussion, and the units of h−1 are generally used.
Diffusional Efflux
The rate of clearance by diffusive transport across the BBB (kp) is dependent on a solute's physicochemical properties. For passively distributed compounds the process is symmetrical, that is, blood-to-brain and brain-to-blood rates are equal, taking into account the size of brain ECS (Cserr et al, 1981):
where kp is the efflux rate constant and kp is the influx rate constant (both with units of reciprocal time), and 0.16 is the fractional weight of brain tissue occupied by extracellular fluid. The values of kp and kp can extend over an 8 log unit range, reflecting the importance of lipid:water solubility and molecular size in transcapillary diffusion (Fenstermacher and Rapoport, 1984).
Carrier-Mediated Efflux
Carrier-mediated efflux (represented by kx in equation (3)) has been studied extensively in recent years (Edwards, 2005; Graff and Pollack, 2004; Kusuhara and Sugiyama, 2004; Sun et al, 2003; de Boer et al, 2003). Transporters that move solutes from the ECF into the blood will have the net effect of increasing the rate of removal and decreasing the clearance half time, as shown by PAH and AZT in the present study (Table 1). However, even when a compound has an efflux transporter, the diffusional and convective components still contribute to total brain efflux. Data for diffusion, convection and efflux transporters are difficult to compare directly, since expressions for kp and kcsf often use volume-dependent terms, while expressions for kx use concentration-dependent terms. The three terms can be compared by using the efflux rate constant (or efflux half time), recognizing that solute concentration affects the value of kx. For PAH, the range of kx must lie between 0.65 h−1 (seen in our data with tracer PAH concentration and no inhibition) and 0.22 h−1 (seen in our data with tracer 14C-PAH concentration and maximum inhibition with either probenecid or cold PAH), but these two values will also include contributions from diffusion and convection. Since capillary permeability for passive distribution is symmetric, the value of kp can be estimated from equation (4), where k′p is the influx constant (0.012 mL/gh) and 0.16 mL/g represents the ECS of the brain (Cserr et al, 1981). The resulting value is the efflux rate constant due to simple diffusional permeability, that is, kp = 0.075 h−1. For the value of kcsf, which is independent of the physicochemical properties of PAH, we assumed a value of 0.3 h−1, which is the average of values in Table 1. The sum of these two values represents the combined efflux half time due to diffusion and convection (0.375 h−1). Since keff of PAH is between 0.22 and 0.65 h−1, the value of kx must lie between 0 and 0.275 h−1. In summary, PAH is a water-soluble compound in which convective clearance exceeds that from diffusion, and for which the percentage of PAH carried by efflux transporters will vary between B0% (when the ECF concentration of competitive inhibitors is high) and 42% (when the ECF concentration of PAH and competitive inhibitors is low) (Figure 4).
The presence of transporters at other sites and their effect on efflux should not be neglected. When transporters are present on cells in the brain, the net effect will be reduced clearance and an increase in the clearance half time. α-Aminoisobutyric acid and Ara-C were two such compounds in the present study. The lack of a transporter for AIB at the BBB and the existence of a transporter at the cell membrane increased the clearance half time to nearly 68 h. When compounds interact with extracellular elements and are either specifically or nonspecifically bound, such as the ODN in the present study, that too will increase the apparent clearance half time.
The role of the choroid plexus, which transported PAH at a much higher rate than brain capillaries (Figure 4), should be mentioned since it raises the possibility of transport from CSF into brain ECF. Generally, the CSF is viewed as a ‘sink’, that is, solutes will move from ECF into CSF, from which they enter the blood (Neuwelt, 2004). The relative inefficiency of CSF to ECF transport is illustrated by ventriculocisternal perfusion, in which ECF concentrations were approximately 5% of CSF concentrations less than 3 mm from the ventricular surface after 4 h (Blasberg, 1977), despite constant CSF concentrations. In summary, CSF is a fluid removal system of the brain and not an important source of solute influx.
Convective Efflux
Our studies on a wide range of water-soluble compounds indicated a more rapid convective-mediated efflux pathway from the brain than that reported by Cserr et al (1981). In general, for nontransported, nonmetabolized, water-soluble compounds, the range of efflux half times was between 1.2 and 3.3 h in our study (Table 1), considerably faster than those observed by Cserr et al (1981), which were in the range of 12 to 14 h. There have been remarkably few studies about convective-mediated efflux from the brain. However, Cserr et al (1977) themselves had previously published data regarding the clearance of 4kDa polyethylene glycol and 70kDa dextran, in which they reported a clearance half time of 4.75 h for the polyethylene glycol and 6.0 h for dextran. The investigators later indicated that the difference between the outcomes of the two sets of experiments had not been pursued (Cserr et al, 1981).
However, because we considered the observations of Cserr et al to be the ‘gold standard’ and because we assumed that the convective efflux rate was invariable, we re-examined our experimental methods. There were several technical differences between our experiments and those of Cserr et al, including rat strain, the use of different cannula systems, infusion rates and anesthetics. We used Sprague-Dawley rats, while Cserr et al (1981) used ‘albino rats from Charles River’; we do not know if this was a factor, but since Cserr et al used the same rat strain in their two different studies with differing results, we doubt that rat strain is important. Cserr et al (1981) implanted intracerebral cannulae 1 week before performing their experiments, ostensibly ‘to allow repair of the BBB’. They used 22Na as a marker for BBB injury and, although they had technical difficulties, concluded that ‘permeability of the BBB to sodium was normal’ (Cserr et al, 1981). However, sodium has relatively high permeability across the normal BBB and would be insensitive if small changes in permeability were caused by cannula insertion, and, rather than measuring BBB injury by changes in blood to brain movement, they used efflux experiments that measured both kp and kcsf. We had previously examined the time course of BBB disruption to water-soluble solutes after insertion of microdialysis catheters and cannulas into the brain (Groothuis et al, 1998). Insertion caused a modest injury to the BBB that was maximal at the catheter tip and that took 3 to 4 weeks to resolve (Groothuis et al, 1998). Even if one assumed that the BBB did recover during the week that Cserr et al allowed, they inserted a new cannula on the day of the experiment that extended 1 mm below the previously inserted guide cannula, thus causing a new injury to the BBB. Because cannula insertion causes only modest injury to the BBB that does not repair significantly within a week, we elected to inject the radiolabeled compounds directly into brain at the time of cannula insertion. We infused at a rate of 0.5 μL/min (total volume = 10 μL) through a 30-gauge needle, while Cserr et al infused at 0.1 μL/min (total volume = 0.5 μL) through a 26-gauge guide and a 33-gauge cannula. Chen et al (1999) and Morrison et al (1999) evaluated the variables associated with infusion into the striatum. They showed that rates of 0.5 μL/min and cannulae < 28 gauge were not associated with leakage, and that the preinfusion sealing time did not affect recovery.
Since the input function cannot be accurately measured in an individual experiment, perhaps the best way, at present, to determine delivery efficiency and/or loss is by measuring the percentage of infusate recovered in the brain after the completion of the infusion. Methods to measure recovery efficiency have varied considerably among different groups. Loss across an injured BBB, reflux along the injection tract, or variable amounts remaining in the injection apparatus will result in reduced recovery efficiency. A consistent recovery efficiency, once the infusion is stopped and the cannula removed, represents Ni in equation (1), that is, the starting point of the efflux process at t =0. Our recovery efficiency was 91%, compared with 94% to 102% by Cserr et al. They expressed their values as a ‘percent of the injected dose’; they did not provide details, but the values must have been calculated rather than measured, since the percentage values exceed 100% (Cserr et al, 1981). We accounted for 100% of the isotope: of the 9% that did not reach the brain in our experiments, we found that 8.2% remained in the syringe and needle, and < 1% had refluxed along the needle track. The recovery efficiency reported by Chen et al (1999) was in the range of 85% to 95% in different experimental conditions and, furthermore, recovery efficiency was not affected when infusion rates were between 0.1 and 0.5 μL/min, cannula size was less than 28 gauge, and was not affected by ‘preinfusion sealing time’. In experiments by Kakee et al, in which 14C-inulin and 3H-mannitol were injected into the Par2 region of the rat cerebrum, recovery efficiencies varied from 35% to 71% (Kakee et al, 1996). These low efficiencies are not explained by the infusion rate (0.2 to 1 μL/min) or infusion volume (0.2 to 2 μL), but may be explained by infusion into cerebral cortex rather than the striatum. These recovery values indicate that the fractional amount of isotope in brain at the end of the infusion was similar between Cserr's experiments and ours. It does not appear that type of cannula, infusion rate or allowing the BBB ‘to heal’ account for differences between our experimental results and those of Cserr et al (1981).
Lastly, we examined whether our results were affected by the persons performing the experiments or by methods of analysis. We included totally independent experiments by different individuals, as well as different methods of measuring local isotope concentration (brain homogenate versus QAR). Although there was some interexperiment variation in our experiments, it was not great, and in no instance did the half time from our experiments approximate that reported by Cserr et al (1981).
The only variable that remained was the type of anesthesia. We used continuous ketamine-xylazine for anesthesia in most experiments. Two experimental groups had inhalation anesthesia during the infusion and were allowed to awaken for the remainder of the experiment. Cserr et al (1981) used pentobarbital in their experiments, and we used pentobarbital in one group. We believe this played a major role in the experimental outcome. The differences between pentobarbital anesthesia and ketamine-xylazine anesthesia in our study are shown in Figure 5. The variability of efflux rates with different anesthetics is related to another issue about convection-mediated efflux: what is the source of the hydrostatic pressure that drives the convection? Cserr et al (1977) speculated that the source of the interstitial fluid was the ‘capillary-glial complex’. Segal (1993) thought that brain extracellular fluid was the result of ‘active secretion by the cells of the cerebral endothelium’. Most recently, Kimelberg (2004) thought that interstitial water was derived from transport across the blood vessels ‘plus endogenous water production’, which he estimated at 0.043 cm3/min per 1500 g brain (0.04 mL/g day) of metabolic water from oxygen. We speculated that one source of a pressure gradient might be the pulse pressure in the microvasculature of the brain, driven in turn by the normal cardiac cycle. We tested this hypothesis by manipulating blood pressure and pulse pressure. These results are summarized in Table 2. There was no relationship between blood pressure parameters and efflux rate.
Two groups, however, did differ in efflux rates: Adenosine and Pentobarbital. Both groups had similar pulse pressures and in both the mean blood pressure was reduced (Table 2). What factor might explain the increased efflux rate of sucrose in the Adenosine Group and the decreased efflux rate in the Pentobarbital Group (Table 2)? Although we do not know the answer to this question, both adenosine and pentobarbital can affect cerebral glucose metabolism, which suggests the possibility that glucose metabolism may be involved. Ketamine causes a variable response, but on the whole little net change in glucose utilization (Crosby et al, 1982; Davis et al, 1988; Eintrei et al, 1999; Saija et al, 1989); the efflux rates between ketamine-anesthetized rats and those with no anesthesia were similar (Table 2). In a normal conscious rat, glucose utilization varies between 50 and 150 mmol glucose per 100 g brain/min (Kennedy and Sokoloff, 1981). If, in aerobic metabolism, 1 mol of glucose is metabolized into 6 mol of water, then the daily volume of water production for these rates of glucose utilization in rat brain would be between 0.07 and 0.23 mL of water per gram of brain per day (compared to 0.04 mL/g day as calculated by Kimelberg (2004). Since the ECF space is approximately 0.15 mL/g, the daily water production by the aerobic metabolism of glucose represents 47% to 150% of the ECF water volume in the rat. Our experiments support a relationship between glucose utilization and efflux; that is, drugs that decreased glucose utilization decreased efflux and drugs that increased glucose utilization increased efflux. Barbiturates decrease glucose utilization (Otsuka et al, 1991; Theodore et al, 1986) in a dose-dependent fashion (Hodes et al, 1985). In addition, there is a relationship between brain temperature and glucose utilization such that both are decreased after barbiturate anesthesia (Kiyatin and Brown, 2005), suggesting that temperature may also play a role. Although the effect of intravenous adenosine is complex and probably involves the role of adenosine receptors both inside and outside the nervous system, as well as a precursor to adenine nucleotides, intravenously administered adenosine can cause increases in cerebral glucose consumption (Blood et al, 2003; Laborit and Bonifacj, 1984; McBean et al, 1989; Waaben et al, 1989). Our results support, but do not prove, a hypothesis that glucose metabolism may be a source of both water and pressure that drives the convection-mediated efflux process. Additional studies are needed to more thoroughly evaluate this relationship.
Relative Contributions of Diffusional, Convective and Carrier-Mediated Efflux
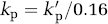
Cserr et al (1981) concluded: ‘Our results … emphasize the contribution of convective rather than diffusive losses from brain’, an observation that has not been widely appreciated. There are two aspects of convective efflux that are not so readily evident. The first is the relative contribution of diffusional efflux and convection-mediated efflux to total brain efflux. When solutes are lipid soluble (kp>100h−1), the principle pathway by which they will leave the brain is by simple diffusion across the BBB and the rate of total brain efflux will be essentially the same as efflux across the capillary because the contribution of convective efflux is so small. This is represented by the IAP in our studies (Table 1); it leaves by diffusional efflux at such a rapid rate that we could not measure keff. However, as water solubility increases, the fraction of solute that leaves the brain by convective pathways progressively increases, until it dominates the efflux process (Figure 6). Given the efflux constants reported in Table 1, when keff≈100h−1, the fraction cleared into CSF or undefined pathways is about 10%, and when keff⩽10−3h−1, >99% of the solute will be cleared into CSF by convective flow. Within a narrow range, for example, when keff is between 100 and 10−2h−1, both clearance processes contribute, as exemplified in our studies by urea. The efflux half time of urea was shorter than that of any other compound. Rapoport et al (1982) studied urea kinetics in and out of the brain in conscious animals; they reported a combined transcapillary and convective efflux constant of 0.00054 s−1 (= 1.94 h−1) and concluded that both efflux pathways were involved. Our efflux constants for urea (0.57 to 0.61 h−1) were lower than those of Rapoport et al; the reasons for the difference are not known, but may include some of the state-dependent effects discussed above.
Interaction between capillary efflux and convective removal of solutes from the brain. The horizontal axis shows the value of the influx constant (k′p) across brain capillaries with values ranging from 100 to 10−7mL/gmin, and the diffusional capillary efflux rate constant (kp), with values ranging from 60 to 6 × 10⁻⁶h−1. These two values are related by equation (4). Values to the left on this axis will represent more lipid-soluble solutes and values to the right will represent more water-soluble or larger solutes. The vertical axis on the left shows the fraction of total efflux that is due to diffusion, while the vertical axis on the right shows the fraction of total efflux due to convection. The solid curves represent values using the efflux constants reported in the current study, while the dotted curves represent values calculated using the efflux constants of Cserr et al (1981). In both, convection becomes more important as the values of the transfer constant (k′p) and capillary efflux constant (kp) decrease. The arrows between the two sets of curves represent the shift in the contribution of the convective component between our data and that of Cserr et al (1981).
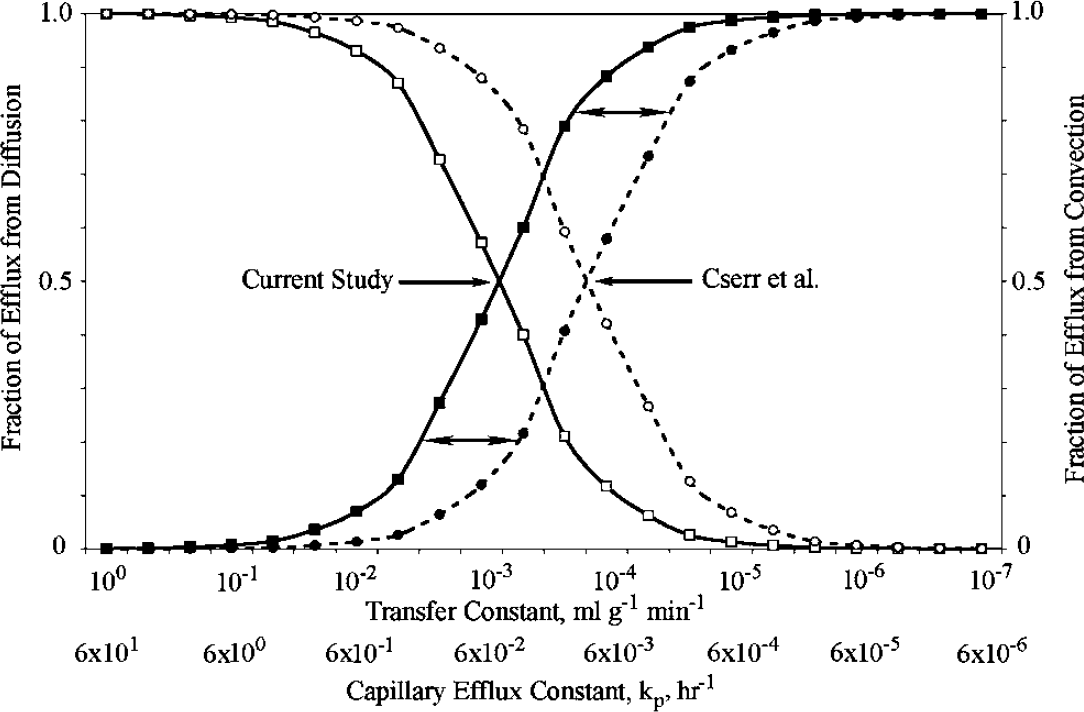
The other aspect of convective-mediated efflux that is not widely appreciated is that the efflux rate is largely independent of molecular size. When kp< 10−2h−1, convection-mediated removal dominates, as was seen with compounds ranging from 342 Da (sucrose) to 8.4 million Da (TMEV). It is surprising that TMEV, a picornavirus with a diameter of ∼30 nm (Rueckert, 1976), can move so freely in the brain ECF. However, supporting evidence for the unimpeded movement of TMEV is its distribution pattern (Figure 7), which was the same as that seen for sucrose and smaller compounds (Groothuis et al, 1999, 2000; Laske et al, 1997; Lieberman et al, 1995; Morrison et al, 1994): there was a central region in the caudate in which the TMEV is distributed as a result of bulk flow along the external capsule, representing more rapid distribution along oriented fiber pathways. Similar results were reported by Chen et al (2005), who found that viral size was less important in determining virion distribution after intracerebral infusion than the presence of surface characteristics.
Autoradiograph of 35S-labeled TMEV after intracerebral injection. The vertical arrow (
Since water is the solvent by which convective efflux operates, the roles of aquaporins may be significant in controlling the rates or pathways of this process. Although several aquaporin species are known to occur in brain (Amiry-Moghaddam et al, 2004; Badaut et al, 2001, 2002; Nico et al, 2001; Papadopoulos et al, 2004; Venero et al, 2001), the role of the aquaporins in the physiology of water movement in brain ECS is still unknown (Kimelberg, 2004).
One hurdle facing the study of brain efflux is that the methods to study it are limited. Fenstermacher et al (1981) listed two methods, the brain washout method and ventriculocisternal perfusion. The brain washout method, which depends on attaining a state of equilibrium between blood and brain ECF, is most appropriate for compounds with a relatively high rate of diffusion across the BBB (Figure 6). Ventriculocisternal perfusion, the other method mentioned by Fenstermacher, is very complicated and is unlikely to attain widespread use (Blasberg, 1977; Fenstermacher et al, 1970). The method of injecting solutes directly into the brain and measuring the rate at which they are cleared, introduced by Cserr et al (1981), has achieved more widespread use. There are technical problems associated with direct injection, including reflux along the injection path, the small injection volumes that must be used, and the lack of a method to independently confirm the input function (i.e., the amount injected). Many of these variables have now been studied and can be controlled (Chen et al, 1999; Groothuis et al, 1999; Morrison et al, 1999). At present, the method developed by Cserr et al (1981) appears to be the dominant method for measuring brain efflux.
Kakee et al (1996) have proposed a BEI as ‘a novel method of analyzing efflux transport at the BBB’ (Kusuhara et al, 2003). Brain Efflux Index experiments are conducted by simultaneously injecting a test compound and a reference compound (e.g., inulin). If the reference compound is ‘ideal’ and there is no loss of reference compound, the BEI results in a plot of the amount of test drug in the brain at time t divided by the amount of test drug injected, equivalent to plots used by other investigators (Blasberg et al, 1977; Cserr et al, 1981; Patlak and Fenstermacher, 1975), and can be used to calculate an efflux constant directly from the data for the test substance. As an experimental technique for calculating an efflux constant, however, the BEI method introduces a potential error. The reference compound in their studies was inulin (Kakee et al, 1997; Takasawa et al, 1997). Correcting the raw data by the inulin values assumes that inulin does not leave the brain, or at least leaves the brain at a much lower rate than the test drug. To illustrate the error inherent in the BEI method, we modeled the exact concentrations of test drugs and a reference compound in the brain for different efflux constants (k), using the expression
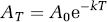
where A0 is the starting concentration, k is the efflux constant, T is the time and AT is the amount remaining in the brain at time T. The calculated amount for different test compounds was corrected with the calculated amount for inulin (assuming 100% recovery and using k = 0.3 h−1 = 0.005 min−1, Table 1). The BEI equations were used to calculate the BEI (Kakee et al, 1996; Kusuhara et al, 2003) and a plot of (100-BEI) values was then used to calculate the BEI efflux constant. A plot of actual efflux values (equation (5)) versus the BEI efflux constants is shown in Figure 8. When illustrated in this fashion, two limitations of the BEI method become evident. First, if the efflux constant of the test compound is less than that of inulin, the BEI assumes negative values and becomes undefined. Second, when the actual value of the test drug efflux constant is between 0.05 min−1 and that of inulin (0.005 min−1), the use of the BEI to calculate the efflux constant introduces a progressively increasing error (Figure 8). Since the data to calculate an efflux constant are contained within the experimental data obtained from BEI experiments, the advantage of the BEI method is not easily shown.
Relative error of the BEI method. The horizontal axis shows the actual efflux constant, modeled for compounds with values from 10 to 0.001 min−1. Calculated values of the efflux constant using the BEI method (kel) are shown as circles. As the actual efflux value of the test solute decreases and approaches that of inulin, shown here as 0.005 min−1, the calculated value (kel) increasingly underestimates the actual value. The solid line is the line of identity, which is where the BEI values would plot if the calculated BEI values were the same as the actual values. Next to each kel value is the error expressed in percentage terms.
In these studies, we have shown that solute efflux from brain is more complex than influx. When solutes are lipid soluble they leave the brain by simple diffusion across the BBB at a rate proportional to their lipid:water solubility. As solutes become more water soluble and larger, they leave at a fixed rate by convection regardless of their size. However, the rate of convective efflux may be variable and appears to be affected by the choice of anesthetic. Finally, when a solute has an efflux transporter, its efflux rate becomes the sum of the diffusional, convective and transporter-mediated components. However, many unanswered questions remain convection-mediated efflux. What is the source of the pressure gradient that drives the convective component? Is it due to active transport of water or glucose metabolism, or both? What is the role of aquaporins? As these issues become understood, it may be possible to manipulate the convective efflux component and either increase or decrease the residence time of drugs in the brain for therapeutic purposes. How does disease affect convective efflux? Brain tumors are known to have increased interstitial pressure that increases drug efflux (Vavra et al, 2004). Do diseases like Alzheimer's disease, which have decreased rates of glucose utilization, have decreased rates of convective efflux? It appears possible that a better understanding of the factors regulating drug efflux may provide a means of manipulating and regulating drug delivery to brain.