
Abstract
The threshold of cerebral blood flow (CBF) into infarction in rats has been indicated to be similar to that in patients. However, CBF does not reflect metabolic function, and so estimations of oxygen metabolism have been required. Here, we estimated changes in oxygen metabolism after occluding the right middle cerebral artery (MCA) in rats using an injectable 15O-O2 we developed. A decrease in CBF (left: 0.67±0.22 mL/min/g, right: 0.44±0.17 mL/min/g, P < 0.05) and compensatory increase in the oxygen extraction fraction (OEF) (left: 0.42±0.13, right: 0.50±0.19, P < 0.05) were observed at 1-h after occlusion. In contrast, a marked decrease in CBF and the cerebral metabolic rate for oxygen and a collapse of the compensatory OEF mechanism were found at 24 h after occlusion. Injectable 15O-O2 could be used to reliably estimate oxygen metabolism in an infarction rat model with positron emission tomography.
Introduction
Stroke is closely related to alterations in cerebral blood flow (CBF), the cerebral metabolic rate for oxygen (CMRO2), the oxygen extraction fraction (OEF), cerebral blood volume, and so on while some neurodegenerative disorders such as Alzheimer's disease and Parkinson's disease are also reported to induce a change in CBF (Derejko et al, 2001; Mori, 2002) because of tissue degradation. Therefore, estimation of these circulatory and metabolic parameters is important for both pathophysiological studies and the development or evaluation of new methods for treating stroke.
Studies on changes in parameters of cerebral circulation after the onset of stroke have been performed in several animal models (Belayev et al, 1997; Ginsberg, 2003; Heiss et al, 1997, 1994; Pappata et al, 1993; Takamatsu et al, 2000; Tenjin et al, 1992; Young et al, 1996; Zhao et al, 1997) and patients (Baron, 2001; Heiss et al, 2001). In the studies using larger animals, CBF, OEF and CMRO2were estimated after the onset of ischemia by positron emission tomography (PET) with 15O-H2O and 15O-O2 gas and used as predictors for the progression of brain infarction. These reports indicated that areas showing a decrease in CBF and compensatory increase in OEF in the early phase of stroke were vital several hours after the onset. Also, in studies with rats as an animal model of ischemia, CBF was certainly indicated to be a good predictor for infarction in comparison with the results for patients (Belayev etal, 1997; Ginsberg, 2003; Zhao et al, 1997). However, CBF does not reflect cell energy metabolism and so measurements of oxygen metabolism are required to accurately estimate tissue viability. Additionally, since that there are functional differences between rodents and humans (Walovitch et al, 1994), careful evaluation is needed when using rats to investigate the pathophysiology and progression of human stroke. On these bases, we adopted MCA occluded rats, widely used ischemia model (Kuge et al, 1995; Longa et al, 1989; Minematsu et al, 1992), and evaluated the changes in CBF, OEF and CMRO2 after the onset of stroke with PET.
On the other hand we recently developed a method of measuring regional OEF in the rat brain noninvasively using PET (Magata et al, 2003). Here, we designed experiments to estimate CBF, OEF and CMRO2 by PET in the early and late phases of a permanent ischemia in rats.
Materials and methods
Animals
Male Sprague—Dawley rats (250 to 310 g) supplied by Japan SLC Co. (Hamamatsu, Japan) were housed for 1 week under a 12-h light/12-h dark cycle and given free access to food and water. The animal experiments in this study were conducted in accordance with institutional guidelines and approved by the Kyoto University Animal Care Committee.
Preparation of 15O-Labeled Compounds
The production of 15O-H2O and injection of 15O-oxygen (injectable 15O-O2) were conducted as reported previously (Magata et al, 2003). Briefly, 15O-H2O was synthesized by the reduction of 15O-O2 with H2 gas (catalyzed by Pd black at 140°C) and trapped in a saline solution. As for injectable 15O-O2, part of an infusion line kit (Terumo Corporation, Tokyo, Japan) used as a blood reservoir and an artificial lung 18 cm in length (Senko Medical Instrument Mfg Co. Ltd, Tokyo, Japan) designed for small animals such as rats were connected to a peristaltic pump (EYELA roller pump RP-1000, Tokyo Rikakikai Co. Ltd, Tokyo, Japan) to make a closed system. Then, 18 to 20 mL of blood was collected from several rats and filtered with saline-wetted gauze. The blood was circulated (100 mL/ min) in the system and 15O-O2 gas (4100 to 5100 MBq/min/ 500 ml) was introduced into the artificial lung to prepare injectable 15O-O2 (51 to 90 MBq/ml).
Animal Preparation
Rats were divided into two groups. One was for the early phase PET experiment (n = 7, 1 h after the onset of occlusion) and the other was for the late phase experiment (n = 6, 24 h after the onset of occlusion). The rats were starved for 6 h before the operation and anesthetized with chloral hydrate (i.p. 400 mg/kg). For the early phase group, anesthesia was sustained throughout the experiment. The left femoral artery in each rat was catheterized using a PE 20 catheter (i.d. 0.5 mm, o.d. 0.8 mm) for blood sampling during PET study. Then, the right middle cerebral artery (MCA) was occluded intraluminally using a nylon 4-0 monofilament (Kuge et al, 1995; Longa et al, 1989; Minematsu et al, 1992). For the late phase group, each rat was aroused from anesthesia after the right MCA occlusion and then anesthetized for the catheterization of the left femoral artery and PET experiments. After the completion of the operation, rats were administered i.v. with 100IU of heparin. The animal was placed supine in a stereotaxic apparatus, and its head was restrained by mouth and ear bars. After the acquisition of a blank scan for 180 mins, the apparatus was placed in a PET camera (SHR-7700L, Hamamatsu Photonics, Hamamatsu, Japan) (Watanabe et al, 1997). The position was standardized with the aid of a laser beam, and the desired cranial position in the camera was oriented. Rectal temperature was maintained at around 37 °C with the aid of heating pads and blood gases were measured using a blood gas analyzer (Rapidlab 348, Chiron Diagnostics Ltd, Essex, England) several times during the experiment. After the PET experiments, 2,3,5-triphenyltetrazolium chloride (TTC) staining was performed in some cases for evaluating the progression of stroke.
Positron Emission Tomography Experiments
A transmission scan was performed for 30 mins for attenuation correction following the blank scan. Then, a dynamic PET scan was performed using 15O-H2O (i.v., 148 to 185 MBq) to measure CBF values 1h or 24 h after the initiation of MCA occlusion. A second PET scan was performed with the administration of injectable 15O-O2 (i.v., 74 to 148 MBq) over a 60-secs period to measure OEF values after the radioactivity of 15O-H2O had decayed in the body. In both cases, the total scan acquisition period was 120secs and the scan consisted of 12 × 10-second frames. Arterial blood sampling was performed continuously throughout the PET scans and blood centrifugation was also performed for measuring the plasma concentration of 15O radioactivity. The radioactivity of each sample was measured with an Nal well scintillation counter (Packard AutoGamma 500, Packard Instruments, Meriden, CT, USA) calibrated using a 22Na standard radioactive source.
Data Analysis
Positron emission tomography images were obtained as described previously (Magata et al, 2003). The rat brain was visualized in four consecutive coronal slices. Then, two regions of interest (ROIs) in each slice, right and left hemispheres, were visually chosen according to the magnetic resonance images obtained previously in the another study using 1.5T MRI. Activity in ROIs was calibrated using a cross calibration factor calculated in another phantom study with a 10-cm-diameter hollow phantom.
The CBF value in each ROI was calculated by numerically solving the equation (1) as reported previously (Temma et al, 2004).
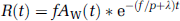
where the asterisk denotes the convolution integral and other marks are the tissue concentration of 15O radioactivity (R(t)), a typical example of that in the late phase experiment is presented in Figure 1, CBF (f), the arterial concentration of 15O-water radioactivity (AW(t), partition coefficient of water between the brain and blood (P = 0.8) and physical decay constant of 15O(Λ).
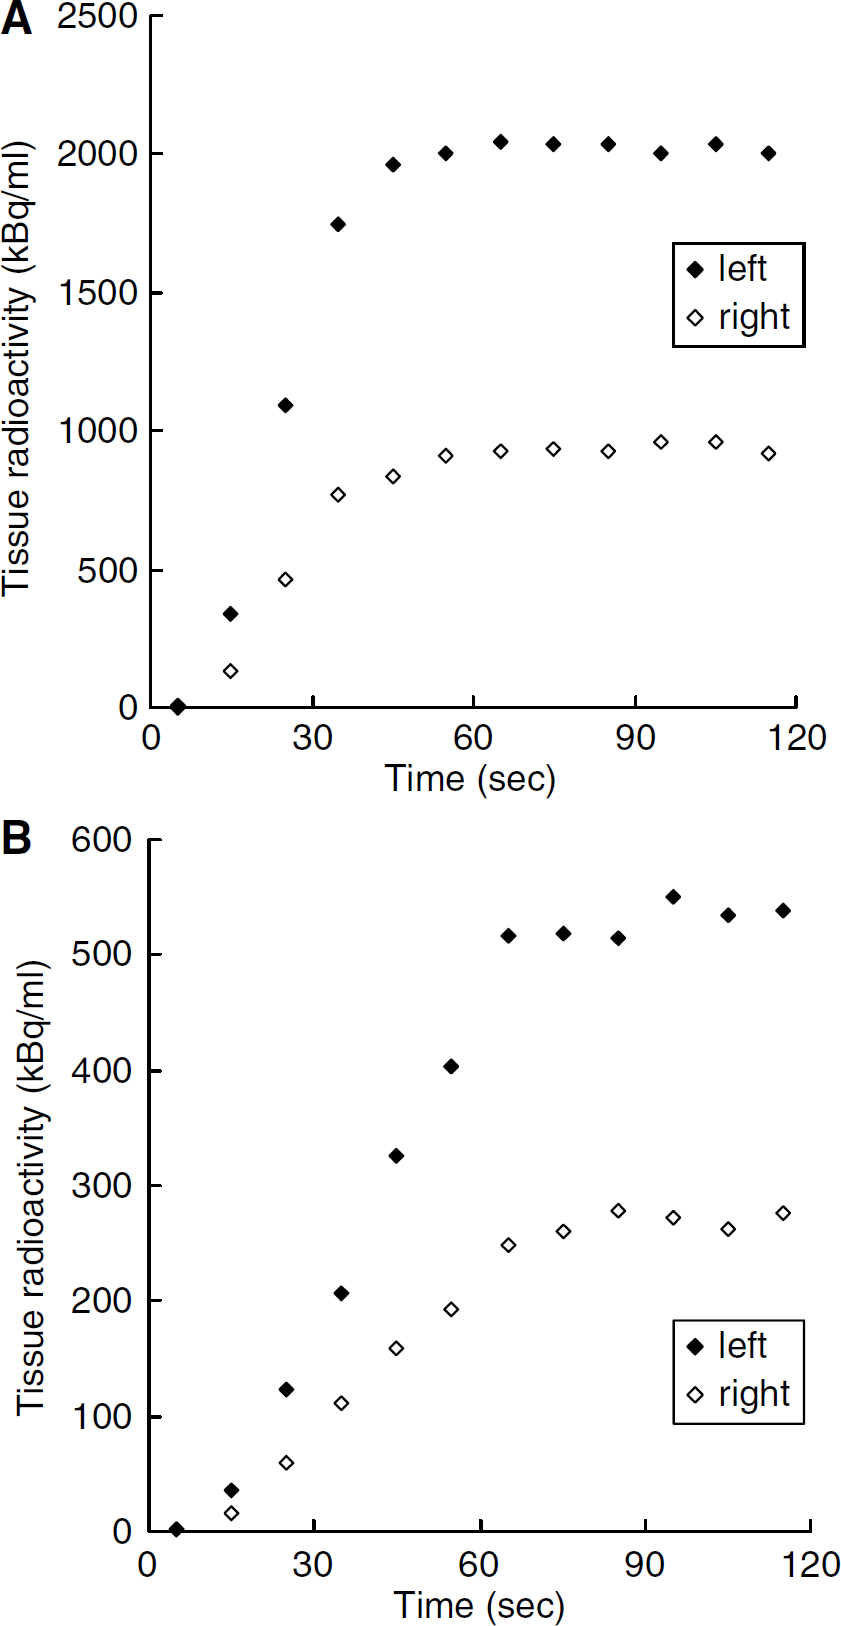
Typical curves of 15O radioactivity obtained by the PET scanning using (
Then, the OEF value was calculated using the same equation (Eq. 2) as that applied to the bolus inhalation of 15O-O2 gas method (Mintun et al, 1984; Shidahara et al, 2002), which could be used with this pharmaceutical as shown previously (Magata et al, 2003)
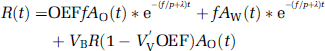
where the arterial concentration of 15O-O2 radioactivity (AO(t)), cerebral blood volume (VB = 0.04 mL/g), the hematocrit ratio between central and peripheral regions (R = 0.85) and the effective venous ratio in the brain (Vʼv = 0.835) are used.
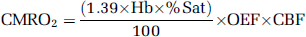
The CMRO2 value was calculated using equation (3). In this equation, Hb is gram hemoglobin/mL blood and %Sat is percent saturation of O2 (Shidahara et al, 2002).
Results
Injectable 15O-O2 Labeling
The shape of an artificial lung was modified to increase 15O labeling efficiency. Namely, the artificial lung used was three times longer (18 cm) than the previous version while the density of plastic fibers and diameter of the lung were unchanged (Magata et al, 2003). In this system, 90 MBq/ml was obtained at maximum.
Physiological Parameters
Blood gases were analyzed several times during the experiment (Table 1). Although several parameters were significantly changed, these changes were slight and levels were not in the abnormal range.
Arterial blood gas values before and after PET experiments in MCA occlusion
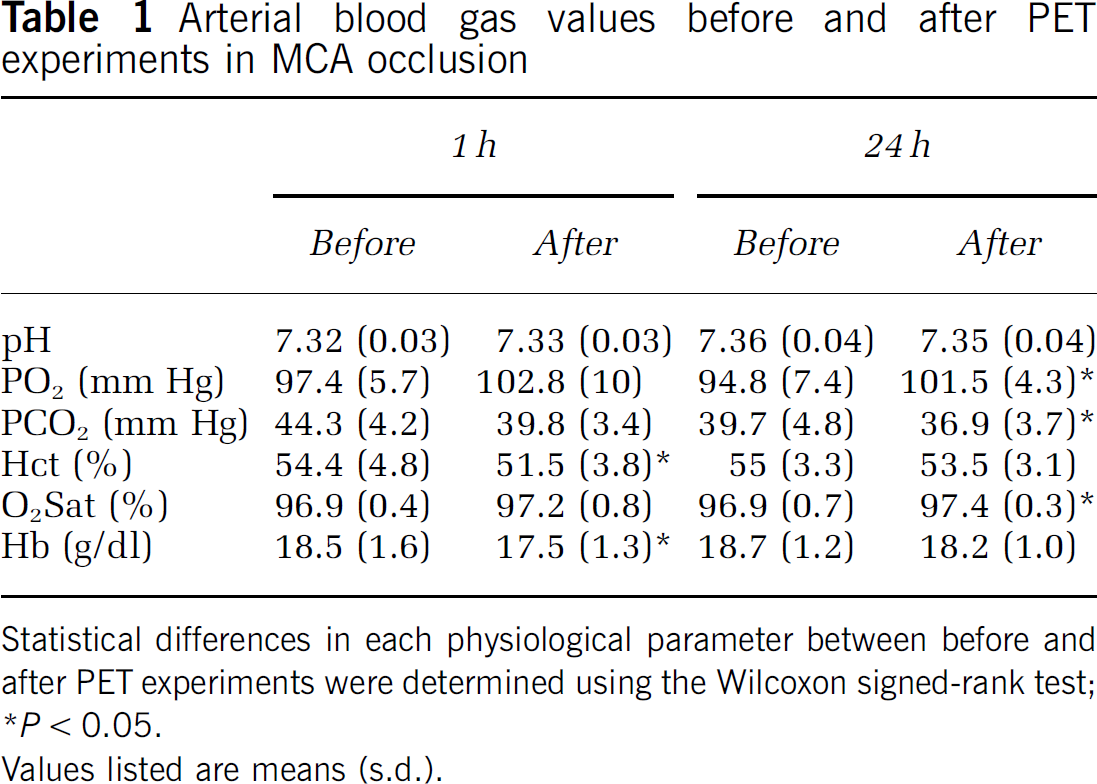
Statistical differences in each physiological parameter between before and after PET experiments were determined using the Wilcoxon signed-rank test
P < 0.05.
Values listed are means (s.d.).
Studies at 1 h After Onset
The relationships between CBF, OEF and CMRO2 at 1 h after the occlusion are shown in scatter diagrams (Figures 2 and 3). As revealed in Figure 2, in the right hemisphere, a decrease in CBF and compensatory increase in OEF were indicated in comparison with the opposite side, inducing a good reciprocal relationship as a whole. Also, the decrease in CBF in the right hemisphere was not so marked. Figure 3 shows the relationship between CBF and CMRO2.
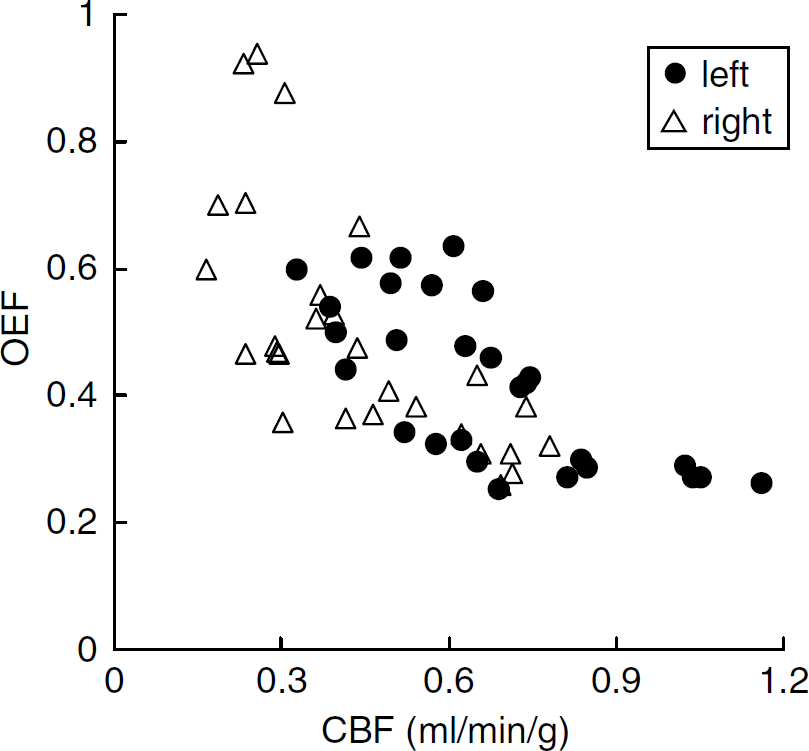
Scatter diagram of CBF (mL/min/g) and OEF values 1 h after the onset of MCA occlusion.
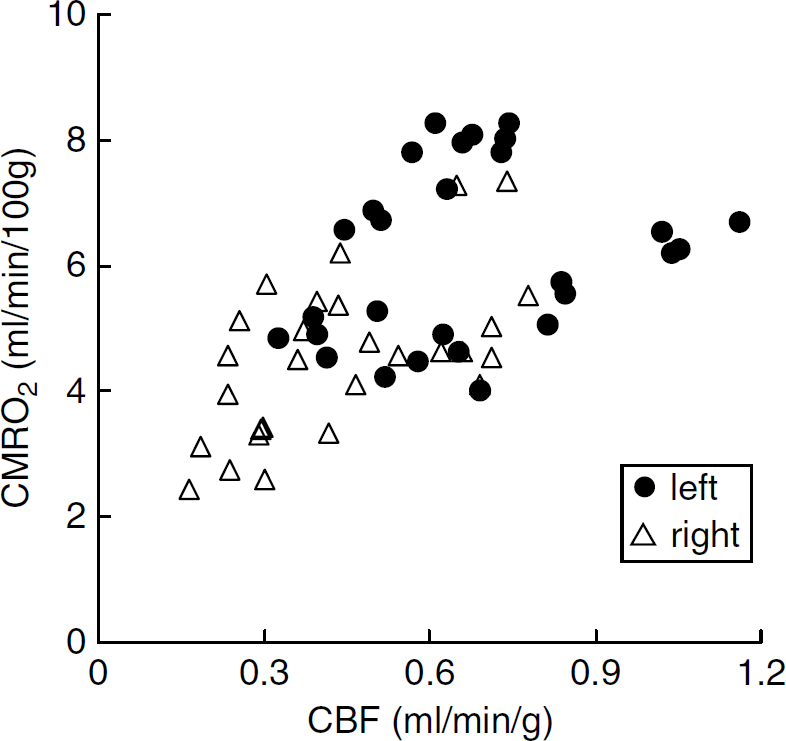
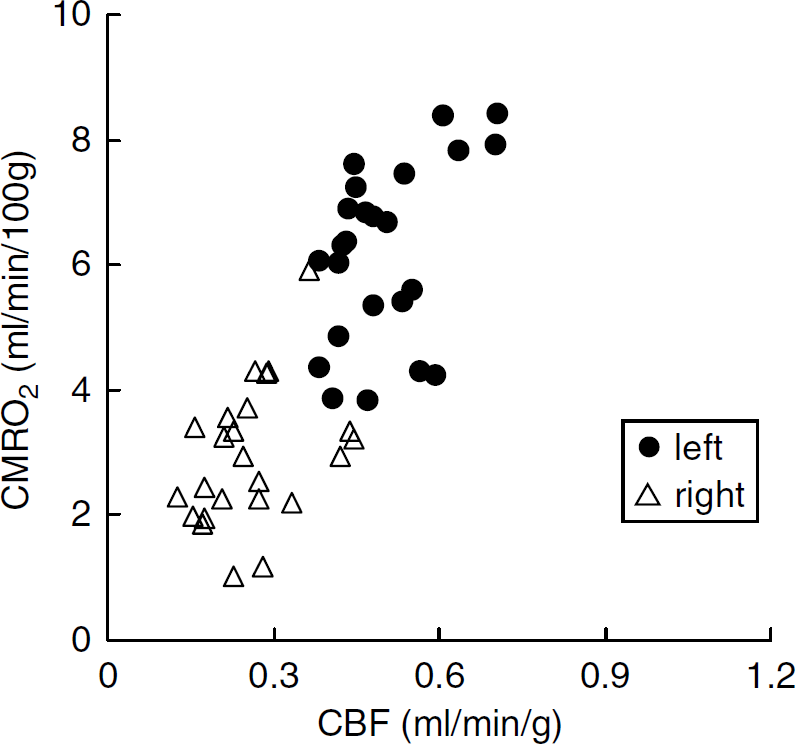
Scatter diagram of CBF (mL/min/g) and CMRO2 (mL/ min/100g) values 1 h after the onset of MCA occlusion.
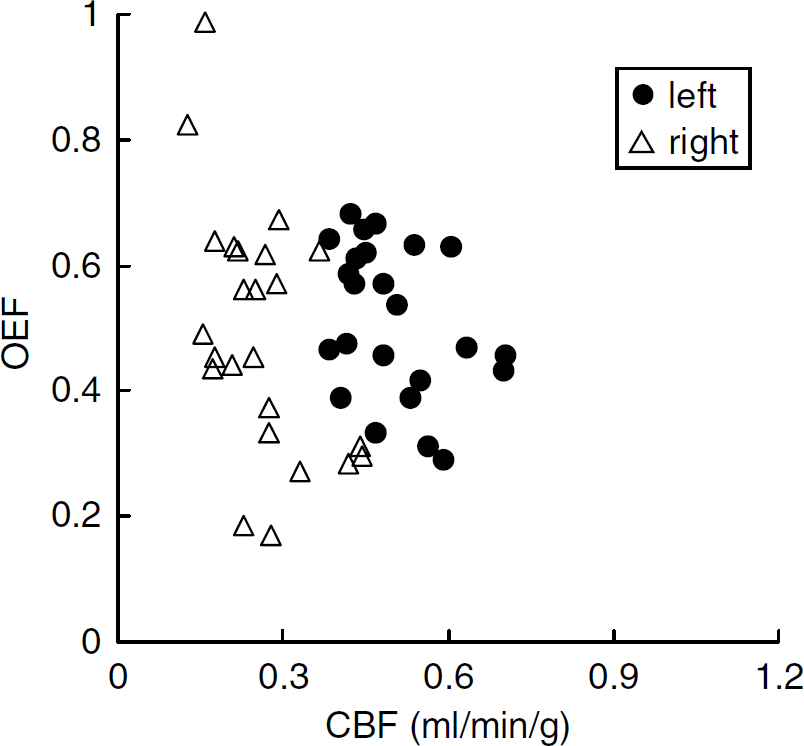
Scatter diagram of CBF (mL/min/g) and OEF values 24 h after the onset of MCA occlusion.
Scatter diagram of CBF (mL/min/g) and CMRO2 (mL/min/100g) values 24 h after the onset of MCA occlusion.
These two values also exhibit a good correlation, in which the decrease in CMRO2 in the right hemisphere was not so marked.
Studies at 24 h After Onset
The relationships among parameters at 24 h after the occlusion are shown in scatter diagrams (Figures 4 and 5). As shown in Figure 4, in the right hemisphere, the decrease in CBF was more pronounced than at 1 h (Figure 2) and there was no compensatory increase in OEF, resulting in a loss of the good correlation between CBF and OEF. Figure 5 shows the relationship between CBF and CMRO2. The right hemisphere exhibited a marked decrease in CMRO2.
Quantitative Values of Cerebral Blood Flow, Oxygen Extraction Fraction and Cerebral Metabolic Rate for Oxygen
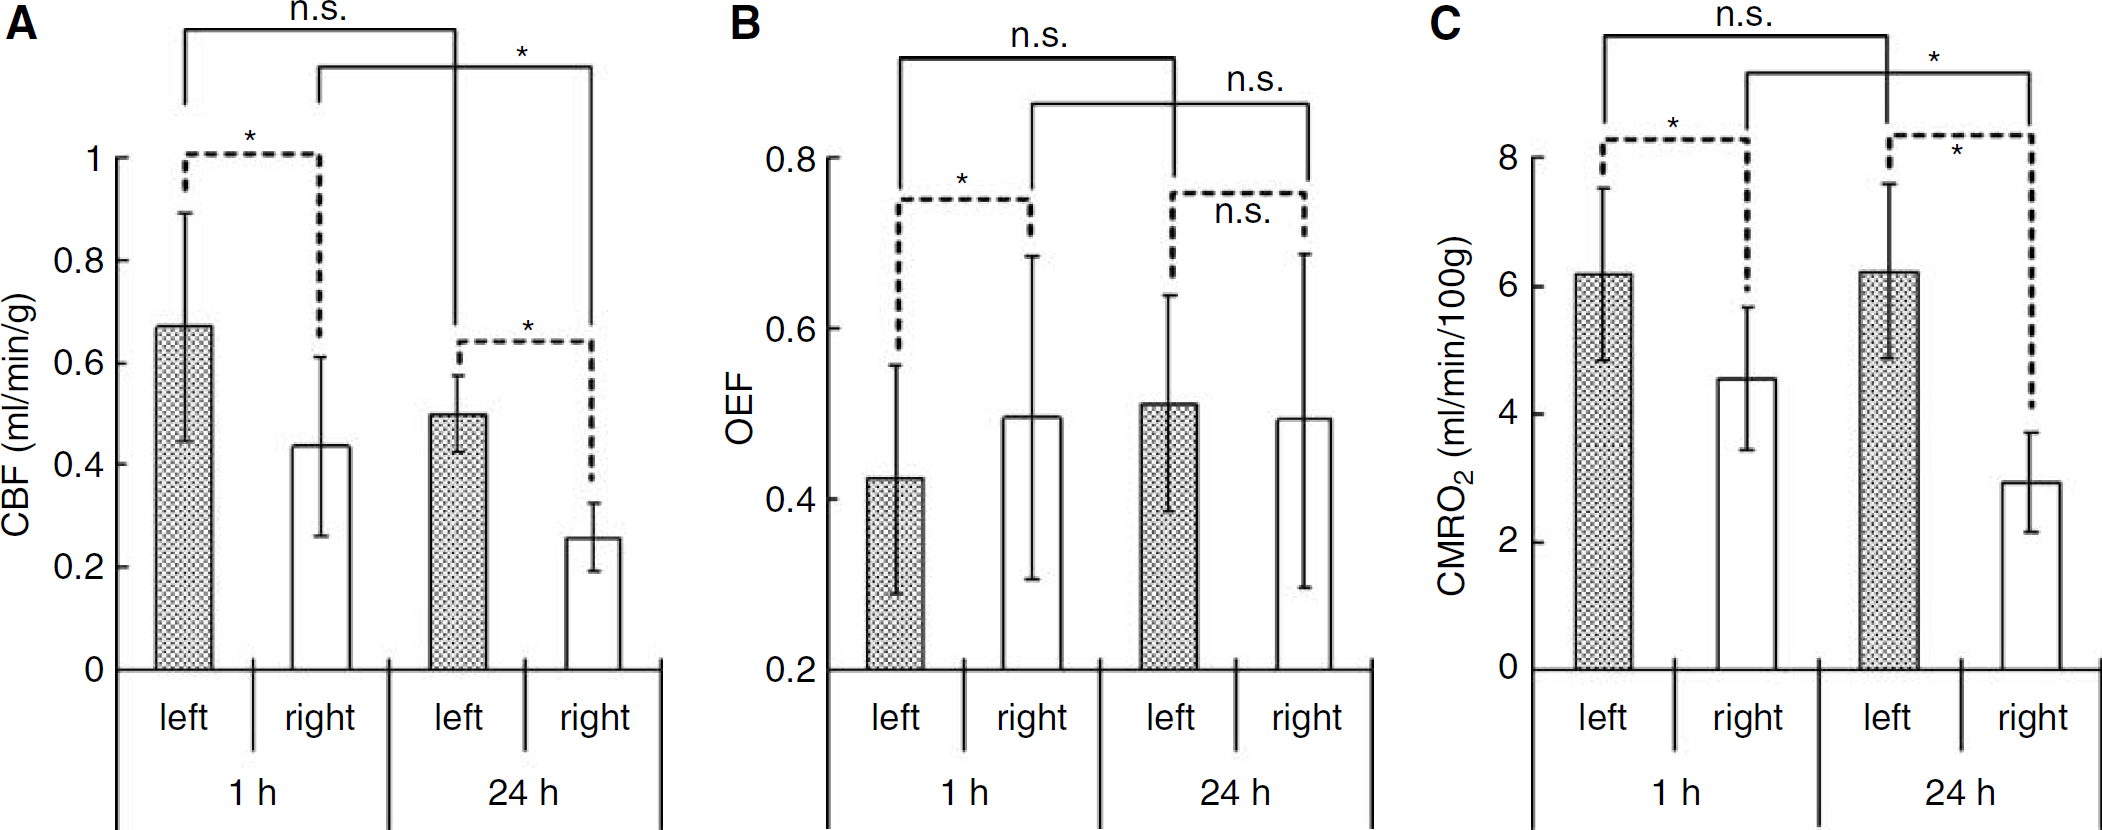
Figure 6 and Table 2 show the averaged hemispheric values of CBF, OEF and CMRO2 at 1 h (n = 7) and 24 h (n = 6) after the onset of MCA occlusion. In the right hemisphere at 1 h, the decrease in CBF was not so marked (0.44±0.17 mL/min/g; P < 0.05 compared with the left side) and a compensatory increase in OEF (0.50±0.19; P < 0.05 compared with the left side) was observed, inducing a slight decrease in CMRO2 (4.5±1.1 mL/min/100g; P < 0.05 compared with the left side). In contrast, at 24h, there was a marked decrease in CBF (0.26±0.07 mL/min/g, P < 0.05 compared with both the left side and at 1 h) and no compensatory increase in OEF (0.49±0.19; OEF in the left hemisphere was 0.51±0.12, not significant with each other), resulting in a large decrease in CMRO2 (2.9±0.8 mL/min/100g; P < 0.05 compared with both the left side and at 1 h).
The averaged hemispheric values of (
The averaged hemispheric values of CBF (mL/min/g), OEF and CMRO2 (mL/min/100g) obtained by PET 1 (n = 7) and 24 hours (n = 6) after the onset of MCA occlusion.
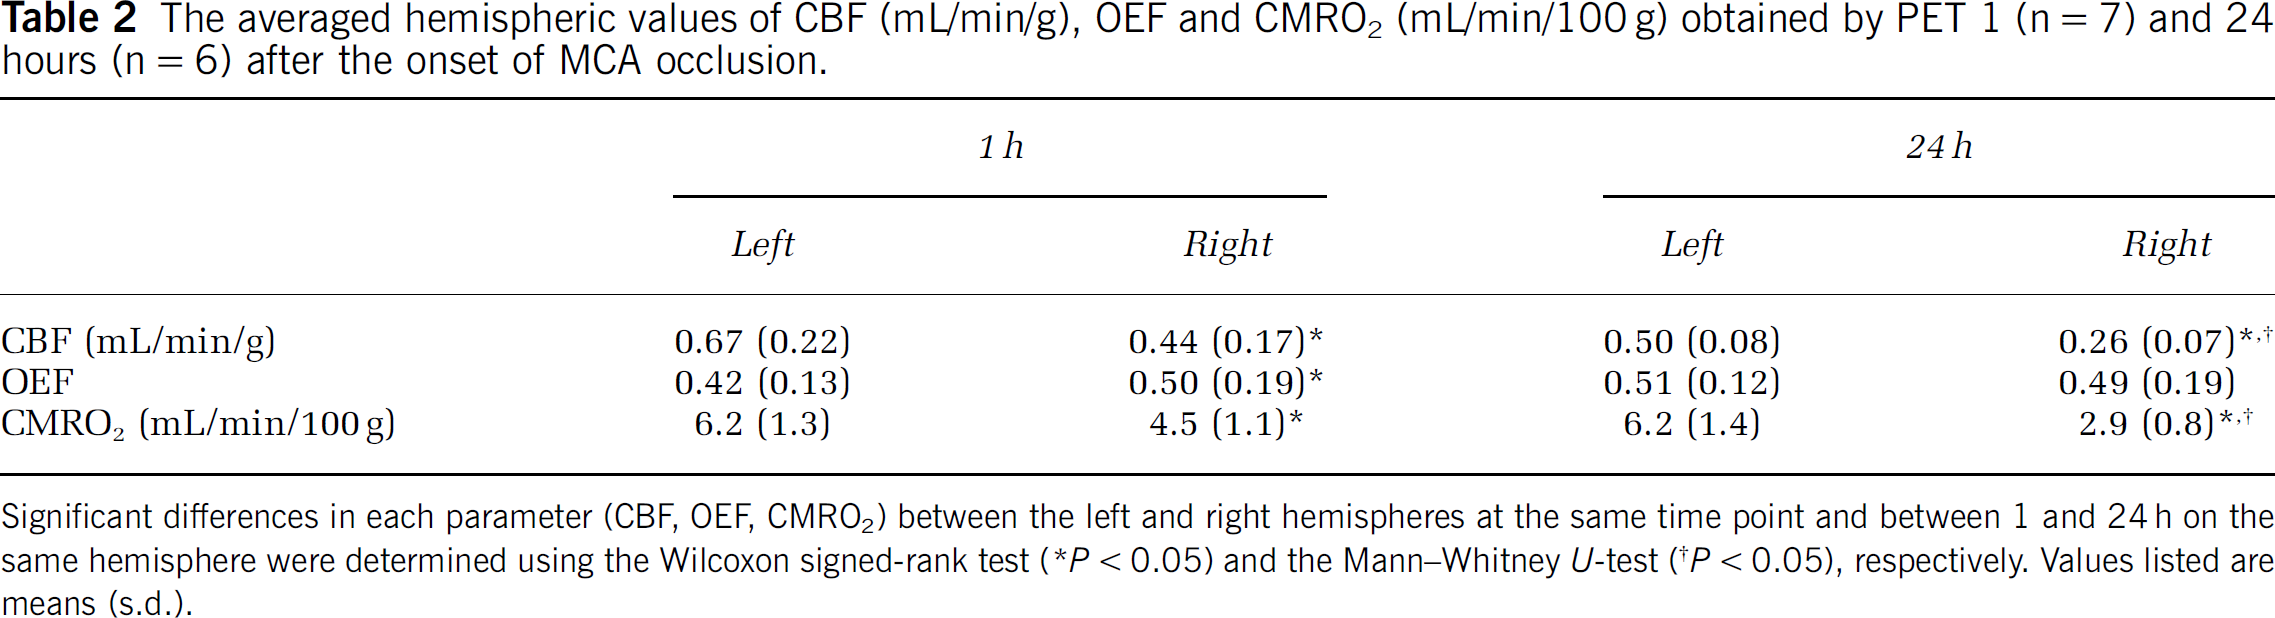
Significant differences in each parameter (CBF, OEF, CMRO2) between the left and right hemispheres at the same time point and between 1 and 24 h on the same hemisphere were determined using the Wilcoxon signed-rank test (*P < 0.05) and the Mann—Whitney U-test (†P < 0.05), respectively. Values listed are means (s.d.).
Discussion
In our previous report (Magata et al, 2003), up to 72 MBq/ml of injectable 15O-O2 was obtained with an artificial lung (6 cm length) and about 10 ml of blood. In the present study, the artificial lung was made three times longer to increase the labeling efficiency. First, we used three small artificial lungs connected in series to improve the labeling efficiency. In that system, more blood was needed for summation of the dead volume of each lung, and, the labeling efficiency, radioactivity per unit blood volume, did not increase. Since the total activity in the labeling system is constant if the radioactivity in the supplied gas is constant, highly specific activity of injectable 15O-O2 can be obtained when a small amount of blood is used. Therefore, the ʻlongʼ artificial lung can increase the specific activity of injectable 15O-O2 owing to the small dead volume. Actually, with this new artificial lung and 18.6 ml of blood, 90 MBq/ml of injectable 15O-O2 was obtained.
During the experiments, arterial blood gases were analyzed several times (Table 1). At both 1 and 24 h, significant changes were observed in two or three parameters. At 1 h, Hct and Hb decreased after the experiment, indicating slight hemolytic anemia. At 24 h, pO2, pCO2 and O2 Sat changed during the PET scans. These values, especially pCO2, are known to be closely related to the depth of anesthesia and so might reflect a change in the condition of the animal in PET studies. In any case, the changes of these parameters were not so marked and they might not affect the results of experiments.
At 1 h after the onset of MCA occlusion, CBF decreased slightly but significantly in the right hemisphere in comparison with the left side; some ROIs showed normal values and others showed low values (Figure 2). The OEF increased in ROIs with decreased CBF, but not in ROIs with normal CBF (Figure 2). The results indicate that the metabolic compensatory mechanism worked well at 1 h after MCAO. Cerebral metabolic rate for oxygen was also kept in the area of low CBF (Figure 3), and a good correlation between CBF and CMRO2 with a gentle slope was obtained (Figure 3), suggesting that the compensatory mechanism was working well at this time point.
At 24 h after the onset of MCA occlusion, while all ROIs in the right hemisphere showed severely decreased CBF with small variation, OEF showed a large variation (Figure 4). In the relationship between CBF and CMRO2, all ROIs in the right hemisphere showed severely decreased CMRO2 (Figure 5). These results indicated that the compensatory mechanism at 1 h after MCAO onset had collapsed at 24 h and the progression of ischemic injury was severer than at 1 h.
In Figure 6 and Table 2, quantitative values and standard deviations of CBF, OEF and CMRO2 are summarized. In the right hemisphere, CBF decreased slightly at 1 h and severely at 24h. Both values were significantly low compared with the opposite sides (P < 0.05) at both time points and the difference between the 24 h was also significant (P < 0.05). In the left hemisphere, CBF showed a little decrease but was not significant during 24 h (P = 0.0865). Since CMRO2 expressed exactly the same values at both time points, the decrease in CBF might not mean a metabolic dysfunction but a vascular disturbance at 24 h. Although blood vessels in the left hemisphere should not be affected directly in our MCAO operation, the progression of the ischemic damage in the right hemisphere included both the spreading of the ischemic core and the disturbance of surrounding blood vessels so that it is considered that the decrease in CBF on the opposite side could have occurred. Furthermore, CMRO2 in the left hemisphere was close to the value obtained previously in normal rats using 133Xe as a CBF tracer and a surgical method for determining OEF (6.3±0.3 mL/min/100g) (Kozniewska and Szczepanska-Sadowska, 1990). It underlined the preceding discussion that the brain tissue in the left hemisphere was not damaged at all during 24 h and the reason for the little decrease in CBF was vascular disturbance.
In the right hemisphere, CMRO2 decreased severely during 24 h in the same manner as CBF (Figure 6, Table 2). Since these values did not represent CMRO2 in the ischemic core but just values in the entire right hemisphere because of the large size of ROIs, it is difficult to discuss the progression of impairment. However, taken together with the decreases in CBF in both hemispheres during 24 h, the decrease in CMRO2 might not mean an ischemic core-specific progression of tissue disturbance but a spreading of the ischemic damage throughout the hemisphere. In fact, TTC staining revealed no sign of disturbance at 1 h but severe disruption at 24 h in the right hemisphere.
Meanwhile, an obvious change of OEF was also evident during 24 h (Figure 6, Table 2). The increase in OEF in the right hemisphere compared with the left side at 1 h after the onset of MCAO (P < 0.05) showed that the metabolic compensatory mechanism was working well. However, at 24 h, the OEF was the same in both hemispheres (P = 0.7532), which indicates that the compensatory mechanism did not function at 24 h after the onset. Therefore, considering that the condition in the left hemisphere at 1 h was actually normal or stage I in the course of the ischemic disorder (Nemoto et al, 2004; Powers, 1991), the right hemisphere at 1 h might include partly stage II and stage III (Figures 2 and 3; CBF was normal or decreased, OEF increased and CMRO2 was normal or slightly decreased), the left hemisphere at 24 h might be expressed at stage II (Figures 4 and 5; CBF decreased, OEF increased, CMRO2 was normal) and the right hemisphere at 24 h might include early and severe phases of stage III (Figures 4 and 5; CBF decreased, OEF increased or decreased and CMRO2 strikingly decreased).
Conclusion
In this paper, we estimated the changes in CBF, OEF and CMRO2 after the onset of MCA occlusion in rats by PET using injectable 15O-O2. In the early phase after occlusion, a decrease in CBF and compensatory increase in OEF were shown, and in contrast, CBF and CMRO2 were severely decreased in the late phase. This is the first report to indicate reliable oxygen metabolism in a MCAO rat model using PET.