
Abstract
Assays of mitochondrial electron transport system (ETS) activity in circulating blood platelets have been used to investigate the cause of neurodegenerative diseases. However, the correspondence between platelet ETS function and cerebral mitochondrial metabolism is not well characterized. To assess the validity of using platelet ETS activity to infer cerebral mitochondrial metabolism, we measured platelet ETS activity (complex I and complex I+III), cerebral metabolic rate of oxygen (CMRO2), and the CMRO2/cerebral metabolic rate for glucose ratio in 40 subjects: 7 with never-medicated Parkinson's disease, 13 with genetically proved Huntington's disease, and 20 normal controls. We found no correlation between in vivo measures of cerebral mitochondrial oxidative metabolism and ex vivo assays of platelet complex I and complex I+III activity performed on blood collected immediately before cerebral metabolism studies. We saw no evidence of a threshold effect when comparing platelet complex I and complex I+III activity with cerebral oxidative metabolism across a 4- to 10-fold range of platelet ETS activity. On the basis of these data, we conclude that measures of mitochondrial complex I and I+III activity in platelets within the ranges we have studied do not correlate with oxidative function of cerebral mitochondria.
Introduction
Assays of mitochondrial electron transport system (ETS) activity in circulating blood platelets from patients with Alzheimer's disease, Huntington's disease (HD), and Parkinson's disease (PD) have been used to investigate the cause of neurodegeneration in these conditions (Parker et al, 1990; Krige et al, 1992; Haas et al, 1995; Blake et al, 1997; Blandini et al, 1998; Cardoso et al, 2004). However, the correspondence between platelet ETS assays and cerebral mitochondrial metabolism is not well—characterized. Specific defects in cerebral mitochondrial ETS decrease the cerebral metabolic rate of oxygen (CMRO2) proportionately more than the cerebral metabolic rate for glucose (CMRglc) (fewer moles of oxygen consumed per mole of glucose metabolized), thereby producing a reduction in the CMRO2/CMRglc ratio below the normal value of 5.6 (Frackowiak et al, 1988; Shishido et al, 1996). This is in distinction to the situation during physiologic brain activation in which the CMRO2/CMRglc ratio is also below normal, but CMRO2 is not reduced (Dienel et al, 2002). Therefore, in vivo assessment of cerebral mitochondrial energy metabolism requires combined measurement of both CMRO2 and CMRglc. To assess the general validity of using platelet ETS activity to infer abnormalities in cerebral mitochondrial metabolism in neurodegenerative diseases as compared with normal controls, we compared platelet ETS activity (complex I and complex I + III) with CMRO2 and the CMRO2/CMRglc ratio in 40 subjects: 7 with never-medicated PD, 13 with genetically proved HD, and 20 normal controls.
Materials and methods
Subjects
Subjects for this report were selected from a larger study of mitochondrial ETS function in neurodegenerative diseases because they had blood for platelet ETS assays drawn immediately before positron emission tomography (PET) measurements of CMRO2 and CMRglc (Powers et al, 2007a, b , 2008). Inclusion and exclusion criteria for PD, HD, and normal controls have been published previously (Powers et al, 2007a, b , 2008). None of the subjects were taking medications that interfered with mitochondrial function.
In Vitro Measurements of Platelet Electron Transport System Complex Activity
In all, 100 ml of blood anticoagulated with sodium citrate solution was collected immediately before PET and shipped to UCSD (University of California, San Diego) Mitochondrial Disease Laboratory for analysis. Samples were labeled only with coded numbers. The identification of individual subjects and their diagnoses remained at Washington University and was not available to the investigators at UCSD.
Complex I and citrate synthase activities were measured using established techniques (Haas et al, 1995; Shults et al, 1997). Complex I + III activity was measured as rotenone-sensitive NADH cytochrome c reductase activity. Citrate synthase activity measurements were used to calculate values normalized for any differences in mitochondrial mass.
Image Acquisition
High-resolution T1-weighted magnetic resonance (MR) images were acquired using a Siemens Magnetom SONATA 1.5-T scanner (Siemens Medical Solutions USA Inc., Malvern, PA, USA). A mid-sagittal scout spin-echo sequence was used to position the subject, and then a three-dimensional MPRAGE sequence was acquired (repetition time/echo time/inversion time (TI) = 1,900/3.93/1,100 milliseconds, FA = 8°, 7:07 minutes, 128 × 256 × 256 matrix 1.25 × 1 × 1 mm3 voxels).
Positron emission tomography images were obtained in the two-dimension acquisition mode using a Siemens/CTI ECAT EXACT HR 47 PET scanner (Siemens Medical Solutions USA Inc., Knoxville, TN, USA) with participants lying supine in a quiet dark room. Cerebral blood flow, cerebral blood volume, CMRO2, and oxygen extraction fraction were measured as described previously (Raichle et al, 1983; Mintun et al, 1984; Martin et al, 1987; Powers et al, 2007b). Dynamic emission PET scans were obtained after slow intravenous injection over 10 to 20 seconds of 10 mCi of 18F-fluorodeoxyglucose (18FDG) for measurement of CMRglc (Powers et al, 2007b). All PET emission scans were reconstructed with filtered back projection using individual attenuation measurements and scatter correction with a ramp filter cutoff at the Nyquist frequency, producing images with a resolution of 4.3 mm full-width at half maximum.
Image Analysis
The 1.5-T MR image was segmented into the brain and cerebrospinal fluid based on voxel intensities. Manual editing was required to remove the external tissue in which there was insufficient cerebrospinal fluid to separate the brain (near sinuses, temporal lobes, eyes, and brainstem), and a single erosion followed by conditional dilation completed the tissue segmentation. The MR image was then edited manually to generate a region of interest encompassing both cerebral hemispheres by removing the cerebellum and brainstem along a plane connecting the posterior commissure and the most inferior point of the interpeduncular fossa. For each participant, the striatum (bilateral caudate and putamen) region of interest was outlined on the MR image (Powers et al, 2007b).
The original segmented MR image plus the three 15O PET images were coregistered to a composite 40 to 60 minutes 18FDG PET image using Automated Image Registration software (AIR, Roger Woods, University of California, Los Angeles, CA, USA) (Woods et al, 1993). Mean counts corrected for partial volume effects owing to nonbrain structures including cerebrospinal fluid were generated for the bihemispheric regions of interest for each of the three 15O PET images and for the dynamic 18FDG PET images (Videen et al, 1999). Corrected mean counts were converted to quantitative cerebral blood flow, oxygen extraction fraction, or CMRO2 (Videen et al, 1987).
For measurement of bihemispheric and striatal CMRglc, a modified Marquardt parameter estimation routine was used to derive rate constants for each participant using partial volume-corrected dynamic 18FDG PET counts and arterial whole-blood time-radioactivity curves (Powers et al, 2007b). For this study, we calculated from our entire series of 23 normal control subjects, aged 26 to 70 years, a value for the lumped constant of 0.64 that yielded a mean bihemispheric value for CMRO2/CMRglc equal to the value of 5.6 that has been directly measured from arterial and jugular venous samples in normal adults, aged 21 to 69 years (Gottstein et al, 1963).
Statistical Analysis
Pearson's bivariate correlation coefficients were calculated using SPSS 16.0 for Windows (SPSS Inc., Chicago, IL, USA).
Informed Consent
This research received previous approval from the Washington University Human Studies Committee (Institutional Review Board). Written informed consent was obtained from each participant.
Results
Studies were performed in 40 subjects, aged 26 to 76 years: 7 with never-medicated PD, 13 with genetically proved HD, and 20 normal controls. There were 25 men and 15 women.
The range of measured values for platelet ETS was 4- to 10-fold, and that for cerebral metabolism was 2- to 3-fold (Table 1). There were no statistically significant correlations between platelet ETS activity and measures of hemispheric (Table 2, Figures 1 and 2) or striatal (data not shown, all P<0.22) cerebral mitochondrial oxidative metabolism (CMRO2/CMRglc or CMRO2). Correlations for the individual groups (PD, HD, and normal controls) were also not statistically significant (data not shown, all P<0.09).
Ranges of measured values
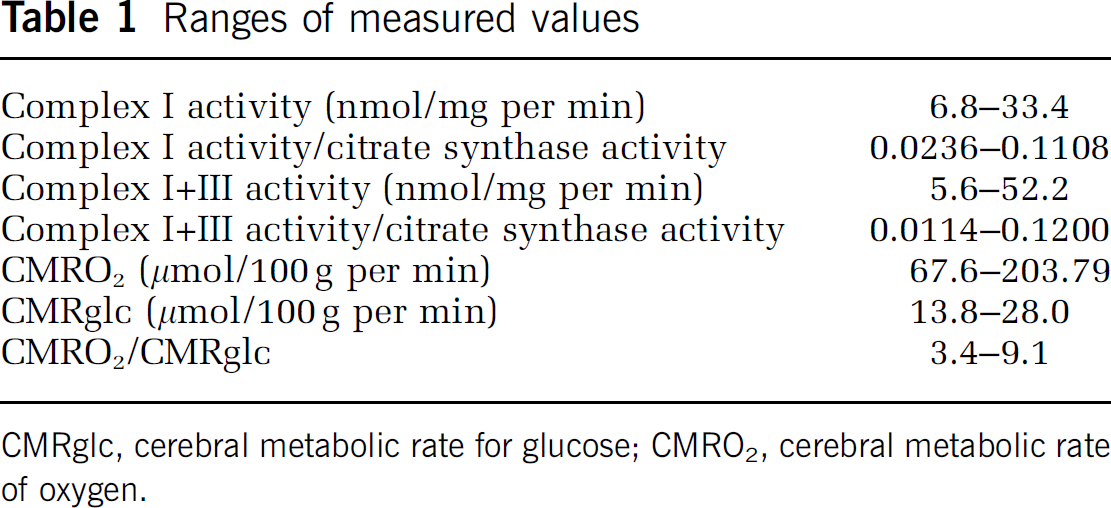
CMRglc, cerebral metabolic rate for glucose; CMRO2, cerebral metabolic rate of oxygen.
Correlation coefficients for platelet ETS activity and cerebral oxidative metabolism
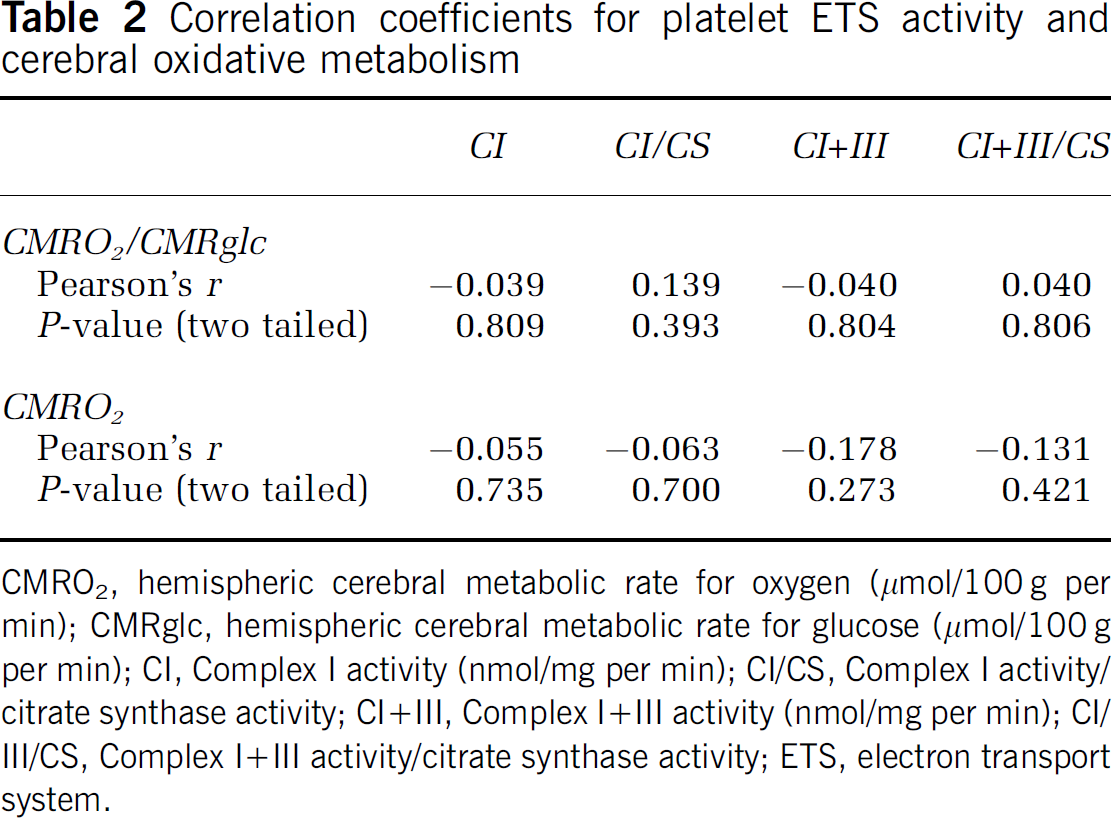
CMRO2, hemispheric cerebral metabolic rate for oxygen (μmol/100g per min); CMRglc, hemispheric cerebral metabolic rate for glucose (μmol/100g per min); CI, Complex I activity (nmol/mg per min); CI/CS, Complex I activity/ citrate synthase activity; CI+III, Complex I+III activity (nmol/mg per min); CI/III/CS, Complex I+III activity/citrate synthase activity; ETS, electron transport system.
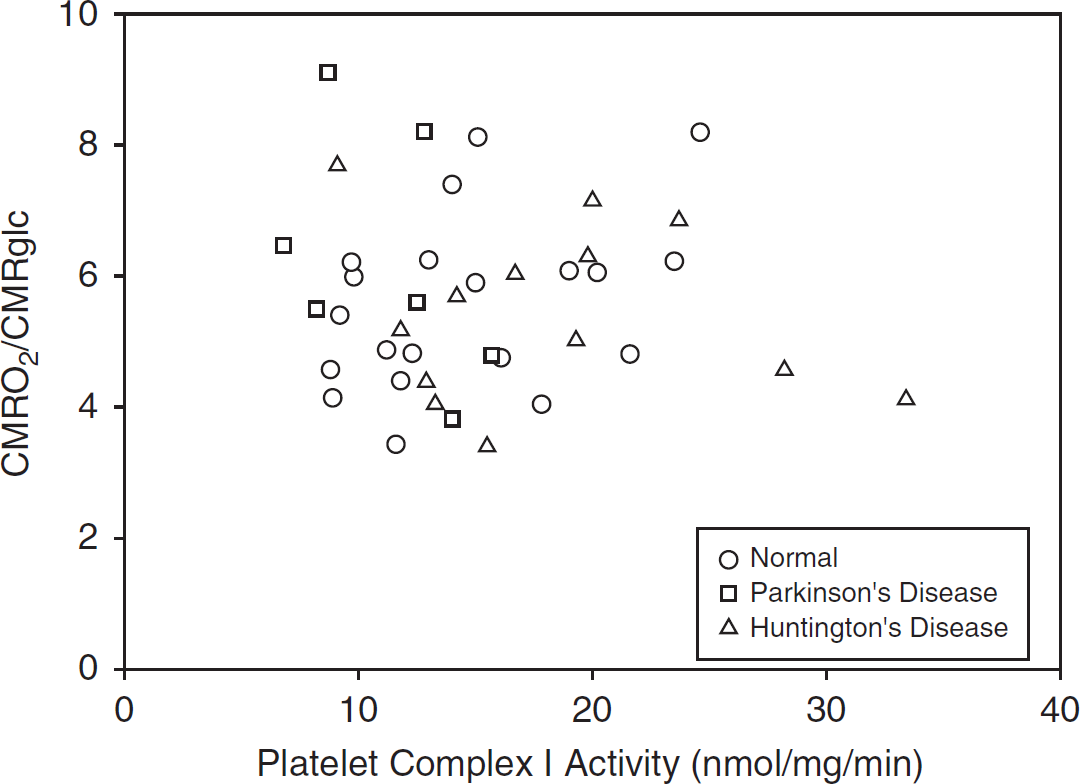
Relationship of platelet complex I activity to hemispheric cerebral mitochondrial metabolism.
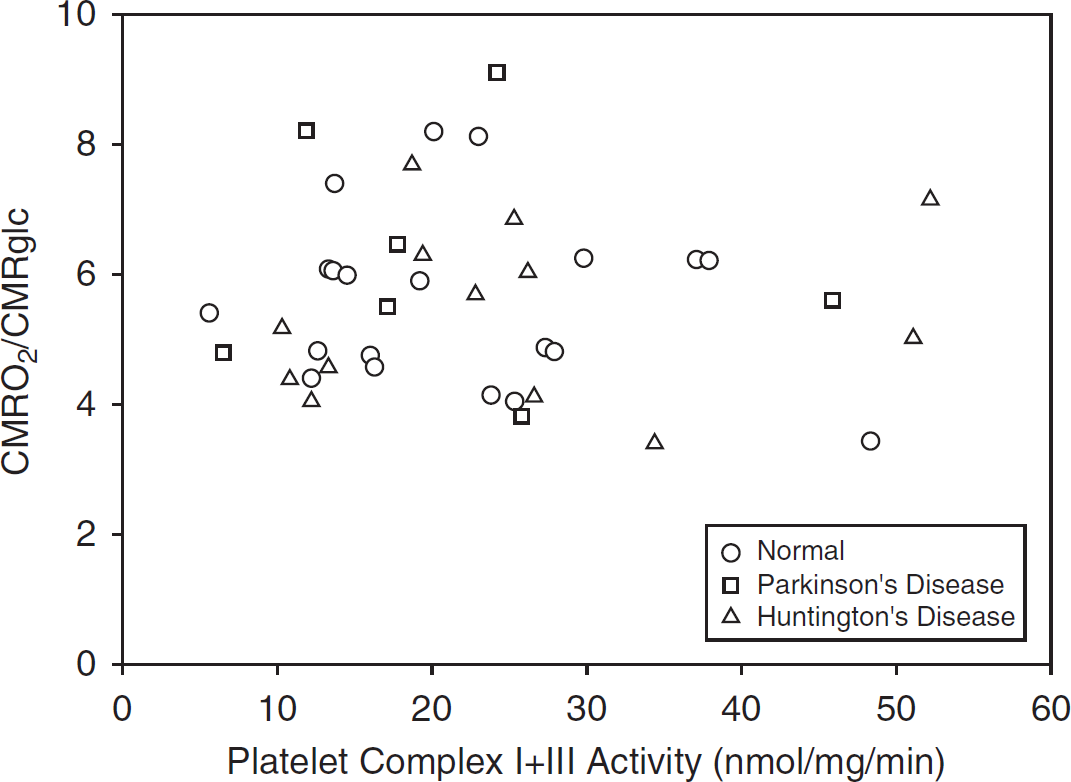
Relationship of platelet complex I + III activity to hemispheric cerebral mitochondrial metabolism.
Discussion
We used a method that corrects for artifactual reductions in PET measurements caused by partial volume effects from increases in ventricular and sulcal cerebrospinal fluid volume. It will thus produce accurate bihemispheric PET measurements in HD and PD. The CMRO2 method that we have used has been validated for quantitative accuracy in nonhuman primates across a wide range of CMRO2 (Mintun et al, 1984; Altman et al, 1991). Included in these validation studies were measurements during intraaortic sodium cyanide infusion, specifically showing the accuracy of this technique to accurately measure a reduction in CMRO2 under conditions of reduced mitochondrial ETS activity. In measuring CMRglc with 18FDG, we explicitly assumed that the lumped constant value is the same for HD and PD as it is for normal controls. In adults, the lumped constant has been shown to change appreciably only in tumors or under conditions when glucose delivery becomes rate limiting for glucose metabolism, e.g., during ischemia and hypoglycemia (Crane et al, 1981; Nakai et al, 1987; Suda et al, 1990; Spence et al, 1998). In our participants with HD and PD, neither ischemia nor hypoglycemia was present. Thus, our assumption that the lumped constant value is the same for HD as it is for normal controls is valid.
We found no correlation between in vivo PET measures of cerebral mitochondrial oxidative metabolism and ex vivo assays of platelet complex I and complex I + III activity performed on blood collected immediately before PET studies As with other components of the ETS, complexes I and III both show threshold effects, with changes in mitochondrial oxidative metabolism not occurring until complex activity is reduced by 25% to 60% (Pathak and Davey, 2008). We saw no evidence of such a threshold effect when comparing platelet complex I and complex I + III activity with cerebral oxidative metabolism across a 4- to 10-fold range of platelet ETS activity. On the basis of these data, we conclude that measures of mitochondrial complex I and I + III activity in platelets within the ranges we have studied do not correlate with oxidative function of cerebral mitochondria. Possible explanations for this lack of correlation include: (1) platelet ETS activity is not a good measure of brain ETS activity; (2) variations in ETS activity are all above the thresholds that result in reductions in oxygen metabolism; and (3) as platelet ETS assays measure maximum possible substrate metabolism, the oxidation rate of the resting brain is running substantially below the maximum capacity of complexes I and I + III and must be controlled by the activity of other ETS complexes or by other factors.
Footnotes
Acknowledgements
The authors thank Lennis Lich, John Hood, Susanne Fritsch, and the Washington University Cyclotron Staff for their assistance.
The authors declare no conflict of interest.