
Abstract
The glycolytic flux (cerebral metabolic rate of glucose CMRglc) and the TCA cycle flux (VTCA) were measured in the same monkeys by 18F-fluorodeoxyglucose (18F-FDG) positron emission tomography (PET) and 13C NMR spectroscopy, respectively. Registration of nuclear magnetic resonance (NMR) and PET data were used for comparison of CMRglc and VTCA in the exact same area of the brain. Both fluxes were in good agreement with literature values (CMRglc 0.23 ± 0.03 μmol/g min, VTCA = 0.53 ± 0.13 μmol/gmin). The resulting [CMRglc/VTCA] ratio was 0.46 ± 0.12 (n = 5, mean ± s.d.), not significantly different from the 0.5 expected when glucose is the sole fuel that is completely oxidized. Our results provide a cross-validation of both techniques. Comparison of CMRglc with VTCA is in agreement with a metabolic coupling between the TCA cycle and glycolysis under normal physiologic conditions.
Introduction
Energy synthesis in aerobic organisms relies on two major metabolic pathways: glycolysis and TCA cycle (Stryer, 1975). In the mammal brain, the degree to which both pathways are coupled remains controversial. Under physiologic resting conditions, it is generally accepted that glucose and oxygen consumptions are coupled (Siesjö, 1978; Baron et al, 1984). Glucose being the main fuel for brain energy synthesis under physiologic conditions, the assumption of a coupling between glucose and oxygen consumptions would result in a 1:2 ratio between glycolysis and TCA cycle fluxes (one glucose giving rise to two pyruvates). In contrast, the metabolic coupling is questioned, whether under pathologic conditions (Baron et al, 1984; Schurr et al, 1988) or during focal brain activation (Fox et al, 1988; Prichard et al, 1991; Sappey-Marinier et al, 1992; Fellows et al, 1993), because of either enhanced anaerobic glycolysis or substrates other than glucose being oxidized. The independent measurement of metabolic fluxes through the two pathways would present a major interest in this particular context.
Since the early 1990s, 13C NMR spectroscopy has proven to be a unique tool to quantitatively measure the rate of the brain TCA cycle (VTCA) (Mason et al, 1992; Gruetter et al, 2001; Chen et al, 2001; Chhina et al, 2001). This in vivo approach relies on intravenous infusion of glucose enriched with the nonradioactive 13C isotope. After transport of 13C-glucose through the blood—brain barrier, the 13C label is incorporated into glycolytic and TCA cycle intermediates through the same pathways as unlabeled glucose (Figure 1). VTCA is derived from the time course of 13C incorporation into glutamate. Quantitative measurement of VTCA relies on the unique property of nuclear magnetic resonance (NMR) spectroscopy to specifically identify the molecule and the atomic position in this molecule at which the isotopic label accumulates. This contrasts with nuclear techniques for which radioactivity is measured, independently of the metabolite to which the radioactive tracer is attached. The principle of VTCA measurement by NMR is otherwise analogous to the measurement of cerebral metabolic rate of glucose (CMRglc) based on 18F-fluorodeoxyglucose (18F-FDG) detection by positron emission tomography (PET). For the PET measurement, 18F-FDG, a radioactive analog of glucose, is injected intravenously. Contrary to glucose, FDG is not metabolized any further after phosphorylation, leading to 18F accumulation in the brain pools of 18F-FDG and 18F-FDG-6-P (Figure 1). Because PET cannot identify the molecules in which 18F accumulates, it is essential for accurate data modeling to know which pools are labeled, and that their number stays limited. However, these measurements take advantage of the excellent spatial and time resolution of PET as compared with NMR.
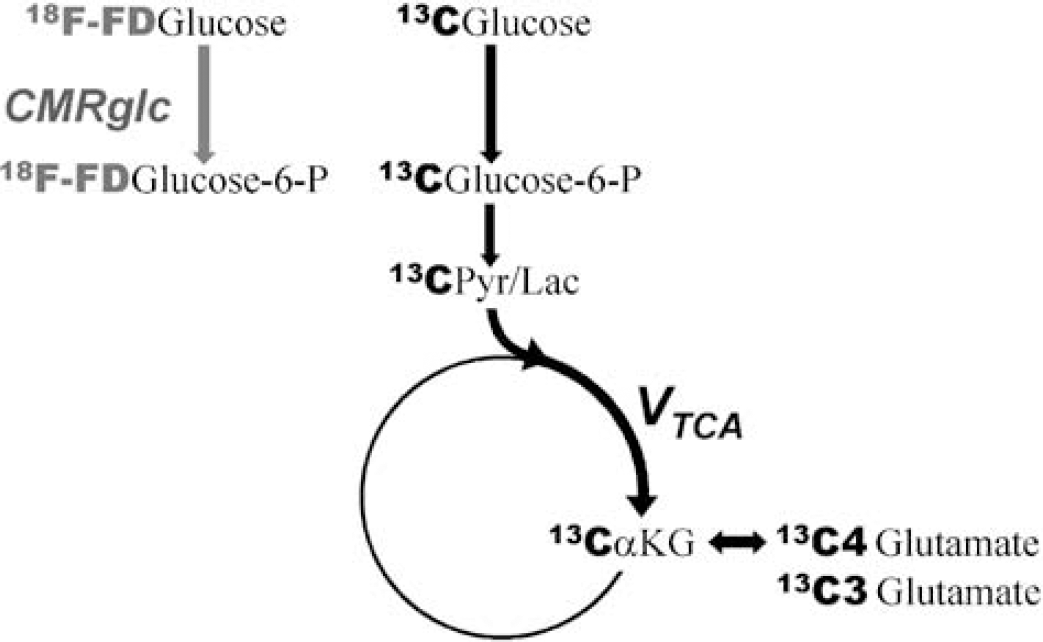
Labeling strategy applied for the measurement of glycolytic and oxidative pathways in the primate brain. Positron emission tomography (PET) detection of 18F-FDG leads to CMRglc (gray arrow), while nuclear magnetic resonance (NMR) detection of 13C incorporation from 13C glucose into glutamate leads to the TCA cycle flux VTCA (black arrows).
Although the first PET measurements of CMRglc were performed more than 25 years ago (Reivich et al, 1977; Kennedy et al, 1978; Phelps et al, 1979), no direct confrontation between NMR-derived VTCA and PET-derived CMRglc had yet been realized. The objective of this study was to perform both measurements in the same monkeys under identical experimental conditions. Nuclear magnetic resonance measurement of VTCA was based on the simultaneous detection of glutamate 13C4 and 13C3 to improve measurement accuracy (Henry et al, 2002; de Graaf et al, 2004). Nuclear magnetic resonance and PET data sets were registered so as to explore the same area of the brain. The purpose of this comparison was to provide a cross-validation of both techniques under normal physiologic conditions in which brain glycolysis and TCA cycle are expected to be coupled.
Materials and methods
Animal Preparation
All experimental procedures were performed in strict accordance with the recommendations of the European Community (86/609) and the French National Committee (87/848) for care and use of laboratory animals. Studies were conducted on five healthy male macaque monkeys (Macaca fascicularis, body weight ~7.0 kg) after they were fasted overnight. Primary anesthesia was induced by ketamine—xylazine injection. Femoral veins were then cannulated for blood sampling, glucose infusion, and intravenous anesthesia (~200 μg/kg min propofol). The head was positioned in a stereotaxic frame with bite-bar and ear rods, the body being in the sphinx position.
Nuclear Magnetic Resonance Acquisition
Nuclear magnetic resonance experiments were performed on a whole-body 3 Tesla system (Bruker, Ettlingen, Germany) equipped with a custom-made surface 1H coil. Nuclear magnetic resonance measurement of VTCA in the monkey brain has been described in detail elsewhere (Boumezbeur et al, 2004). Briefly, each study started with the acquisition of high-resolution T1-weighted NMR images (0.66 × 0.66 × 1.40 mm3) for proper positioning of the 30 × 10 × 13 mm3 voxel of interest (VOI) in the brain and for measurement of CSF/gray matter/white matter distribution within the VOI. Shimming was performed down to ~8Hz and a baseline 1H PRESS spectrum was collected (TE/TR = 8/2,500 ms, 256 scans). 1H PRESS spectra were then collected during an intravenous infusion of [U-13C6]glucose. Infusion started with a 3-min bolus of 99% 13C-enriched glucose to rapidly achieve a three-fold increase in glycemia (~0.3 ml/kg min, 20% wt/vol). Then a 2:1 mixture of [U-13C6] and nonlabeled glucose was infused continuously at a lower rate (~0.01 ml/kgmin, 20% wt/vol) for about 120 mins. As a result, 13C-fractional enrichment (FE) of plasma glucose reached ~60% to 65% after 5 mins of infusion and slowly stabilized around 55% to 60% until the end of infusion (Boumezbeur et al, 2004). Blood samples were collected 5, 20, 40, 60, and 100 mins into the infusion protocol. Glycemia was measured using a Onetouch glucose meter (Lifescan Inc., Milpitas, CA, USA) and glucose 13C FE was measured using high-resolution NMR spectroscopy on a vertical wide-bore 7T NMR spectrometer (Bruker, Ettlingen, Germany). Finally, a 3D proton density MR image (matrix 128 × 128 × 128, resolution 1 × 1 × 1 mm3) was acquired for registration with 18F-FDG PET images. Animals were monitored during NMR measurements using an MR compatible Maglife system (Schiller Médical SA, Wissembourg, France). Physiologic parameters remained stable within a normal range (36 to 37°C for body temperature, 50 to 60 mm Hg for noninvasive blood pressure as measured with an air-cuff placed around the arm, 90 to 110/min for cardiac frequency, 18 to 23/min for respiratory frequency and 35 to 40 mm Hg for expired CO2 saturation). To compensate for the intrinsic lower sensitivity of NMR detection as compared with PET detection, each monkey underwent two NMR studies (VTCA measurements). For each monkey, the 2nd NMR study was conducted ~2 weeks after the first one, under identical anesthetic conditions.
Nuclear Magnetic Resonance Processing
Difference 1H PRESS spectra (baseline minus infusion) exhibit signal changes at 2.35 and 2.09 p.p.m. corresponding to the protons bonded to 12C carbons of glutamate in positions C4 and C3, respectively. A signal change of opposite sign originates from 13C-coupled protons (satellite peaks appearing 135 Hz away from each other), corresponding to the incorporation of 13C label into glutamate. The time course of glutamate C4 and C3 FE was derived from difference 1H PRESS spectra (Boumezbeur et al, 2004). A conventional metabolic model describing the incorporation of 13C from blood glucose into brain glutamate was implemented (Mason et al, 1992; Henry et al, 2002). Parameters for glucose transport through the blood—brain barrier were derived from human studies (Gruetter et al, 1998). Blood glucose concentration and FE were used as input functions for the model and glutamate C4 and C3 FE were adjusted, leading to the absolute TCA cycle flux VTCA. To avoid potential error on VTCA, no assumption was made on the exchange rate VX between the TCA cycle intermediate α-ketoglutarate (α-KG) and glutamate (Boumezbeur et al, 2004).
Positron Emission Tomography Acquisition
Positron emission tomography experiments were performed on an ECAT EXACT HR + tomograph (Siemens-CTI, Knoxville, TN, USA), providing simultaneous acquisition of 63 slices with an isotropic intrinsic resolution of 4.5 mm. After completing a transmission scan with a 68Ga–68Ge source for attenuation correction, PET emission scans were collected for 60mins after 18F-FDG injection intravenously (94×29 MBq). A total of 24 emission scans was obtained. During the first 3 mins of acquisition, arterial blood samples were collected every 15th second and after that at 5, 7, 10, 15, 20, 30, 40, and 50 mins. They were drawn to measure arterial radioactivity in a cross-calibrated γ-counter (Cobra Quantum D5003, Perkin-Elmer, France). Plasma time—activity curves were corrected for 18F decay from the time of injection. Glycemia was measured at the beginning and at the end of the protocol. Body temperature, cardiac frequency, and expired CO2 saturation were monitored during PET experiments and remained stable within the range measured during NMR experiments. Each monkey underwent one PET study (CMRglc measurement).
13C-NMR and 18F-FDG Positron Emission Tomography Registration
Three-dimensional proton density MR images were registered with 3D reconstructed PET scans using rapid, robust and fully automated rigid registration method. Proper image superimposition was achieved by maximization of mutual information (Viola and Wells, 1997). Registration allowed one to accurately localize the NMR-detected VOI within PET images. This VOI was extracted from the 24 PET images and the corresponding time-activity curve was generated with regional activity calculated for each frame and plotted versus time.
Positron Emission Tomography Processing
CMRglc was obtained by applying the three-compartment autoradiographic model introduced by Sokoloff et al (1977) and extended for use in humans with 18F-FDG as a tracer by Phelps et al (Kennedy et al, 1978; Reivich et al, 1979; Phelps et al, 1979). In the case of gray/white matter mixture, simulation studies have shown that 18F time—activity curves are best modeled using the irreversible phosphorylation assumption (k*4 = 0), leading to a 3K model (Schmidt et al, 1991; Schmidt et al, 1995). Tissue vascular fraction was set to 5% and FDG lumped constant was derived from human studies (LC = 0.42 (Phelps et al, 1979)). Arterial plasma radioactivity and glucose concentrations were used as input functions. Model constants (k1*, k2*, and k3*) were identified with a nonlinear least-squares fitting procedure under Pmod (PMOD Technologies, Zürich, Switzerland) (Burger and Buck, 1997) and the cerebral metabolic rate of glucose was derived from: CMRglc = G0/LC × k1*k3*/(k2* + k3*), where G0 is the arterial glucose concentration.
Results
Nuclear Magnetic Resonance Data
Figure 2 presents a T1 scout image acquired in one monkey superimposed to an 18F-FDG PET image, showing the position of the VOI. The mean VOI composition as determined by image segmentation was 7.4% CSF, 50.6% gray matter, and 42.0% white matter. On average, blood glucose concentration during the 2-h 13C-glucose infusion was 6.8 ± 1.3mmol/L (8.5 ± 2.0 mmol/L after 5 mins of infusion and 5.6 ± 1.3 mmol/L at the end of infusion). For each study, glutamate 13C4 and 13C3 time courses were fitted. Figure 3A shows time courses collected in one monkey, showing a good agreement of experimental data with the metabolic model. The resulting fluxes in the VOI were VTCA = 0.53 ± 0.13 μmol/g min and VX = 6.4 ± 5.1 μmol/g min (n = 10, mean ± sd).
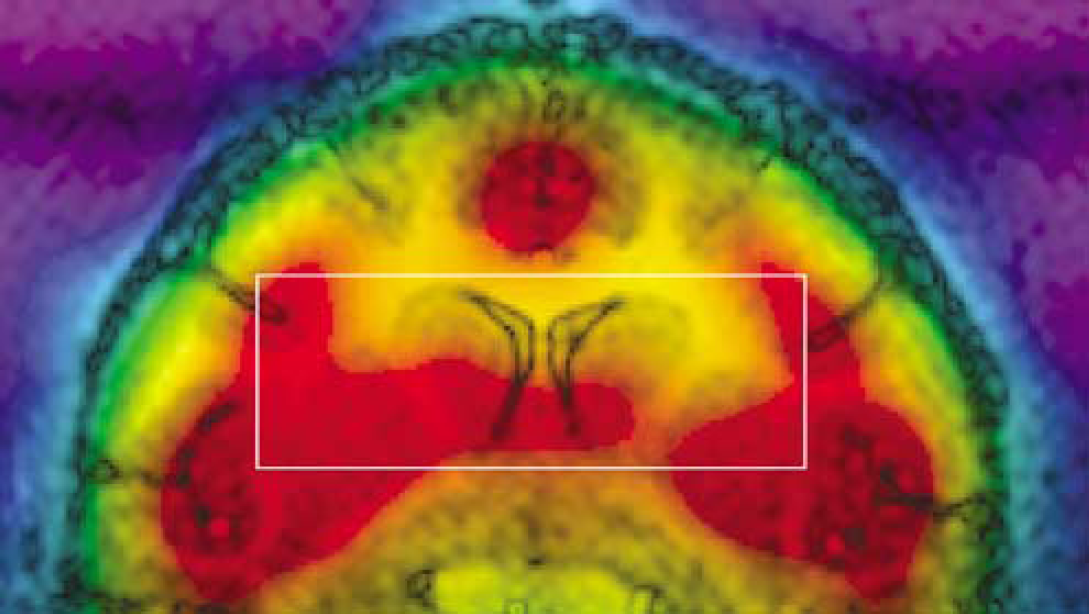
Superimposition of T1 MR image and 18F-FDG positron emission tomography (PET) image after registration. The 3.9 mL voxel of interest is shown (white rectangle).
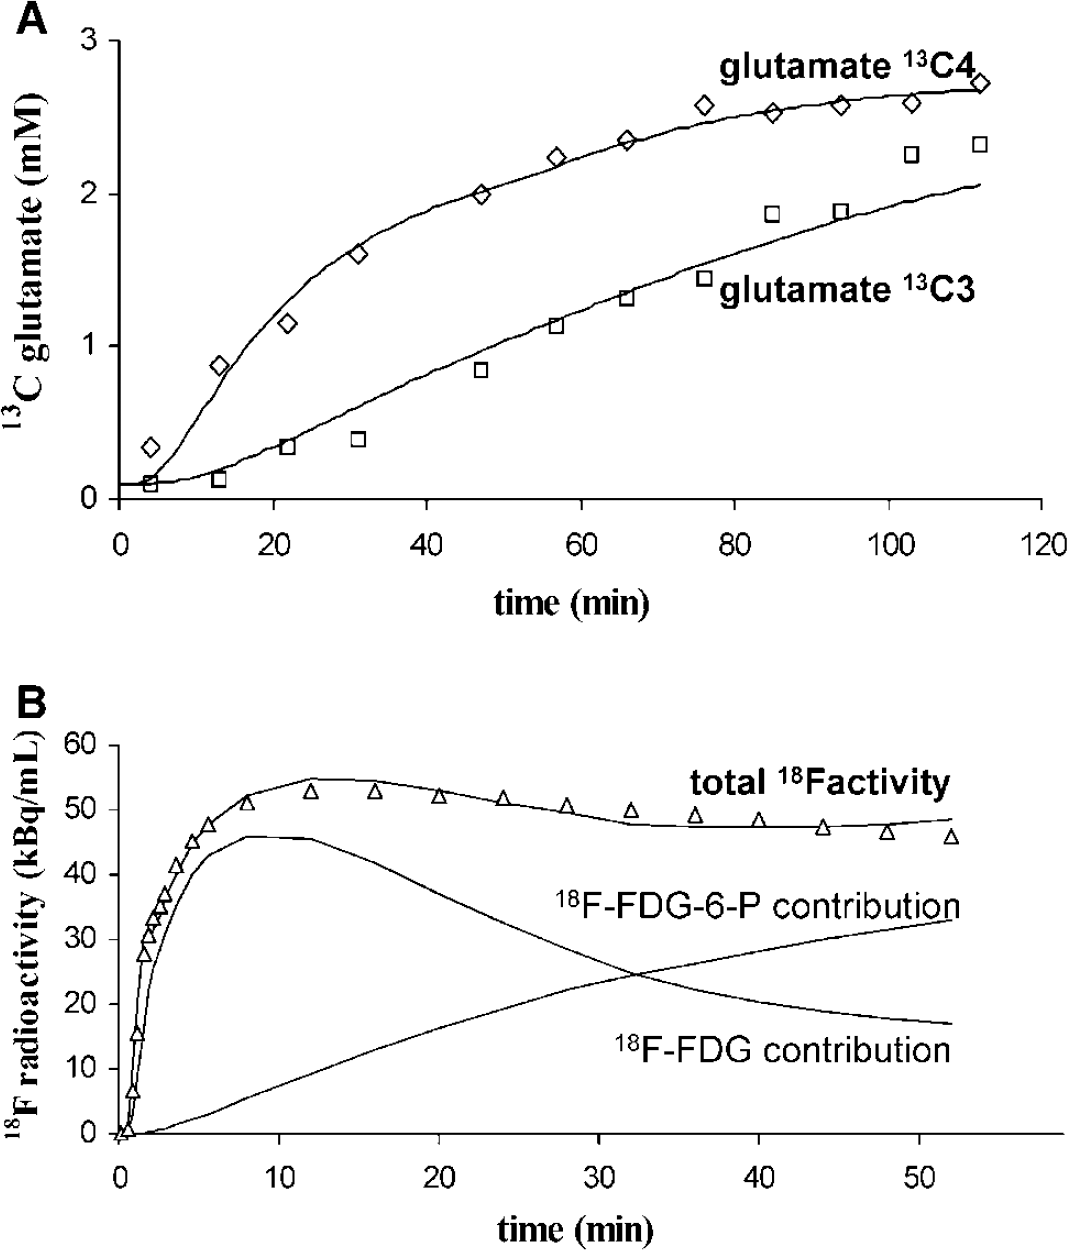
Nuclear magnetic resonance (NMR)-measured and positron emission tomography (PET)-measured labeling time courses. (A) Glutamate 13C4 and 13C3 time courses measured by NMR in one experiment and best fits. (
Positron Emission Tomography Data
A registered 18F-FDG PET image was superimposed to T1 MRI in Figure 2. Image color was scaled with higher radioactivity to the reds and lower to the violet-blues. Plasma glucose concentration remained stable during PET experiments (5.2 ± 1.2 mmol/L). The time—activity curve measured in one monkey in the NMR-detected VOI is plotted in Figure 3B together with the best fit by the three-compartment model. 18F-FDG and 18F-FDG-6-P contributions to tissue radioactivity are represented. 18F-FDG uptake analysis resulted in an average CMRglc of 0.23 ± 0.03 μmol/g min (n = 5, mean ± s.d.).
[CMRglc/VTCA] Ratio
For each monkey, the two NMR-measured VTCA were averaged. Then the [CMRglc/VTCA] ratio was calculated, resulting in 0.46 ± 0.12 (n = 5, mean + s.d.).
Discussion
Absolute Values of VTCA and CMRglc
The results presented here for the TCA cycle rate (0. 53 μmol/g min) and the cerebral metabolic rate of glucose (0.23 μmol/g min) are in the lower range of literature values (Noda et al, 2002; Shulman et al, 2004). One possible explanation includes the contribution of white matter to our VOI (Mason et al, 1999), as well as species differences and effects of anesthetics.
Nuclear Magnetic Resonance versus Positron Emission Tomography Physiologic Conditions
Because NMR and PET measurements were not performed simultaneously, it was essential to verify that physiologic conditions were similar during both experiments. Physiologic parameters monitored during experiments did not show any significant difference. A particular concern was the glycemic status of monkeys, since NMR experiments require significantly more 13C glucose than the trace amount of 18F-FDG used in PET. Glycemia as measured during NMR experiments (7.3 mmol/L at the beginning of glucose infusion and 6.0 mmol/L at the end) was slightly higher than during PET experiments (5.6 ± 1.3 mmol/L). However, it is widely accepted that the glucose plasma level—within reasonable limits—has a negligible effect on brain oxidative metabolism (Hasselbalch et al, 1994; Hasselbalch et al, 1996; van Zijl et al, 1997). Thus, from the standpoint of brain metabolism, NMR and PET experiments were conducted under similar physiologic conditions.
Nuclear Magnetic Resonance versus Positron Emission Tomography Metabolic Models
Comparison of VTCA and CRMglc relies on the assumption that metabolic models used for deriving both fluxes are consistent. For both data types, simple and widely accepted models were used. To parameterize NMR and PET models, human data were taken for glucose transport parameters (Km, Vmax) and for the FDG lumped constant, respectively (Phelps et al, 1979; Gruetter et al, 1998). The use of parameters derived from human studies, which is because of the absence of accurate data on the macaque brain, is commonly accepted for studies on infra-human primates.
Glycolytic versus TCA Cycle Flux
The [CMRglc/VTCA] ratio (0.46 ± 0.12) is consistent with the 0.5 ratio between glycolytic and TCA cycle fluxes, arguing in favor of a metabolic coupling between glycolysis and TCA cycle under mild anesthesia. For proper interpretation of this ratio, it must be kept in mind that VTCA as measured using 13C-labeled glucose includes the contribution of all possible substrates of acetyl coenzyme A oxidation. In this context, possible explanations for the [CMRglc/VTCA] ratio being smaller than 0.5 include the contribution of other substrates to the TCA cycle, although measurement accuracy does not allow accurate quantification of this contribution.
In conclusion, this work is the first reported combination of 13C-NMR spectroscopy and 18F-FDG PET performed on the same animals. The resulting [CMRglc/VTCA] ratio was not significantly different from the 0.5 expected under normal physiologic conditions, showing that NMR and PET approaches provide highly consistent results when performed in the same animals under similar physiologic conditions. Therefore, this work can be interpreted as a cross-validation of both imaging techniques. This approach should prove useful for exploring possible uncoupling between glycolytic and oxidative pathways during focal cerebral activation or brain disease.
Footnotes
Acknowledgements
The authors thank Dr Claire Wary for careful rereading of this manuscript.