
Abstract
A range of behaviours are elucidated via ionotropic glutamate receptors (iGluR). In this work, we examined the acute activation of iGluRs by a range of receptor ligands and effectors to see whether distinguishable metabolic sequelae were elucidated by the activity. We used a guinea-pig brain cortical tissue slice model using targeted receptor ligands ((RS)-(tetrazol-5-yl)glycine (TZG), (5S,10R)-(+)-5-methyl-10, 11-dihydro-5H-dibenzo[a, d]cyclohepten-5, 10-imine maleate (MK-801, dizocilpine), cis-4-[phosphomethyl]-piperidine-2-carboxylic acid (CGS 19755), (RS)-α-amino-3-hydroxy-5-methyl-4-isoxazolepropionic acid, (2S, 3S, 4S)-2-carboxy-4-(1-methylethenyl)-3-pyrrolidineacetic acid (kainate) and D-serine (D-Ser), as well as compounds (quinolinic acid and kynurenic acid (KynA)) involved in some neuroinflammatory responses. The data were derived using 13C and 1H NMR spectroscopy, and analysed by metabolomic approaches and multivariate statistics. The metabolic effects of agonists at the three major classes of iGluR were easily separated from each other using this method. The classical N-methyl-D-aspartate receptor agonist TZG and the antagonist CGS 19755 produced excitatory and inhibitory metabolic responses, respectively, while the blocker MK-801 resulted in a significant decrease in net metabolism and produced the largest decrease in all metabolite pool sizes seen by any glutamatergic ligand we have studied. Quinolinic acid and KynA produced similar acute metabolic responses, which were unlike those to TZG or CGS 19755, but similar to that of D-Ser. D-Ser was highly stimulatory of net flux into the Krebs cycle. These data show that the metabolic response to iGluR perturbation in vitro is a sensitive discriminator of function.
Introduction
Glutamate acts as the major excitatory neurotransmitter in the brain, as well as a metabolic intermediate and synthetic precursor for other amino acids. Subtlety in glutamatergic neurotransmission is achieved by variation in the types and mode of activation of glutamate receptors, as well as by variations in receptor subunit composition, splice variants thereof, and by each receptor subtype variant having different pharmacological properties with respect to the many and varied ligands and effectors, resulting in a near infinite number of possible activation responses.
Glutamate receptors are either ionotropic (three types, characterised by their responses to N-methyl-D-aspartate (NMDA), kainate or (RS)-α-amino-3-hydroxy-5-methyl-4-isoxazolepropionic acid (AMPA)) or metabotropic (eight subtypes, which will not be considered further here). N-methyl-D-aspartate receptors are probably tetramers comprised of 1 NR1 subunits combined with one or more NR2 (A–D) subunits. They contain a binding site for NMDA, a strychnine-insensitive, glycine-binding site, an ion-channel site and a polyamine site, as well as sites for modulators such as Zn2+, Mg2+ and H+. In addition to their key function in excitatory neurotransmission, NMDA receptors (NMDARs) play critical roles in brain plasticity and excitotoxicity, and their activity impacts on many diseases and cognitive processes, including learning and memory (Cull-Candy et al, 2001).
NMDAR are pharmacologically distinct from the ‘non-NMDA’ AMPA and kainite receptors, selectively activated by AMPA and kainate, respectively. (RS)-α-amino-3-hydroxy-5-methyl-4-isoxazolepropionic acid readily open in the presence of glutamate, but they rapidly desensitise; this desensitisation can be blocked by cyclothiazide (Desai et al, 1995; Trussel et al, 1993). AMPA acid receptor overactivation is known to mediate neurotoxicity (Jayakar and Dikshit, 2004). The kainate receptor mediates a synaptic current that is small compared with that mediated by the AMPA receptor (Castillo et al, 1997), and it has significantly slower deactivation kinetics (Lerma, 2003). Kainate receptors are located both pre- and postsynaptically and their response is dependent on their subunit composition (Lerma, 2003). They have been found to also possess a metabotropic response (Rodriguez-Moreno and Lerma, 1998), although there is debate about the mechanism by which this is mediated (Lerma, 2003). (RS)-α-amino-3-hydroxy-5-methyl-4-isoxazolepropionic acid and kainate receptors have been difficult to resolve pharmacologically. Recently, more specific ligands have been developed for these receptors, although their availability is still somewhat restricted.
Neurotoxicity as a consequence of inflammatory events has also been suggested to be mediated via NMDARs (Stone, 2001). Quinolinic acid (Quin) is one such mediator (Tsuzuki et al, 1989), reported to be an agonist at NMDARs and specific for NR2-containing receptors (DeCarvalho et al, 1996). Another intermediate in the kynurenine pathway, kynurenic acid (KynA), has been reported to have antagonist (and neuroprotective) actions at NMDARs (Schwarcz and Pellicciari, 2002). The effect of these ligands on intermediary metabolism in the brain has never been examined, although their relationship to inflammation and altered metabolic responses has been documented (Medana et al, 2002).
Previous work has shown that brain metabolism is exquisitely sensitive to receptor and/or transporter modulation, with specific receptor ligands inducing unique and reproducible metabolic profiles (Moussa et al, 2002; Rae et al, 2003, 2005b). In this work, we sought to determine the metabolic sequelae of acute ionotropic glutamate receptor (iGluR) modulation for subsequent use in receptor subtype-selective profiling, as well as to shed light on the metabolic changes seen after injury, inflammation and other brain insults.
Materials and methods
Materials
Guinea-pigs (Dunkin-Hartley), weighing 400 to 800 g, were fed ad libitum on standard guinea-pig/rabbit pellets, with fresh cabbage leaves and lucerne hay roughage. Water bottles were supplemented with L-ascorbic acid (1 g/l). Animals were maintained on a 12-h light/dark cycle. All experiments were conducted in accordance with the guidelines of the National Health and Medical Research Council of Australia and were approved by the institutional Animal Care Ethics Committee.
Sodium [3-13C]pyruvate and sodium [13C]formate were purchased from Cambridge Isotope Laboratories Inc. (Andover, MA, USA). (RS)-(tetrazol-5-yl)glycine (TZG); dizocilpine (MK-801), (5S, 10R)-(+)-5-methyl-10, 11-dihydro-5H-dibenzo[a, d]cyclohepten-5,10-imine maleate; cis-4-[phosphomethyl]-piperidine-2-carboxylic acid (CGS 19755); (RS)-α-amino-3-hydroxy-5-methyl-4-isoxazolepropionic acid (AMPA); (2S, 3S, 4S)-2-carboxy-4-(1-methylethenyl)-3-pyrrolidineacetic acid (kainate); 6-chloro-3, 4-dihydro-3-(5-norbornen-2-yl)-2H-1,2,4-benzothiadiazine-7-sulphonamide-1,1-dioxide (cyclothiazide); pyridine-2, 3-dicarboxylic acid (Quin) and 4-hydroxyquinoline-2-carboxylic acid (KynA) were purchased from Tocris Cookson, Bristol (UK). All other reagents were of AR grade.
Preparation of Brain Cortical Tissue Slices
Guinea-pigs were killed by cervical dislocation. The brain was rapidly removed from the cranial vault, and the cortex dissected and chopped into 350 μm slices in the paraxial plane using a McIlwain tissue chopper. The resulting slices were immediately washed three times in a modified Krebs–Henseleit buffer (124 mmol/L NaCl, 5 mmol/L KCl, 1.2 mmol/L KH2PO4, 1.2 mmol/L CaCl2, 1.2 mmol/L MgSO4 and 26 mmol/L NaHCO3 (Badar-Goffer et al, 1990)), resuspended for 1 h in fresh buffer containing 10 mmol/L unlabelled glucose and gassed with 95% O2/5% CO2 in a shaking water bath, maintained at 37°C, to allow metabolic recovery (McIlwain and Bachelard, 1985). Slices were then washed three times in glucose-free buffer and resuspended in fresh buffer with the substrate of choice.
Modulation of Ionotropic Glutamate Receptor Activity
To determine the effect of modulation of iGluR on metabolic activity, slices were incubated with 2 mmol/L sodium [3-13C]pyruvate (control) and also, in the case of ligand treatment groups, with one of two concentrations of the ligand. These included 0.5 and 5 μmol/L TZG (highly potent NMDAR agonist (Schoepp et al, 1991)), 5 and 50 μ/mol/L CGS 19755 (potent, competitive NMDAR antagonist (Lehmann et al, 1988)), 5 μmol/L MK-801 (selective, noncompetitive NMDAR antagonist (Wong et al, 1986)), 5 and 50 μmol/L kainate (selective agonist at kainate receptors (Watkins and Evans, 1981)), 5 and 50 μmol/L AMPA (defining agonist for AMPA receptors (Krogsgaard-Larsen et al, 1980)) with 100 μmol/L cyclothiazide (allosteric modulator of AMPA receptors which potently inhibits receptor desensitisation (Desai et al, 1995)), 0.5 and 100 μmol/L Quin (endogenous NMDAR agonist), 10 and 100 μmol/L KynA (broad-spectrum excitatory amino-acid antagonist) and 0.5 and 5 μmol/L D-serine (D-Ser) (agonist at the glycine-binding site of NMDAR (Curtis et al, 1961; Matsui et al, 1995)). The concentrations of ligands were chosen to reflect the affinity of iGluR agonists and antagonists in the low micromolar region and to separate other possible nonspecific activities. Typically, the concentrations studied were around KM or Kd (whichever published values were available) and 10 times this amount.
Slices were incubated for 1 h with [3-13C]pyruvate and the experiment was stopped as indicated.
To monitor cell viability in the presence of iGluR ligands, the intracellular [K+] was measured by atomic absorption spectrometry (SpecterAA 20 Plus Varian Spectrometer; Varian, Victoria, Australia) using the supernatant obtained after the slices were lysed in MilliQ water, homogenised and centrifuged. The protein concentration of the pellet was measured by the Lowry technique and used to standardise the measured [K+]. Experimental samples (N = 10) were measured in triplicate and mean values recorded for each sample. Data were tested for statistical significance using the Newman–Keuls test (GraphPad Prism software Version 3, San Diego, CA, USA). An intracellular [K+] > 80 mmol/L was considered to represent viable tissue (McIlwain and Bachelard, 1985).
Preparation of Samples and NMR Analysis
On completion of the incubation period, slices were removed from the incubation buffer by rapid filtration and extracted in ice-cold 6% perchloric acid. Extracts were neutralised to pH 7.2 with KOH, lyophilised, and the pellet retained for protein estimation by the Lowry technique. Lyophilised supernatants were stored at −20°C until required for NMR analysis. Samples were resuspended in 0.65 mL D2O containing 2 mmol/L sodium [13C]formate as an internal intensity and chemical shift reference (13C δ 171.8). 13C[1H-decoupled] spectra (typically 14,000 to 18,000 transients, duty cycle 4 secs, 83,300 data points) were acquired at 9.4 T, on a Bruker DRX-400 WB spectrometer using a 5 mm dual 1H/13C probe. Fully relaxed 1H and 1H[13C-decoupled] spectra (duty cycle 30 secs, WURST-40 (Kupce and Freeman, 1995) with a 112-step phase cycle (Skinner and Bendall, 1997), decoupling during acquisition) were obtained at 600.13 MHz on a Bruker DRX-600 spectrometer with a broadband inverse xyz-gradient probe. Assignments were aided by reference to standard spectra, coupling constant analysis, and by the acquisition of heteronuclear single-quantum coherence and heteronuclear multiple-bond correlation spectra with gradient selection, employing standard Bruker pulse sequences (Willker et al, 1993) and a broadband inverse xyz-gradient probe at 600.13MHz.
After zero filling to 128K, [1H-decoupled] 13C spectra were transformed using 3 Hz exponential line-broadening and peak areas were determined by integration using standard Bruker software (XWINNMR, Version 3.5). Peak areas were adjusted for nuclear Overhauser effect, saturation and natural abundance effects, and quantified by reference to the area of the internal standard resonance of [13C]formate. Glu C3 was not quantified when [3-13C]pyruvate was used as substrate due to resonance overlap with pyruvate dimer, as described previously (Rae et al, 2000). Metabolite pool sizes (lactate, alanine, gamma aminobutyric acid (GABA), glutamate, glutamine and aspartate) were determined by integration of resonances in fully relaxed 600 MHz 1H[13C-decoupled] spectra using [13C]formate as the internal intensity reference.
Experimental data (N = 4) are given as means (standard deviation). Statistical analysis was performed using analysis of variance (ANOVA) for comparing ligandtreated metabolism at each receptor with control (N = 28), followed, when statistical significance was indicated by Scheffe F-test, by a nonparametric (Mann–Whitney U-test) test (Statview Student). Significance was assumed at α = 0.05.
Pattern Recognition of the Data
Principal components analysis (PCA) was applied to the concentrations of 13C-labelled glutamate (C2 and C4 positions), GABA (C2), lactate (C3), glutamine (C4), aspartate (C2, C3) and alanine (C3), as well as the total concentrations of lactate, alanine, glutamate, glutamine, aspartate and GABA for:
all ligands active at NMDAR (i.e. both concentrations of TZG, CGS 19755, MK-801, Quin, KynA and D-Ser plus all control data), and
all specific agonists at iGluR (i.e. both concentrations of TZG, kainate and AMPA plus control data).
These variables were imported in Simca-P (Version 10, Umetrics, Umeå, Sweden). Before PCA, the data were scaled using autoscaling. This scaling subtracts the mean value of the variable from each measured variable for the total data set, and divides this number by the variance across that variable. This autoscaling routine ensures that each variable contributes equally to the resultant PCA model. Without this scaling, the resultant PCA models would be most influenced by metabolites with high concentration or labelling, rather than all the variables in the total data set. The scores of the first three components of the PCA models were investigated to identify clustering of the treatment groups in this reduced dimensionality. Where clustering was apparent, the contributions of the variables to these principal components were investigated to identify which metabolites contributed the most to the separations identified.
Results
(RS)-(Tetrazol-5-yl)Glycine
Incubation of cortical brain slices with 0.5 μmol/L TZG resulted in significantly increased net flux of 13C into Gln C4 and Lac C3 compared with all controls (N = 28; Figure 1). Increasing the concentration of TZG to 5 μmol/L stimulated net flux into Glu C2 and C4, Gln C4 and Asp C2 and Asp C3. The metabolite pool size of Gln was significantly increased by 0.5 μmol/L TZG, while 5 μmol/L TZG resulted in significant decreases in the metabolite pool sizes of lactate, Glu, Asp, GABA and Ala.
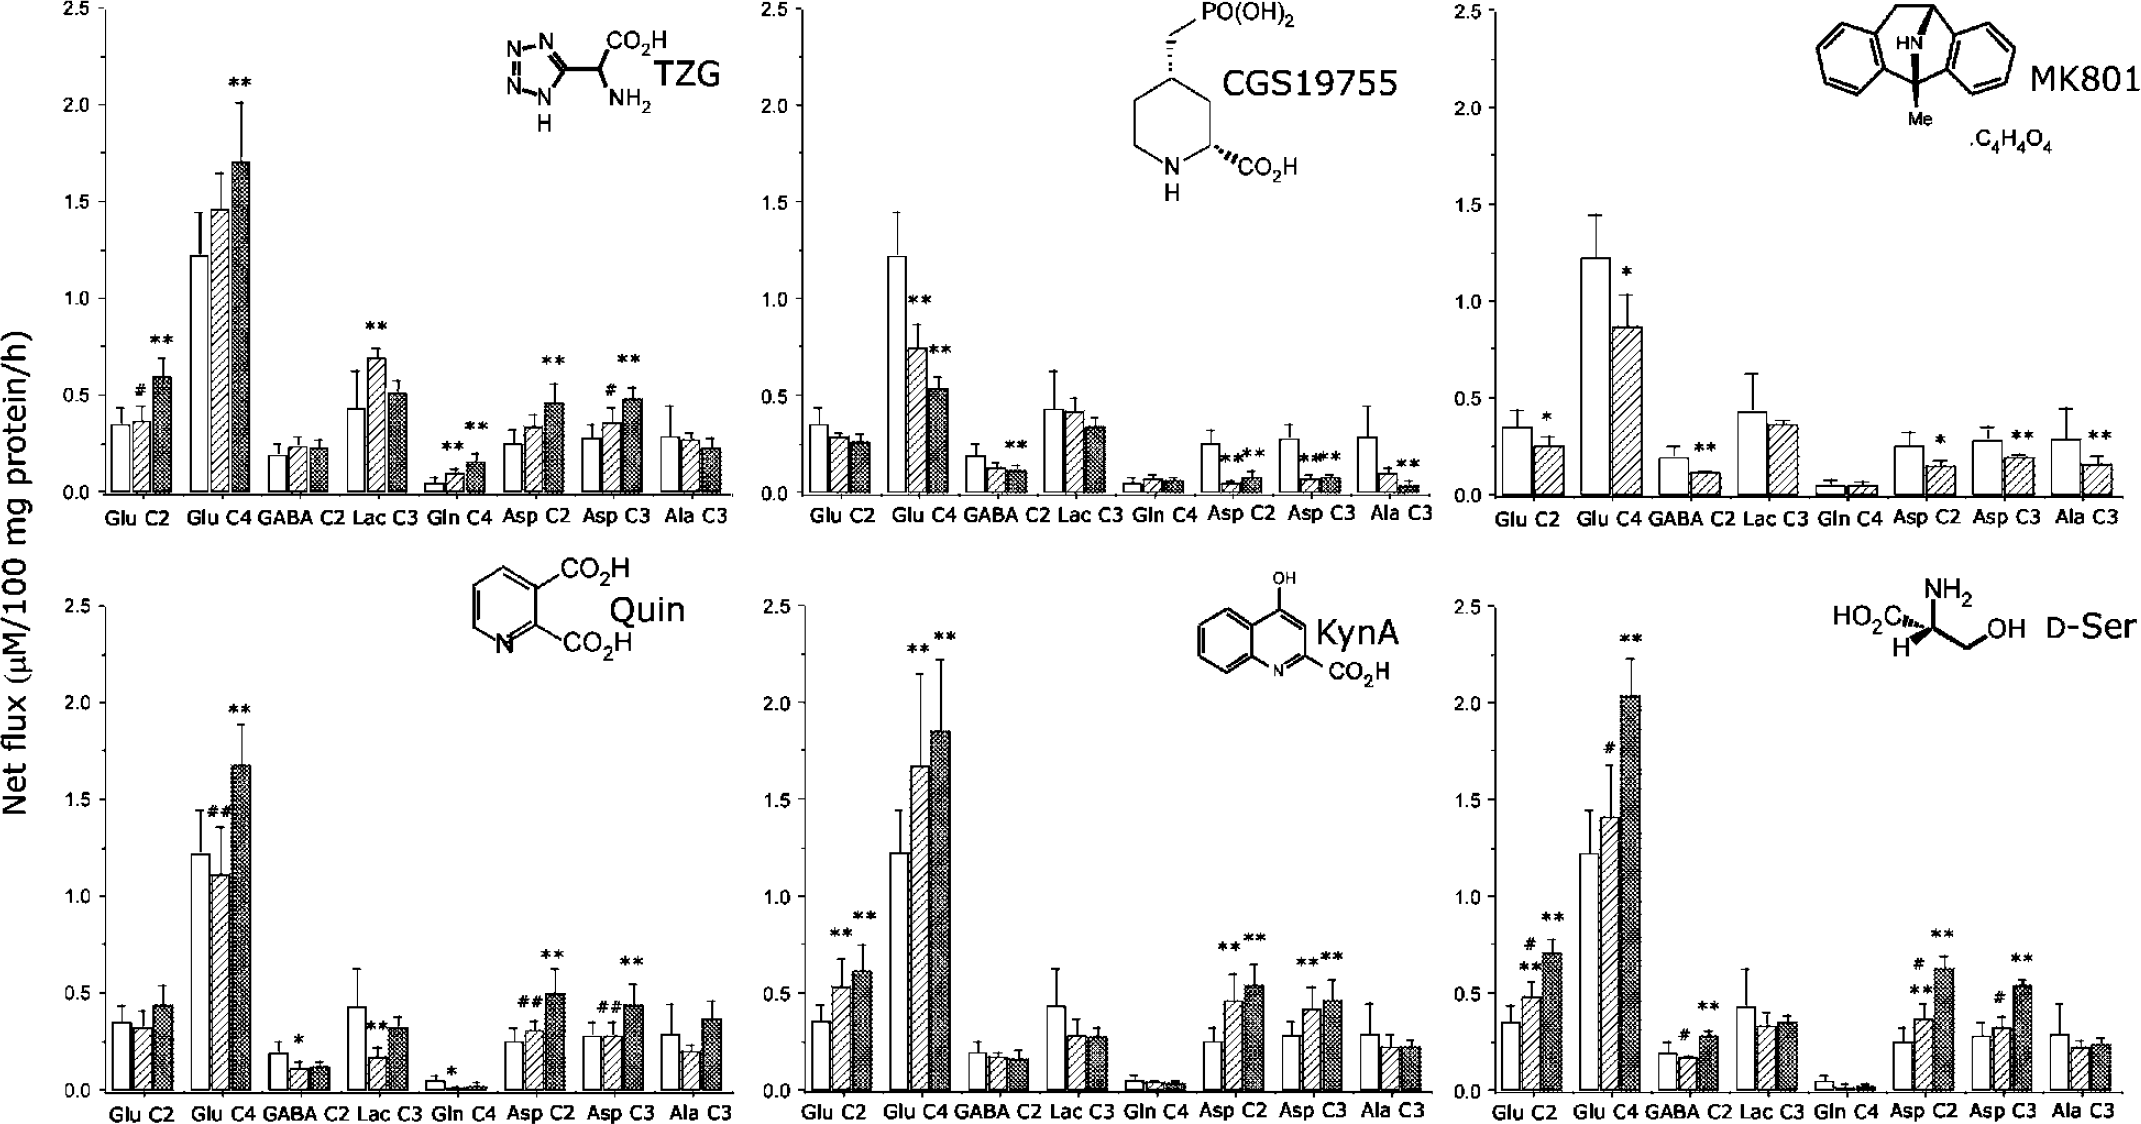
Effects of NMDAR ligands on the net flux of 13C in brain cortical tissue slices incubated 1 h with sodium [3-13C]pyruvate. Clear bars, control (N = 28); hatched bars, lower dose of ligand (N = 4); cross-hatched bars, higher dose of ligand (N = 4). Values shown are means, while error bars show standard deviations. *Significantly different from control; #significantly different from higher dose ligand. * or #P < 0.05, ** or ##P < 0.01. TZG, (RS)-(tetrazol-5-yl)glycine; Quin, quinolinic acid; KynA, kynurenic acid.
cis-4-[Phosphomethyl]-Piperidine-2-Carboxylic Acid
CGS 19755(5 μmol/L) produced significant decreases in net flux into Glu C4 and Asp C2 and C3 (Figure 1). The metabolite pool of glutamate was significantly increased, while the pool size of glutamine decreased. Increasing the concentration of CGS 19755 to 50 μmol/L also produced significant changes, with the amount of 13C detected in Glu C4, GABA C2, Asp C2 and C3 and Ala C3 significantly less than that in control slices. Total aspartate and alanine levels were also decreased (Table 1).
Total metabolite pool sizes
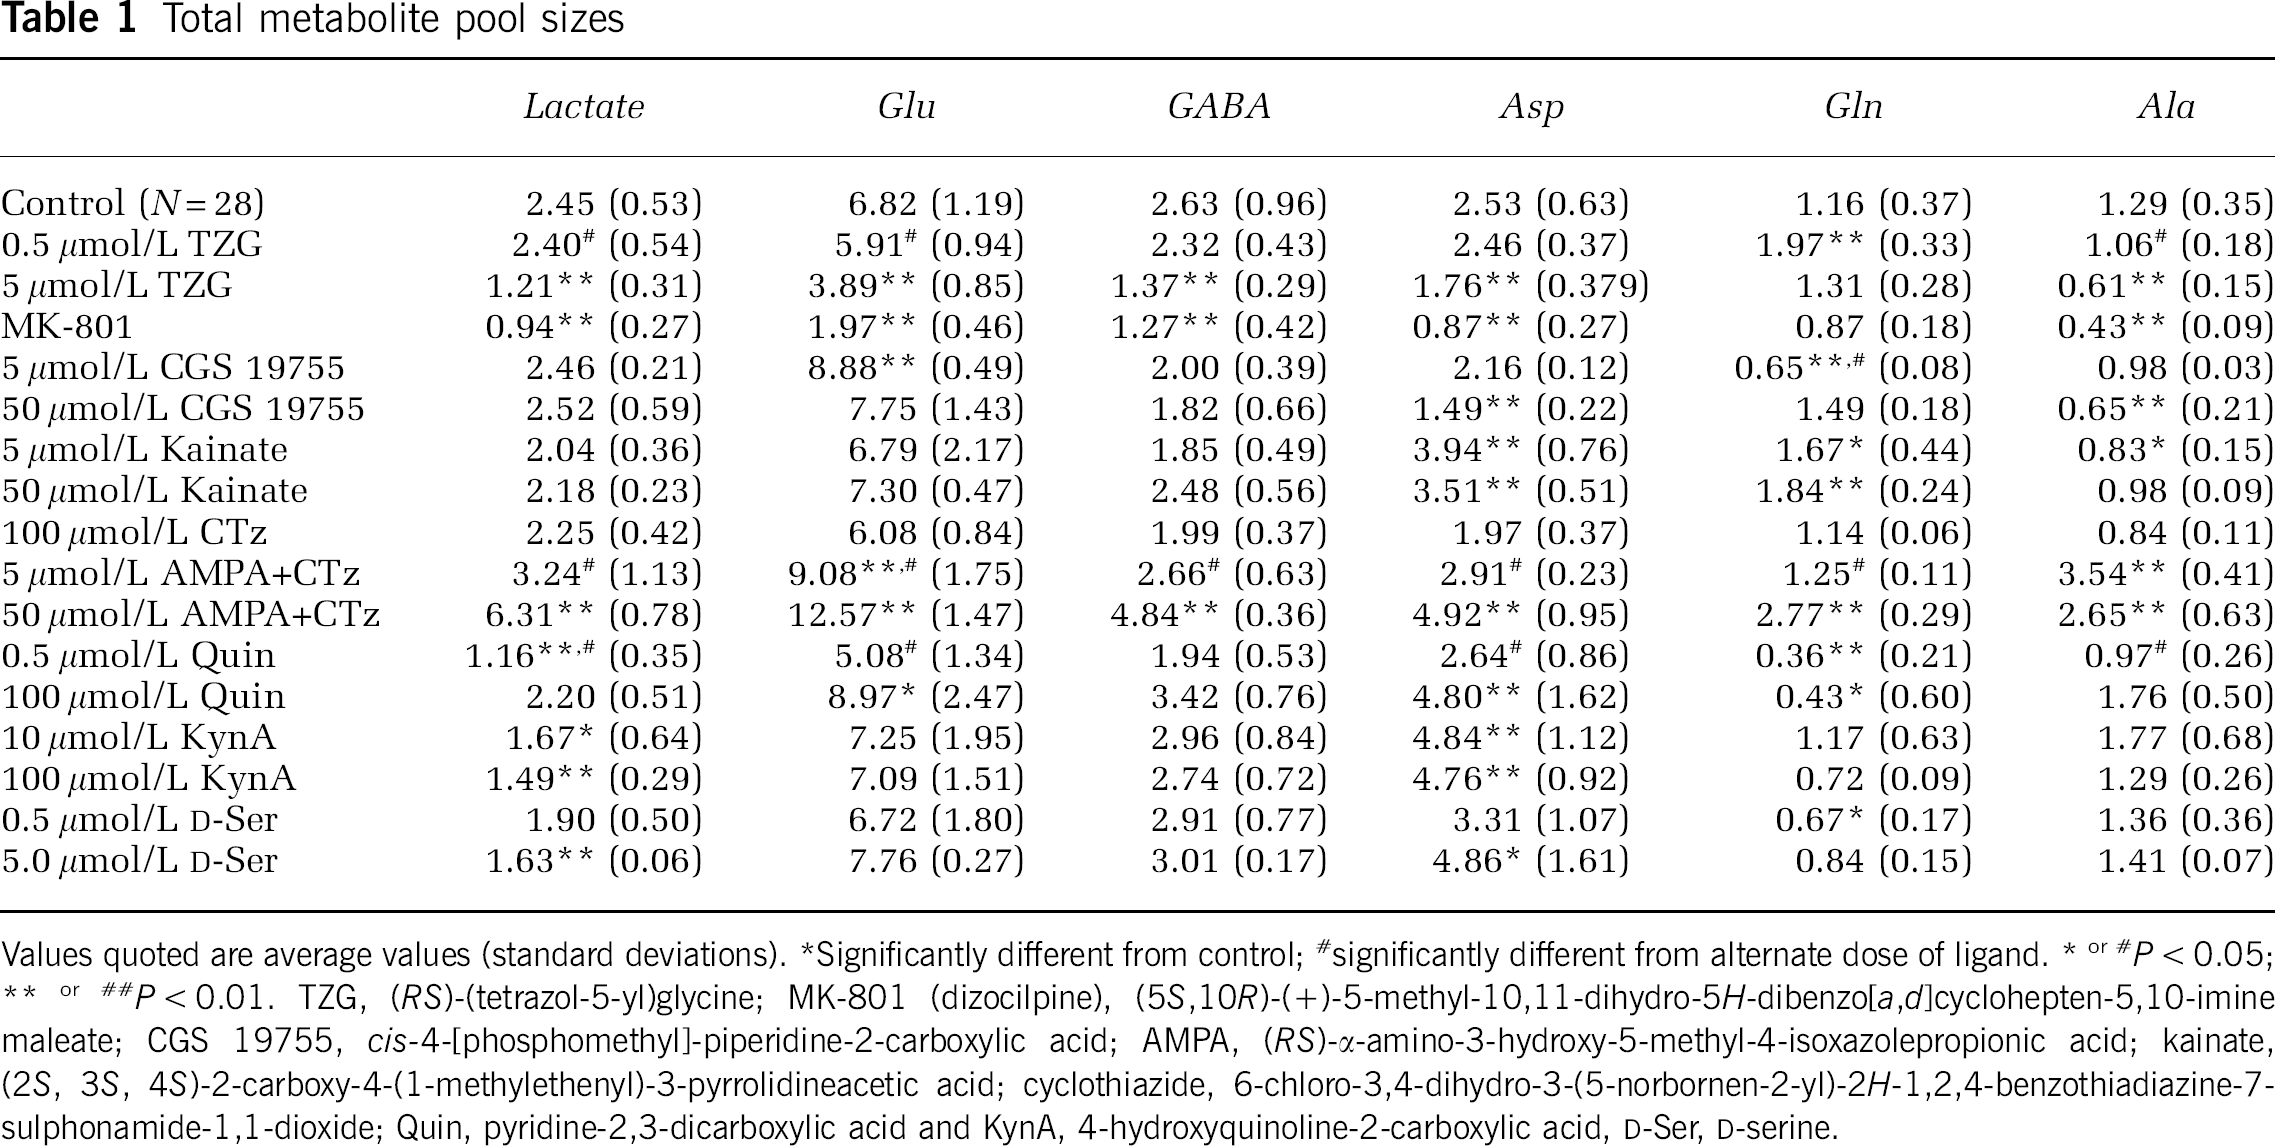
Values quoted are average values (standard deviations).
Significantly different from control
significantly different from alternate dose of ligand. * or # P < 0.05
P < 0.01. TZG, (RS)-(tetrazol-5-yl)glycine; MK-801 (dizocilpine), (5S, 10R)-(+)-5-mythyl-10,11-dihydro-5H-dibenzo[a,d]cyclohepten-5, 10-imine maleate; CGS 19755, cis-4-[phosphomethyl]-piperidine-2-carboxylic acid; AMPA, (RS)-α-amino-3-hydroxy-5-methyl-4-isoxazolepropionic acid; kainite, (2S, 3S, 4S)-2-carboxy-4-(1-methylethenyl)-3-pyrrolidineacetic acid; cyclothiazide, 6-chloro-3,4-dihydro-3-(5-norbornen-2-yl)-2H-1,2,4-benzothiadiazine-7-sulphonamide-1,1-dioxide, Quin, pyridine-2,3-dicarboxylic acid and KynA, 4-hydroxyquinoline-2-carboxylic acid, D-Ser, D-serine.
(5S,10R)-(+)-5-Methyl-10,11-Dihydro-5H-Dibenzo[a,d]Cyclohepten-5,10-Imine Maleate
The noncompetitive antagonist MK-801 (5 μmol/L) significantly decreased net flux into Glu C2 and C4, GABA C2 and Asp C2 and C3, as well as Ala C3 (Figure 1). It also markedly reduced metabolite pool sizes of every compound measured apart from glutamine (Table 1); indeed MK-801 produces the greatest reduction in pool sizes of any glutamate receptor or transporter inhibitor ligand tested by us in this model system (data not shown).
Quinolinic acid
Incubation of guinea-pig brain cortical tissue slices with 0.5 μmol/L Quin produced significant decreases in net flux of 13 C into GABA C2, lactate C3 and Gln C4 (Figure 1). The total pool sizes of lactate and glutamine were significantly decreased. Increased concentration of Quin (100 μmol/L) produced increased net flux into Glu C4 and Asp C2 and C3 (Figure 1), while the metabolite pool sizes of glutamate and aspartate were increased, and that of glutamine decreased (Table 1).
Kynurenic Acid
Kynurenic acid (10 μmol/L) resulted in stimulation of net flux into Glu C2 and Glu C4, and Asp C2 and C3 (Figure 1). The metabolite pool of lactate was decreased, while that of aspartate was increased (Table 1). Kynurenic acid (100 μmol/L) had similar effects on net flux (Figure 1), and on the metabolite pools (Table 1).
D-Serine
Addition of 0.5 μmol/L D-Ser to cortical tissue slices resulted in significantly increased net flux into Glu C2 and Asp C2 and C3 (Figure 1). The total metabolite pool of glutamine was significantly decreased (Table 1). Increasing the D-Ser concentration to 5 μmol/L resulted in further increases in net flux (Figure 1) into Glu C2 and C4 and Asp C2 and C3, as well as increasing the net flux into GABA C2. The total metabolite pool of lactate was decreased, while that of aspartate was increased (Table 1).
Kainate
Addition of 5 μmol/L kainate to brain cortical tissue slices produced significantly increased net flux of 13C into Glu C2 and C4 and Asp C2 and C3, but decreased the net flux into Gln C4 (Figure 2). However, the total metabolite pool size of glutamate remained unchanged, although total aspartate and glutamine levels increased (Table 1). The total pool size of alanine was significantly lower than in control slices.
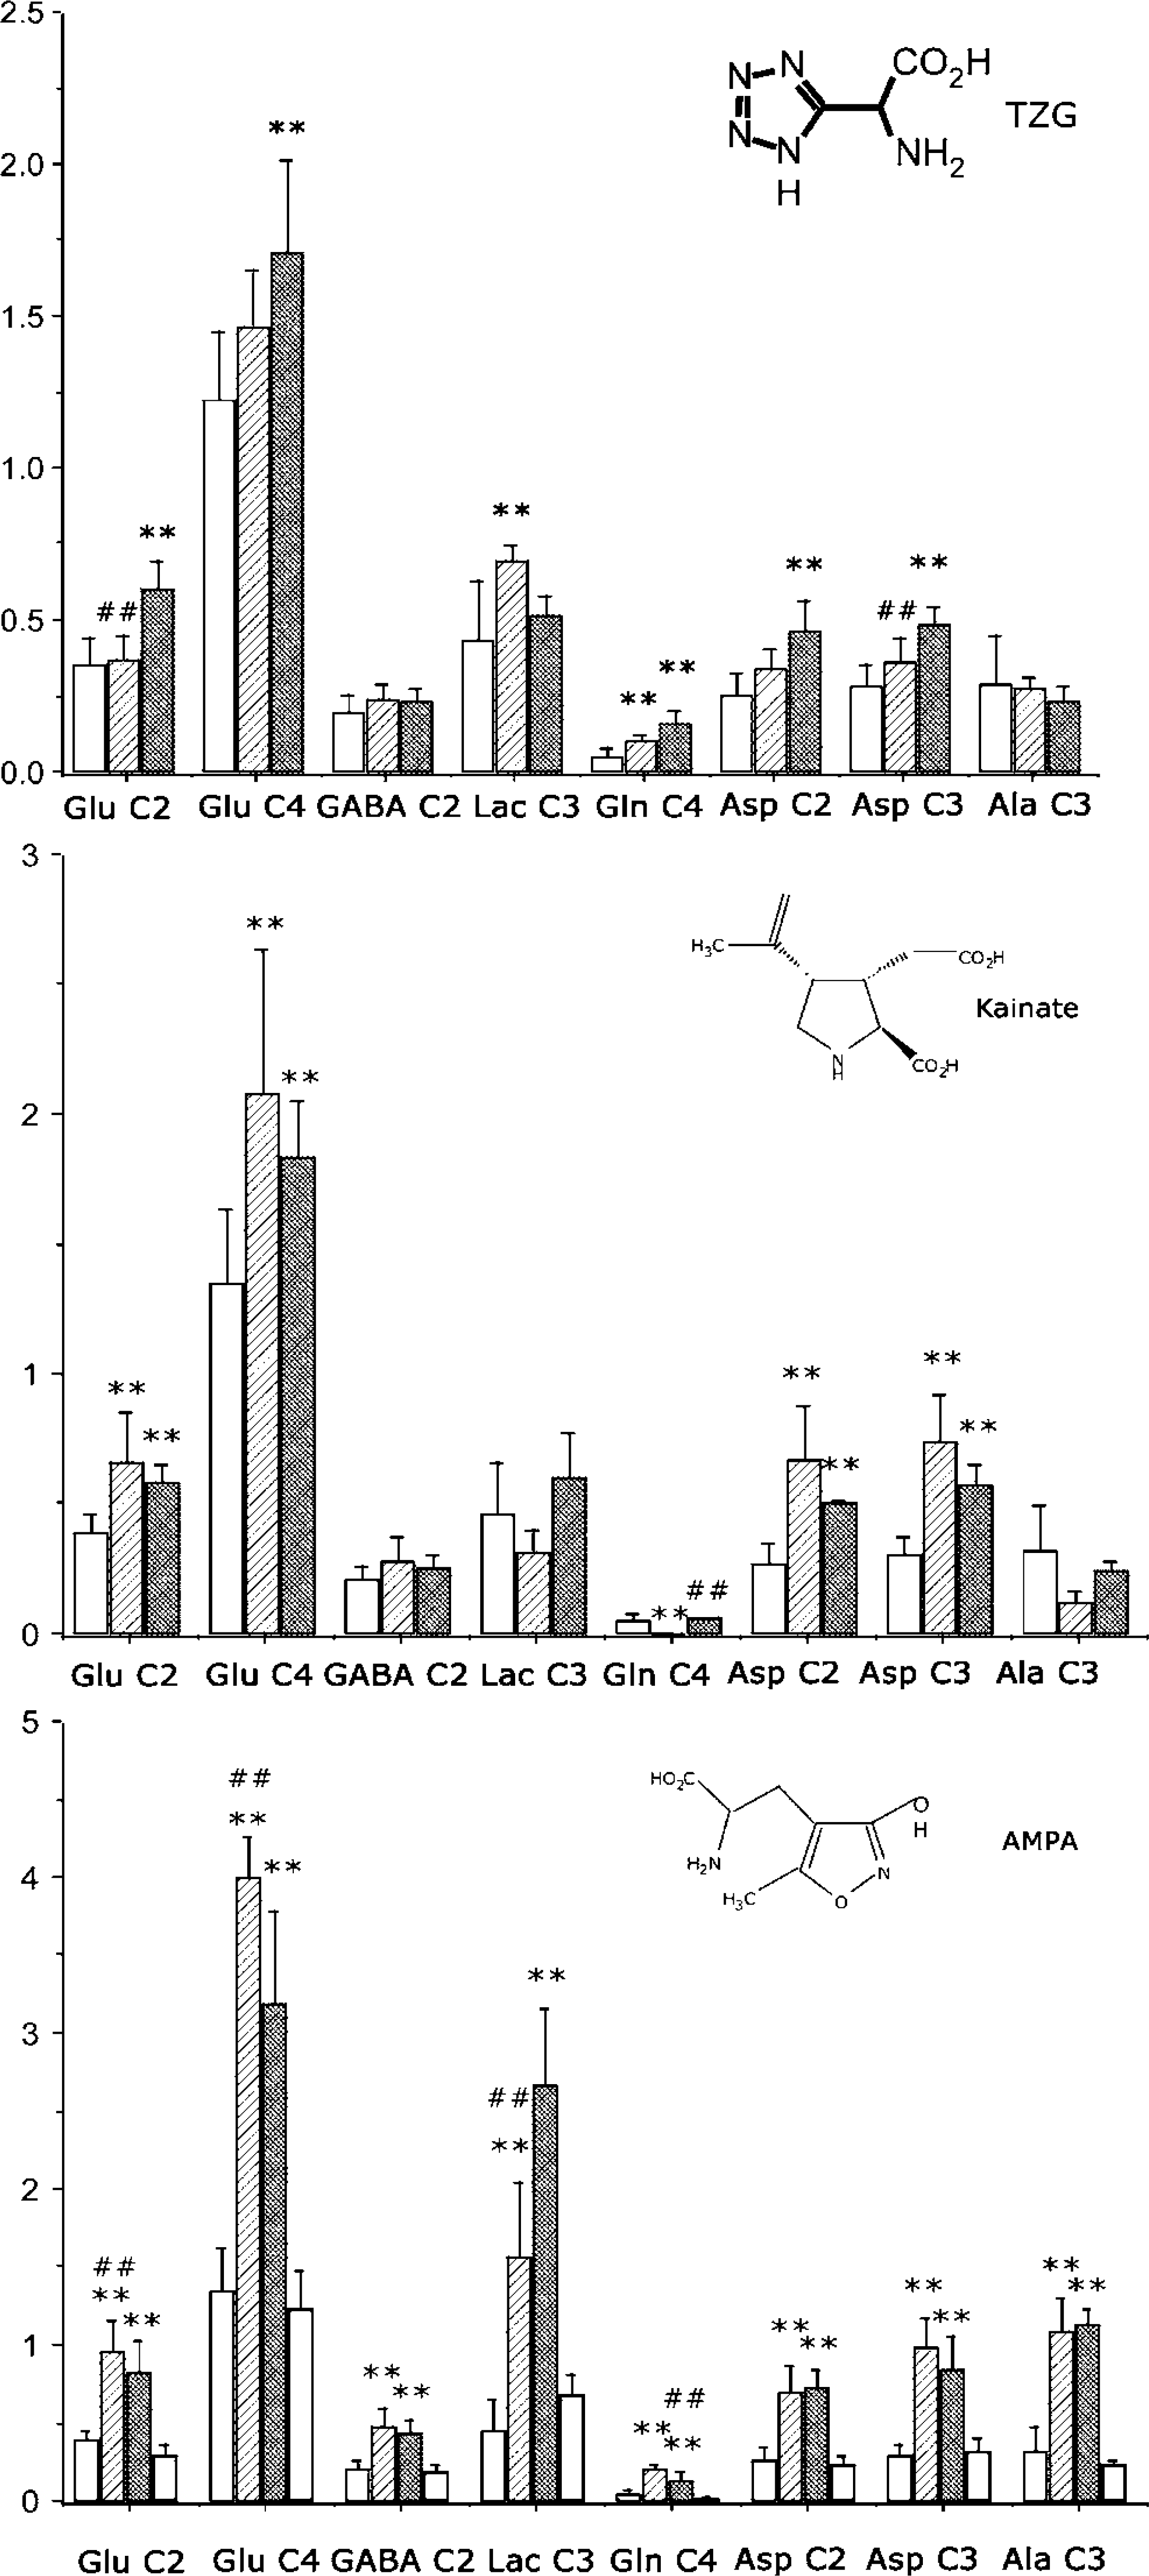
Effects of iGluR agonists on net flux of 13C in brain cortical tissue slices incubated 1 h with sodium [3-13C]pyruvate. Clear bars, control (N = 28); hatched bars, lower dose of ligand (N = 4); cross-hatched bars, higher dose of ligand (N = 4); grey bars, cyclothiazide (N = 4). Values shown are means, while error bars show standard deviations. *Significantly different from control; #significantly different from higher dose ligand. ‡Significantly different from cyclothiazide. *P < 0.05, **P < 0.01. TZG, (RS)-(tetrazol-5-yl)glycine; AMPA, (RS)-α-amino-3-hydroxy-5-methyl-4-isoxazolepropionic acid.
At 50 μmol/L, kainate produced significantly increased net flux into Glu C2 and C4 and Asp C2 and C3 compared with control (Figure 2). The total metabolite pools of aspartate and glutamine were also increased (Table 1).
(RS)-α-Amino-3-Hydroxy-5-Methyl-4-Isoxazolepropionic Acid
The AMPA receptor desensitising agent cyclothiazide at the concentration used in this work had no significant effects on net flux of 13C into any isotopomer measured and also had no effect on metabolite pool sizes, indicating a neutral effect of this compound (Figure 2). Addition of AMPA (5 μmol/L) resulted in large increases in the net flux of 13C into all isotopomers measured (Figure 2), and significant increases in the metabolite pool sizes of lactate, glutamate and alanine. Increasing the concentration of AMPA to 50 μmol/L further stimulated net flux of 13C into lactate C3, but resulted in no further increases in net flux into other isotopomers measured. By contrast, the metabolite pool sizes of lactate, glutamate, GABA, glutamine and aspartate were further increased, although the total pool size of alanine fell in comparison with that recorded in the presence of 5 μmol/L AMPA (Table 1).
Principal Components Analysis of Ionotropic Glutamate Receptor Ligand Effects on Metabolic Activity
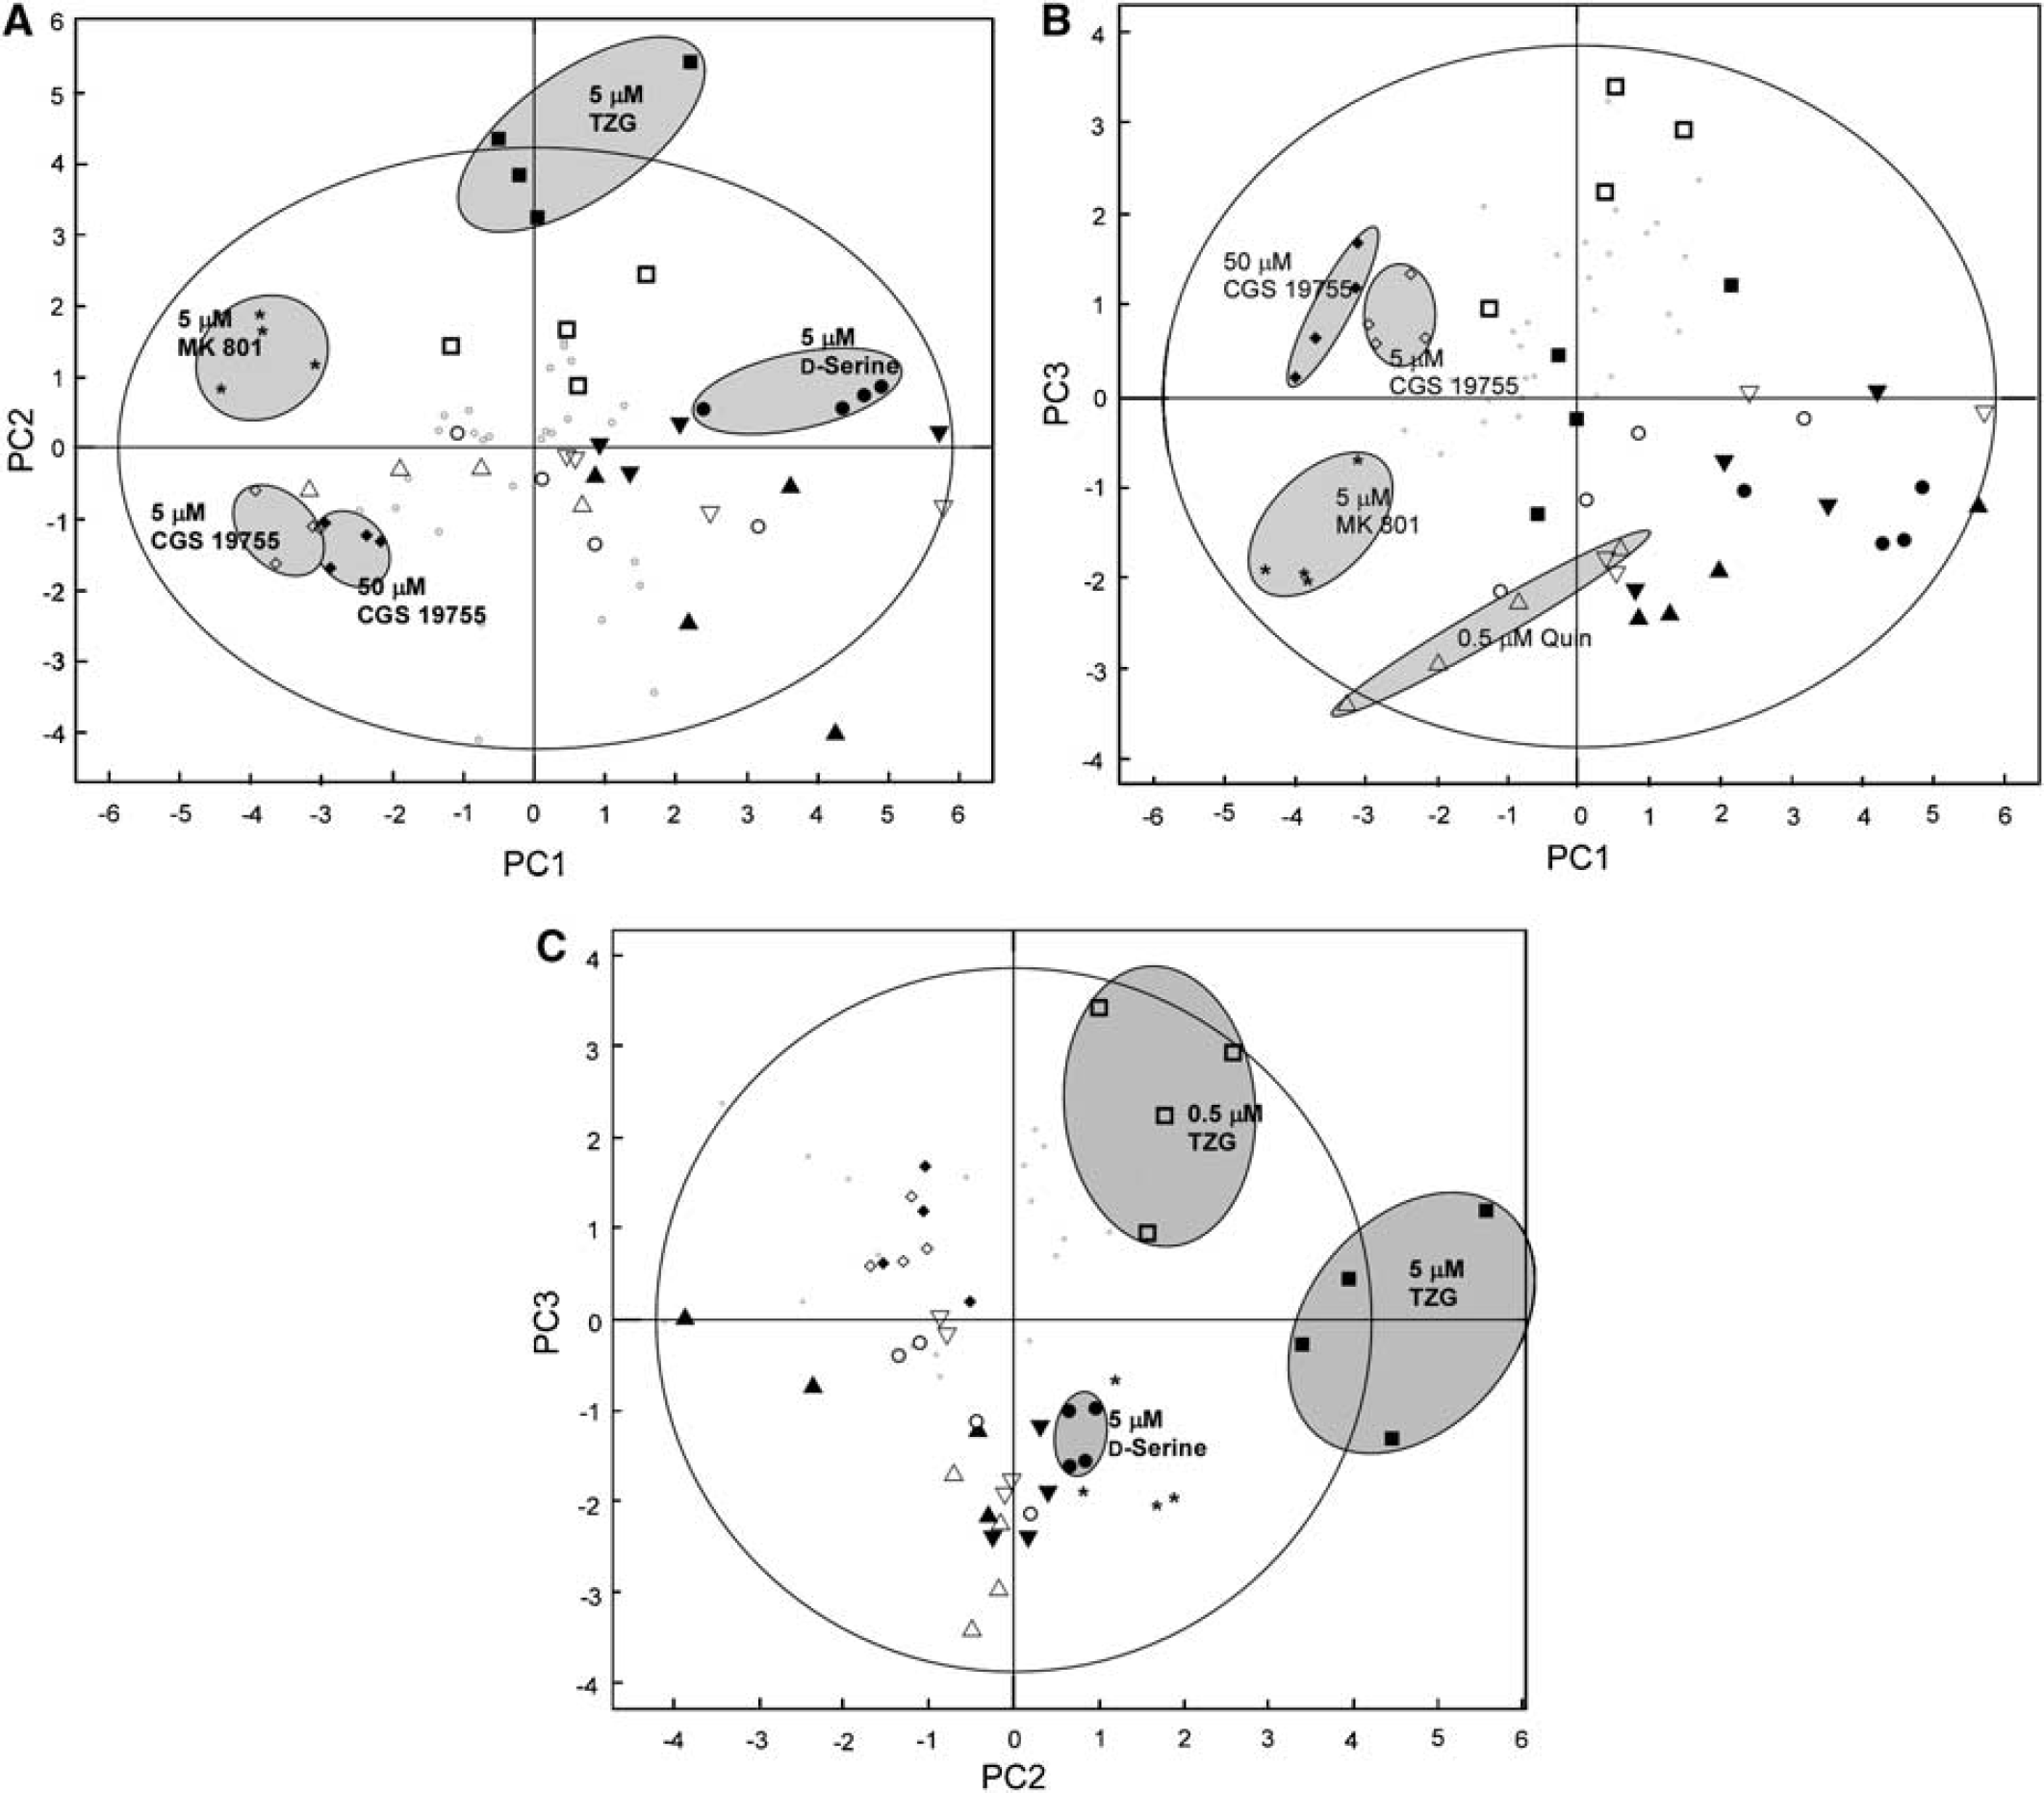
Using PCA to analyse all doses of the NMDA ligands (TZG, Quin, D-Ser, MK-801, CGS 19755 and KynA) examined in this study produced three PCs representing 76% of the total data (Figure 3A, Table 2). Examining the scores plot of the analysis, a combination of PC1 and PC2 separated both doses of the NMDA antagonist CGS 19755 from the other drugs and the control data group, and this was caused by relative increases in total lactate, glutamate and glutamine. MK-801 was separated from CGS 19755 along PC2 and from the control group along PC1, with this being caused by decreases in the total concentrations of glutamate, GABA and alanine. The low concentration of D-Ser, and both concentrations of KynA and Quin clustered together, being characterised by increased labelling at Asp C2 and C3 and Glu C2 and C4, and increases in total concentrations of lactate, glutamate and alanine. Some separation was apparent for the high-dose D-Ser group, reflected by higher scores along PC1, and this resulted from increased labelling in Asp C2 and C3 and Glu C2 and C4 compared with the lower dose. A third PC showed separation of both doses of TZG from the rest of the data (Figure 3B), but D-Ser, Quin and KynA remained clustered together.
Constituents of each principal component from multivariate statistical analysis
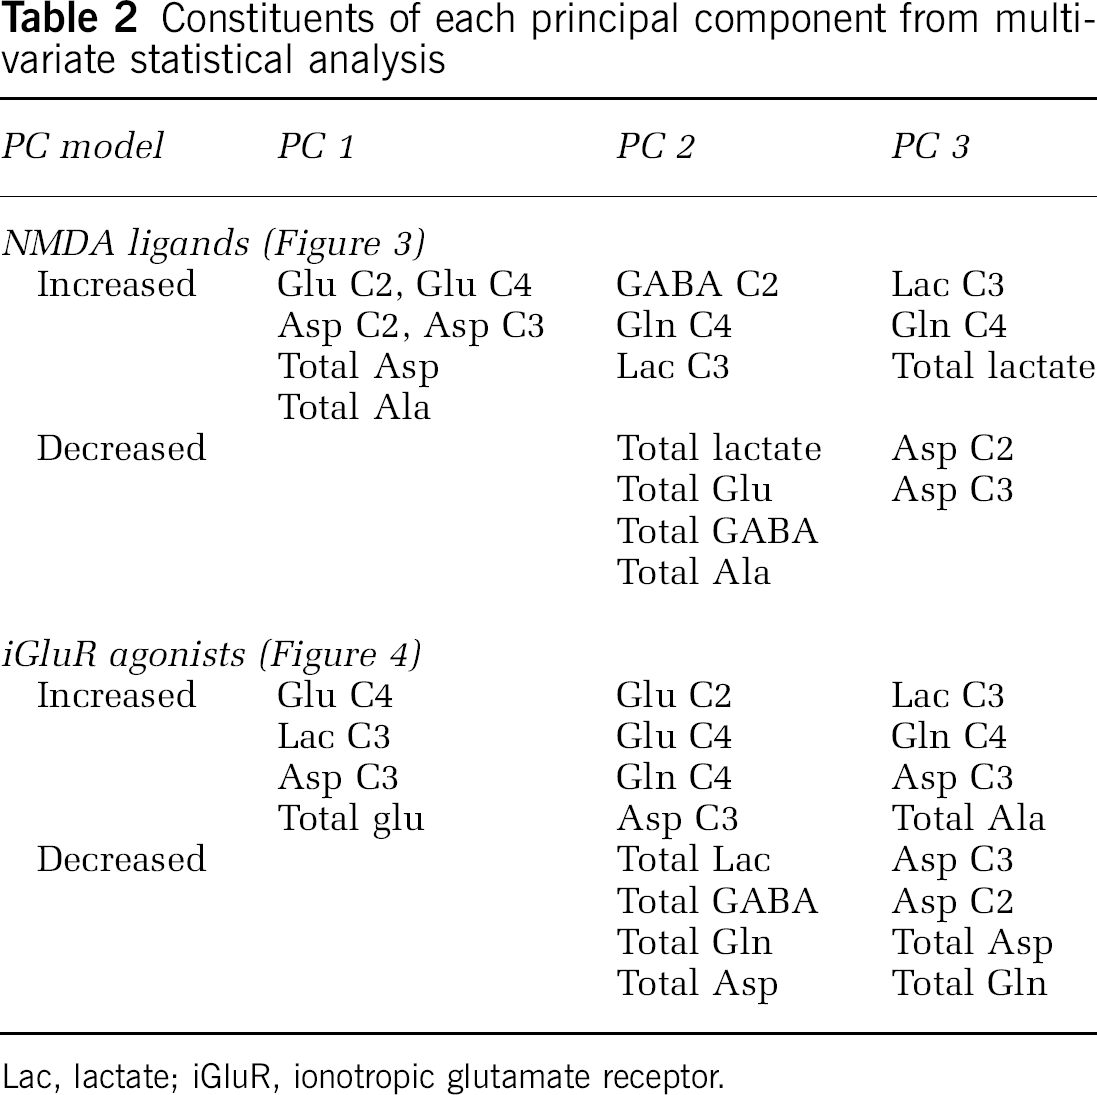
Lac, lactate; iGluR, ionotropic glutamate receptor.
Principal components analysis of labelling and total metabolite concentrations for NMDAR ligands. (
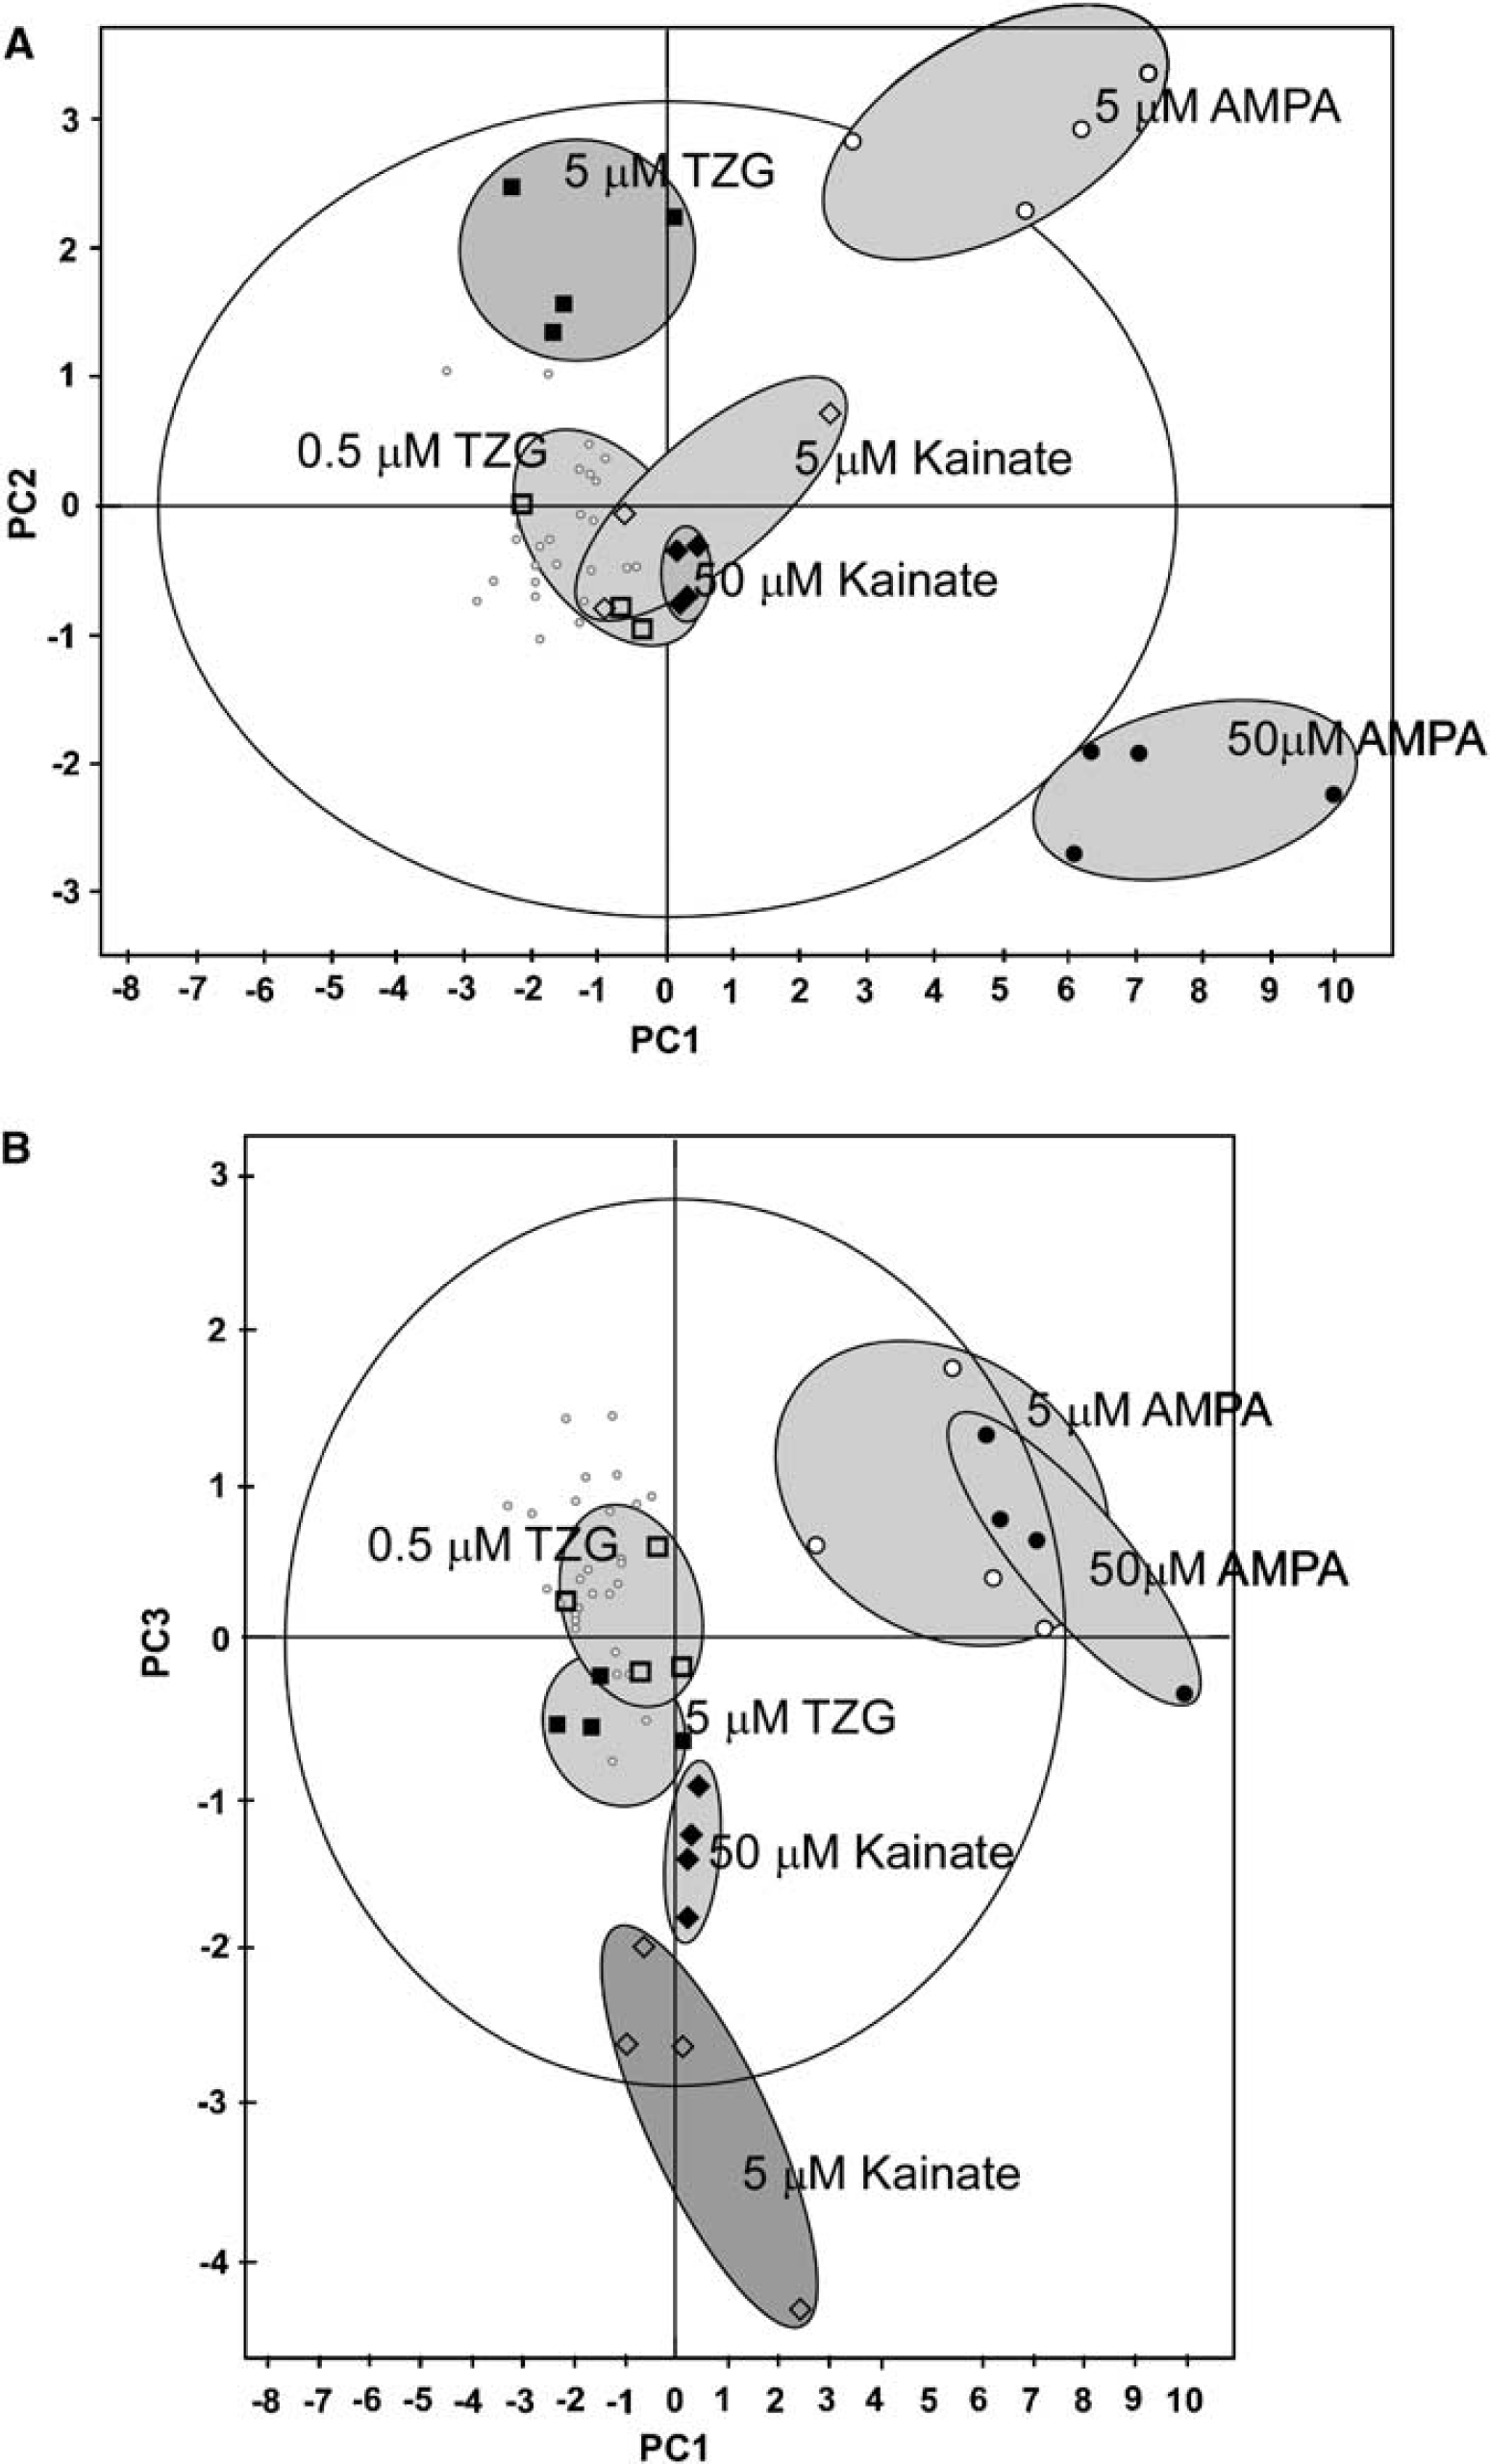
Results from both doses of TZG, kainate and AMPA + cyclothiazide to compare the action of agonists at NMDA, kainate and AMPA receptors, respectively, were summarised across 85% of the data by three PCs (Figure 4, Table 2). While both doses of AMPA + cyclothiazide clustered away from the control group along PC1, they were both separated from each other along PC2. The low dose of AMPA/cyclothiazide was characterised by a metabolic profile, where the labelling of Glu C2 and C4 and Asp C3 was increased, while the higher dose was characterised by increases in total glutamate, GABA and lactate. Of the other drugs, only the high-dose TZG was clearly separated along PC2, caused by an increase in Gln C4 and decreases in glutamine and GABA. The lower and higher doses of kainate were separated from low-dose TZG, and from each other, by PC3 (Table 2, Figure 4B).
Principal components analysis of the 13C labelling and total metabolite concentrations for iGluR agonists. (A) The first two principal components of the analysis, and clear clustering of the controls, both doses of AMPA, and high-dose TZG. (B) The first and third principal components of the analysis, and clear separation of the two different doses of kainate. (C) The second and third principal components of the analysis, and clear separation of 5.0 μmol/L D-Ser, and 0.5 μmol/L from 5.0 μmol/L TZG. Key: grey circles, control; open squares, 0.5 μmol/L TZG, dark squares, 5.0 μmol/L TZG; open diamonds, 5 μmol/L kainate, dark diamonds, 50 μmol/L kainate; open circles, 5.0 μmol/L AMPA, dark circles, 50 μmol/L AMPA. The large outer ellipse represents 95% confidence interval (Hotellings score). The shaded ellipses define subset groupings to make the figure more readable and are not representative of any statistical certainty.
Given the possibility that KynA may have action at iGluR other than the NMDAR (Birch et al, 1988a), we also applied PCA to all concentrations of the three NMDA ligands KynA, Quin and D-Ser, and the broad-range agonist kainate (data not shown). We did not include AMPA in this analysis as the metabolic profile generated by this ligand was so patently different (Figure 2C) that these differences would dominate a multivariate analysis of a data set with this group included. The metabolic changes were summarised in two PCs, representing 56% of the variation across this group. PC1 separated all the agonists, regardless of dose, from the control group. This was caused by increased labelling in Glu C2 and C4 and Asp C2 and C3. In addition, both doses of D-Ser and KynA closely clustered together, with this being caused by increased Ala C3 labelling. The high kainate dose also showed a tight cluster caused by an increase in total glutamate, and decreases in Ala C3 and Gln C4.
Intracellular [K+]
All ligands tested had no significant effect on intracellular [K+], which were all within normal values (data not shown).
Discussion
N-Methyl-D-Aspartate Receptors
The metabolic profile generated by addition of the potent NMDAR agonist TZG was consistent with TZG causing an increase in net flux into the Krebs cycle (increased net flux into Glu C2 and C4, Asp C2 and C3), and increased glutamate/glutamine cycling (increased net flux into Gln C4). Closer inspection of the experiment with TZG against its concurrent control experiment (N = 4) revealed that TZG caused significantly increased net flux into Gln C4, Ala C3 and Lac C3. These differences in Ala C3 and Lac C3 are not apparent when the data set is considered against the entire control set (N = 28) due to increased spread in the control data. We have mentioned them here, though to aid the interpretation of the increase in net flux into Gln C4. As described previously (Rae et al, 2003, 2005a), alanine acts as an ammonia carrier for return of ammonia to glia consequent to glutamate/glutamine cycling, and lactate has also been shown to act as a carbon backbone shuttle for the three carbons of alanine. Taken together, therefore, increased Gln C4, Ala C3 and Lac C3 labelling represents increased net flux through the glutamate/glutamine cycle.
The glutamine pool, increased by low-concentration TZG, is mostly derived from a large (mostly neuronal) compartment (Rae et al, 2003, 2005a), which equilibrates slowly with 13C turnover. Glutamine is transported into and out of this pool by System N and the activity of this transporter has been shown to be affected by glutamate (Bröer et al, 2004). The increased glutamate/glutamine cycling seen in the presence of TZG may therefore be responsible for the increased size of the glutamine pool; this pool was decreased by CGS 19755, which has the opposite effect on glutamate/glutamine cycling.
At the higher concentration of TZG (5 μmol/L), there were also significant decreases in metabolic pool sizes, indicating that the increased metabolic activity was unsustainable and was causing metabolic ‘exhaustion’. Whether this is a feature unique to the brain slice (through loss of metabolites into the large buffer volume) or whether this can be replicated in vivo remains to be seen. TZG is a known substitute for NMDA, producing a similar neuropharmacological response, although with higher potency (Schoepp et al, 1994), and a similar behavioural response (Grech et al, 1995). The metabolic profile presented by this agonist represents what we would have predicted to be a ‘typical’ NMDA agonist response, with increased metabolic activity and increased glutamate/glutamine cycling. It is interesting that the lower concentration of TZG failed to separate from the control data using the principal components which accounted for the most variability in the data, both for comparisons with other NMDAR ligands (Figure 3) and other iGluR agonists (Figure 4), indicating that the effect of TZG is highly specific to that ligand. The effects of TZG were separated from the other NMDA ligands along PC2 with positive weightings (Figure 3), but no other ligands were separated in this direction by PC2, reinforcing this conclusion.
By contrast, the NMDAR antagonist CGS 19755 produced decreased net flux into Glu C4, Asp C2 and C3, indicative of decreased net Krebs cycle flux. It also produced a decrease in net flux into GABA C2, which might be indicative of decreased activity in GABA-ergic neurons, or, more probably, occurs as a flow-on effect of decreased glutamate/glutamine cycling, as glutamine is the major carbon backbone source for GABA synthesis (Patel et al, 2001; Peng et al, 1993; Rae et al, 2003; Tapia and González, 1978). The effects of this antagonist were also unique and separable from those of other NMDAR ligands (Figure 3).
The strong downregulation of metabolic activity caused by the noncompetitive NMDAR antagonist MK-801 (Figure 1, Table 1) is illustrative of the significant normal contribution made to brain metabolism by constitutive NMDAR activity. Metabolic activity in brain slices is generally considerably less than in intact cortex (Griffin et al, 1999) and is considered largely to represent ‘housekeeping’ activity. It is apparent from this experiment that a considerable amount of this ‘housekeeping’ activity is modulated via the NMDAR. Further, it suggests that caution should be exercised in the employment of MK-801 in conjunction with other ligands, as it has strong metabolic sequelae of its own and does not merely block the effect of other NMDA ligands.
Kainate
Addition of kainate to brain slices produced different metabolic consequences depending on the concentration used. At lower concentrations, kai-nate increased metabolic activity, but decreased glutamate/glutamine cycling, while the higher concentration of kainate had no effect on glutamate/glutamine cycling, while still increasing net flux into the Krebs cycle. The effect of either concentration of kainate on metabolism was clearly separated from that of TZG and AMPA (Figures 2 and 4) indicating that this metabolomic approach is a sensitive discriminator of the subtypes of iGluR.
There are a number of possible explanations for the different metabolic effect of the two concentrations of kainate. Kainate receptors are found both pre- and post-synaptically and are a heterogeneous subpopulation of iGluR (Lerma, 2003). It might be that the lower concentration of kainate is activating mostly kainate receptors, while the higher concentration is also active at AMPA receptors. It has also been reported that kainate receptors are responsible for two distinct and opposing mechanisms; upregulation of spontaneous transmissions and downregulation of evoked transmissions via modulation of GABA release (Maingret et al, 2005). These two opposing effects have been shown to occur via a different subset of kainate receptors. It might be the case that the decreased glutamate/glutamine cycling seen in this work with the lower kainate concentration arises from the effect of kainate on the GABA-ergic synapse.
(RS)-α-Amino-3-Hydroxy-5-Methyl-4-Isoxazolepropionic Acid
Addition of AMPA in the presence of the desensitising agent cyclothiazide resulted in a sustainable and significant increase in metabolic activity (as illustrated by significant increases in net flux into Glu C2 and C4, and Asp C2 and C3), and in glutamate/glutamine cycling (as illustrated by increased net flux into Gln C4, Ala C3 and Lac C3). Unlike TZG, Quin or KynA, this ligand also stimulated net flux into the metabolic pool labelling GABA C2. This might be due to label equilibration with the Gln C4 pool, since this pool is also greatly increased, but this explanation seems less likely as it does not automatically follow that the Gln C4 and GABA C2 compartments equilibrate. The fact that they do not is illustrated, for example, by the fact that net flux into Gln C4 is increased by TZG but this ligand has no effect on net flux into GABA C2.
The fact that AMPA stimulated a large range of metabolic pools is illustrated by the degree of fractional enrichment of Glu C4 (47.1 (9.8)% with 5 μmol/L AMPA; 25.9 (3.4)% with 50 μmol/L AMPA). The effects of AMPA were easily separated from those of TZG and kainate by our metabolomic approach (Figure 4, Table 2), the ease of separation indicative of the strong effect of AMPA on metabolism.
Kynurenine Pathway Metabolites
Quinolinic acid has been reported to be an agonist at NMDAR and to possess specificity for NR2-containing subunits (DeCarvalho et al, 1996). Endogenous in the brain, it has been reproducibly reported to be neurotoxic, both in vivo and in culture (Kim and Choi, 1987; Schwarcz et al, 1983). Although levels of Quin in the brain are reported not normally to rise above 1 μmol/L, millimolar levels have been reported in various infectious disease states (Heyes et al, 1996). Quinolinic acid has been reported to stimulate basal glutamate release and to inhibit glutamate uptake into astrocytes and synaptic vesicles (Tavares et al, 2000, 2002). This inhibition of glutamate uptake has also been reported by others (de Oliveira et al, 2004) and been shown to be blocked by guanosine. However, the metabolic profile generated by Quin is not consistent with that generated by glutamate transport inhibitors, such as L-anti-endo-3,4-methanopyrrolidine dicarboxylate (Rae et al, 2000).
The metabolic effects of Quin were quite plainly different from those of the classical NMDAR agonist, TZG (Figures 1 and 3), suggesting that its actions might be through a different subset of NMDAR, or may include activity at other sites.
Kynurenic acid is largely produced in astrocytes (Fu et al, 1992) and has been reported to have antagonist activity at all iGluRs (Birch et al, 1988a), with the mechanism of action at NMDAR most likely mediated via the glycine-binding site (Birch et al, 1988b). It has generally been reported to be neuroprotective at values ranging from 1 to 1000 μmol/L (Stone, 2000), although the precise nature of this neuroprotection has been questioned (Obrenovitch and Urenjak, 2000), with the suggestion that it might be mediated through a mechanism not involving iGluR (Urenjak and Obrenovitch, 2000). Recently, it has been shown that KynA might be active at nicotinic acetylcholine α7-containing receptors (Alkondon et al, 2004), with subsequent effects on dopaminergic neurotransmission (Rassoulpour et al, 2005).
Certainly, the metabolic profile generated by addition of KynA was not consistent with a solely NMDAR antagonist role for this ligand, producing a net flux pattern similar to that seen with Quin (Figures 1 and 3) and with the lower concentration of D-Ser. The similarity to the profile generated by D-Ser (Figures 1 and 3) supports the suggestion that KynA acts via the glycine binding site.
D-Serine
Activation of NMDAR requires occupation of both the glycine- and glutamate-binding sites, and evidence has emerged that the endogenous amino acid D-Ser is up to three times more potent than glycine at certain combinations of NR1 and NR2 subunits (Matsui et al, 1995). D-serine is localised primarily to a discrete population of glial cells near NMDARs (Schell et al, 1997) and the racemerase responsible for its synthesis colocalises with glutamine synthetase and glial fibrillary acidic protein (GFAP) (Schell et al, 1995), leading to the suggestion that it acts as an astrocytic modulator of neuronal function (Miller, 2004).
The metabolic response to addition of D-Ser was strong and largely represented stimulation of net flux through the Krebs cycle (increased flux into Glu C2 and C4 and Asp C2 and C3), consistent with stimulation of a large, cell body compartment (Rae et al, 2003). The increased net flux into GABA C2, however, was unique to D-Ser of all the NMDAR ligands used in this study. This was not an indirect effect due, for example, to increased net flux of the GABA precursor glutamine (Rae et al, 2003) as the net flux into this compound was not significantly changed, suggesting that the increased net flux into GABA C2 might be due to an effect elicited by D-Ser on GABA-ergic neurons.
While the activity of NMDARs is dependent on receptor composition, the requirement of NR1 subunits for active receptor function provides glycine-binding sensitivity to all active NMDARs, as glycine binds to the NR1 subunit (Danysz and Parsons, 1998). Glycine has two roles at the NMDAR; the first is to allow activation of the receptor by subsequent binding of glutamate, and the second is to potentiate NMDAR activity by reducing desensitisation (Danysz and Parsons, 1998). Although it has been suggested that the glycine-binding site of the NMDAR in vivo is fully occupied (Mothet et al, 2000), recent evidence suggests that this is not the case (Chen et al, 2003). Indeed, in this work, we showed that 0.5 μmol/L D-Ser produced significant metabolic responses (Figure 1), and further addition of D-Ser to 5.0 μmol/L had an additive effect. The brain slice has been criticised, validly, as a suitable preparation for study of this aspect of NMDA activity because of the release of endogenous glycine and glutamate by the physical trauma of slice preparation (Danysz and Parsons, 1998). However, it is clear from the significant metabolic stimulation that occurred on addition of D-Ser, that constitutive stimulation from endogenous glycine was not sufficient to mask any effect of exogenous D-Ser.
It has been reported that addition of kainate causes release of D-Ser from astrocytes (Schell et al, 1995), suggesting that activation of these receptors results in enhancement of the NMDAR response. However, PCA analysis of the data from D-Ser and kainate showed clear separation of these compounds across PC1 (data not shown), suggesting that there is little overlap in the metabolic responses to these two ligands.
In summary, these results are illustrative of the plethora of metabolic sequelae subsequent to activation of glutamate receptors, and underline how subtlety in glutamatergic neurotransmission might be achieved. It is possible using this approach to discriminate between the different iGluRs, as well as between ligands acting on different sites at the NMDAR. While only some of the currently available receptor specific ligands are centrally active, there is good correspondence between the metabolic ramifications reported in the brain tissue slice with those so far seen in vivo (Brenner et al, 2005; Ichord et al, 2001), indicating that this approach has a broad appeal. Analysis of the effect of iGluR function on brain metabolism therefore represents a novel approach to the study of the diversity of receptor function.
Footnotes
Acknowledgements
The authors have no financial conflict of interest to declare.