
Abstract
The complexity of spontaneous cerebral blood volume (CBV) fluctuations can emerge from random, fractal, or chaotic processes. Our aims were to define the contribution of these patterns to the observed complexity and to evaluate the effect of age and gender on it. The total hemoglobin content as the measure of CBV was monitored by near-infrared spectroscopy on volunteers (men n = 19, age = 20 to 78 years; women n = 23, age = 21 to 79 years). Random and fractal patterns were distinguished by the spectral index (β). Chaos was identified by surrogate analysis of the correlation dimension (a static chaotic parameter, the dimension of the correlation integral) and the largest Lyapunov exponent (a dynamic chaotic parameter, the rate of exponential divergence of the system states from a perturbed initial condition over the chaotic attractor). In spontaneous CBV fluctuations, both fast random and slow fractal dynamics are present separately in their spectra by a cutoff frequency, f′. Below f′ the pattern is fractal, in that power rises inversely with frequency as 1/fβ. f′ decreases with age in men and women alike (F1: up to 0.12 ± 0.06 Hz versus F2: up to 0.05 ± 0.04 Hz at P = 0.015, and M1: up to 0.16 ± 0.05 Hz versus M2: up to 0.11 ± 0.04 Hz at P = 0.044). Neither pre- nor postmenopausal age groups (1 and 2, respectively) showed a lowβ gender difference. Surrogate analysis showed that CBV dynamics cannot be characterized on the grounds of deterministic chaos. Cerebral blood volume fluctuates in a complex, bimodal manner in humans, in that the fast dynamics has no structure, while the slow dynamics exhibits a self-similar, that is, fractal temporal structure. The range of fluctuation amplitudes produced by fractal dynamics is always larger than that of random fluctuations, and it shrinks with an altered structuring in aging women only.
Introduction
Earlier, in a group of young volunteers using near-infrared spectroscopy (NIRS) (Jöbsis, 1977), we showed that cerebral blood volume (CBV) spontaneously fluctuated while being in a physical and mental state of rest (Eke and Hermán, 1999). Fractal time-series analysis (Bassingthwaighte et al, 1994) of the high-definition, extended NIRS records revealed a complex, self-similar, that is, fractal pattern spanning across many temporal scales, characteristic of one of three possible processes capable of producing such a noise-like pattern (Eke and Hermán, 1999). The other two are low-dimensional deterministic chaos seen in vasomotion (Griffith and Edwards, 1993; Lacza et al, 2001), and the lack of either fractal correlation or chaotic determinism, namely random noise (white noise).
Simple dynamics in CBV in the form of spontaneous slow-frequency oscillations have also been reported using NIRS, although in records of short duration (Elwell et al, 1999; Schroeter et al, 2004). Recently, in female subjects within short windows of observation, vasomotion-induced spontaneous CBV oscillations were shown to be centered around approximately 0.02 and 0.1 Hz. The peak at 0.1 Hz was shown to disappear with age because of the declining reactivity of vascular smooth muscle cells and increased stiffening of the cerebral vessel wall (Schroeter et al, 2004).
We hypothesize that (i) the long-term pattern of spontaneous fluctuations in cerebrocortical hemodynamics carries information on the integrity of the underlying mechanisms adjusting vascular calibers along the monitored vascular tree, and (ii) properly chosen quantitative descriptors of this complex pattern can assess signal structuring in a manner that can then be correlated with age and gender, known correlates of cerebrovascular pathology, most notably ischemic and hemorrhagic stroke (Murphy et al, 2004).
Stroke is a major public health problem throughout the world, whose incidence increases with age. Not only age but—because of female reproductive hormones and yet to be understood mechanisms, gender has an impact, too, in that age-specific mortality for ischemic stroke was found to be lower for women than for men under 64 year of age, but was higher among older women aged over 65 years of age (AHA, 2002; Murphy et al, 2004). The American Heart Association (AHA, 2002) reports that overall more women than men have stroke, an observation that is often overlooked.
Age-related and gender-specific analysis of the spontaneous, resting fluctuations seen in extended NIRS records is still missing, although it is clearly needed, for it can provide information about the resting cerebral hemodynamics that can be altered by age and gender.
Accordingly, our aims were (i) to expand on our first observation of human resting long-term complex CBV fluctuations (Eke and Hermán, 1999) using refined and numerically tested fractal tools (Eke et al, 2000, 2002) and methods of deterministic chaos to determine as to which of these two approaches can offer the model for the observed complexity seen in extended records, and (ii) to investigate the impact of aging and gender on these complex CBV dynamics.
We used NIRS because it is uniquely suitable to capture the dynamics in CBV in a noninvasive manner (Figure 1). NIRS is known to be particularly sensitive to signals from the microvasculature (Liu et al, 1995), which favors the early detection of changes in the fluctuation pattern that would result from age-related degeneration of the cerebral vasculature affecting the microvasculature before larger vessel segments (Schroeter et al, 2004).
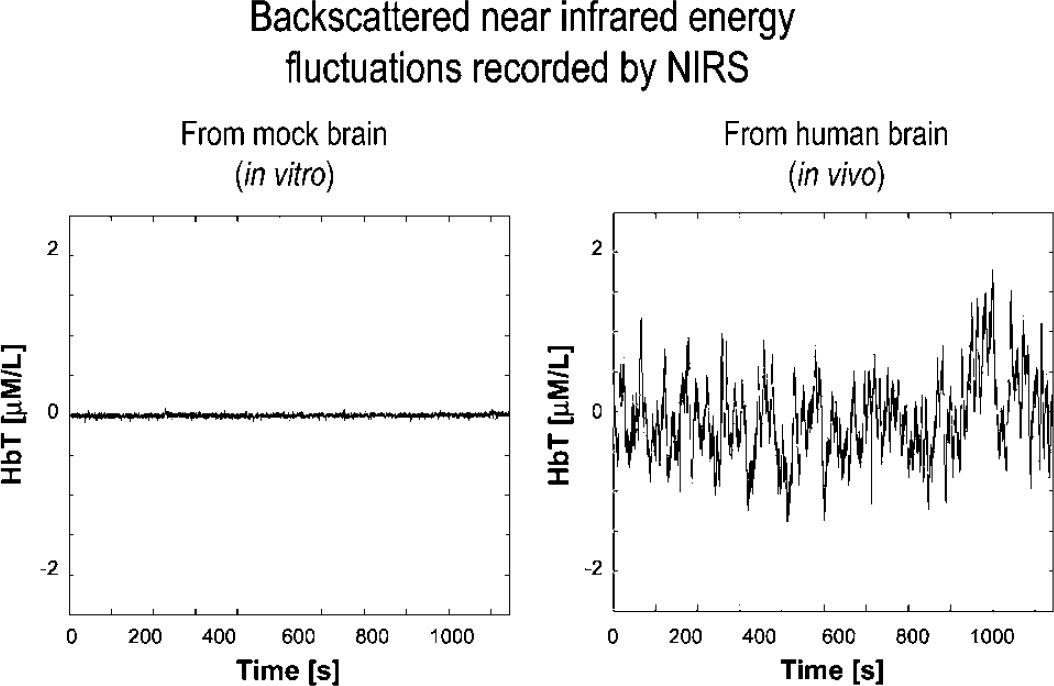
Backscattered near-infrared energy fluctuations recorded by near-infrared spectroscopy (NIRS). The signal from the total hemoglobin channel (HbT = Hb ± HbO2) was recorded from the optode placed over the mock brain (left) and the forehead of a human subject (right) for 1,000 secs. Values are plotted on the same scale to allow for a direct comparison of the infrared energies. Note that fluctuations in NIR energy because of measurement noise (left) span only a fraction of the range of the signal detected from the human brain cortex (right). The in vivo variations are attributed to fluctuations in the total hemoglobin content, and hence to that of CBV.
We employed fractal and chaotic approaches to analyze the complex CBV fluctuations for the following reasons. On the one hand, we could rightfully assume that the numerous vessel segments within the region of interest (ROI) sampled by NIRS created a system with a large number of determinants and a high degree of freedom, whose overall behavior can be characterized by fractal correlation among the temporal events (Kaplan and Glass, 1995). However, the use of chaotic time-series analysis was called for since the low-dimensional chaotic nature of vasomotion has been shown in isolated vessel segments (Griffith and Edwards, 1993; Lacza et al, 2001), and because vasomotion is the key factor generating an intrinsic rhythm producing vasoconstriction/vasodilation cycles (Griffith and Edwards, 1993; Nilsson and Aalkjaer, 2003).
Materials and methods
Theory
Near-infrared spectroscopy: According to the principle of continuous wave NIR spectroscopy (cwNIRS), backscattered light intensities were measured at wavelengths of 775, 830, 849, and 907 nm by an NIRO 500 Cerebral Oxygen Monitor (Hamamatsu Photonics, Hersching, Germany) with a 4 cm interoptode distance (the distance between the source and detector fibers). The sampling volume of the NIRS measurement is determined by the interoptode distance and the diffusion path of the photons injected into the brain cortex at the source and collected at the detector fiber bundle. It is known to be banana shaped as shown by Monte Carlo simulation (Chance, 1994; Hiraoka et al, 1993). From the optical density (OD) of the tissue calculated as the log ratio of incident and backscattered light intensities at a given wavelength, the modified Beer-Lambert law yields concentrations of the main chromophores, the oxygenated (HbO2) and deoxygenated (Hb) forms of hemoglobin and the cytochrome aa3 (CHb, CHbO2, CCaa3, respectively).
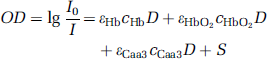
where εHb, εHbO2, and εHbO3 are the respective specific extinction coefficients, D is the optical pathlength (for a 4 cm interoptode distance, it is 23.72 cm), and S is the scattering loss.
Fractal and chaotic time-series analyses: Fractal and chaotic time-series analyses are suitable to determine the presence of a complex order underlying the seemingly random fluctuations of physiologic parameters as described in detail elsewhere (Bassingthwaighte et al, 1994; Eke et al, 2000, 2002; Kaplan and Glass, 1995). Briefly, fractal analysis is carried out to show the presence of a self-similar order among a large number of simultaneous events creating a system with a high degree of freedom (Eke et al, 2002). The purpose of applying chaotic analysis, which is targeted at complex systems with a low degree of freedom created by a few coupled processes, is not to identify their differential equations, but their number only, which can be estimated by the dimension of the phase-space attractor (see correlation dimension; Grassberger and Procaccia, 1983). In addition, by calculating the spectrum of the Lyapunov exponents, the dynamics of the system's evolution in the state or phase space can be captured (Wolf et al, 1985). Surrogate data analysis (Theiler et al, 1992) complements these approaches by being suitable for verifying the presence of determinism between subsequent events of the temporal process.
Methods
The total hemoglobin concentration change (HbT) was recorded by the NIRO 500 unit at a rate of 2 Hz. As recommended by Eke et al (2002), an extended record of 214 (N = 16384) samples was collected for each subject in a session of approximately 2.5 h. The source and detector fibers were secured in a rubber pad. The optodes (a set (pair) of optical fibers connected to the light source and the detector) were mounted just under the hairline over the forehead with a minimal but adequate pressure to secure it in place without creating potentially painful pressure points in the skin. The cranium was shielded from ambient light by a black cloth. Measurement noise was determined by placing the optode over a slab of a mock brain, whose scattering (μs = 10.96 (1/mm)) and absorption (μa = 0.099 (1/mm)) coefficients were adjusted to match that of the human brain (courtesy of Professor Britton Chance, University of Pennsylvania, Philadelphia, PA, USA). Because the average tissue hematocrit in the ROI is constant in a steady state, HbT is proportional to CBV.
Subjects
After approval by the Local Research Ethics Committee, and obtaining informed written consent, 43 volunteers (23 women, 19 men, with an age distribution of 21 to 79 years and 20 to 78 years, respectively) participated in the study. Two groups for each gender were created: F1, incorporating premenopausal female subjects, and F2 including postmenopausal female subjects and their age-matched male groups (Ml and M2, respectively). The number of subjects and their age statistics are as follows: Fl (n = 16, 39.25 ± 10.64 years), F2 (n = 7, 60.71 ± 11.66 years), M1 (n = 11, 32.18 ± 9.62 years), and M2 (n = 8, 65.00 ± 9.61 years). The NIRS recordings were performed in a comfortable sitting position in an armchair with no head support. Given that the length of a session slightly exceeded 2.5 h, television viewing and reading were allowed to maintain an adequate level of alertness without invoking emotional or mental stress. Video recording was used to document that this in fact was the case. Subjects showing head dropping, etc., as a sign of becoming drowsy (a decreased level of alertness) were excluded from the study.
Data Processing and Analysis
NIRS data were dumped via the RS232 port of the NIRO instrument into a computer file. Deoxygenated (Hb) and oxygenated (HbO2) hemoglobin were calculated by multilinear regression across the OD data using the software supplied by the manufacturer, and HbT was obtained as Hb ± HbO2. Total hemoglobin concentration change time series were created by clipping the records to a length of 214 (N = 16,384) datapoints.
Fractal analysis: The power spectral density or periodogram method (Fougere, 1985) was used to analyze the HbT time series in their frequency domain. This method has been previously tested as a fractal tool for its applicability and precision (Eke et al, 2002). The power spectrum was calculated by the fast Fourier transform algorithm for a range of frequencies from 0.000122 to 1 Hz (the latter is the Nyquist frequency, fN, and the former is fmin = fN/{N/2}). Parabolic windowing and endmatching as signal preprocessing steps were used. The bimodal character of our spectra called for local power slopes to be determined for the range of high and low frequencies, separately (Figure 2); hence, the high frequencies were not excluded as recommended for the global slope version of the method (Eke et al, 2000, 2002). The frequency separating these two ranges (cutoff frequency, f′) was identified on visualized spectra. The temporal window corresponding to f′ was determined for each series to calculate the range of fluctuation amplitudes in the high frequencies. For each series, this window was applied in a contiguous manner, and the average range was calculated. The range of fluctuation amplitudes for the low-frequency dynamics was calculated as the difference between the value for the whole series and that of the high-frequency dynamics. The fractal time-series analysis was performed in a MatLab environment (The MathWorks Inc., Natick, MA, USA) by using our FracTool program code. The nearest-neighbor correlation coefficient, r1, was calculated for each group (Eke et al, 2000, 2002).
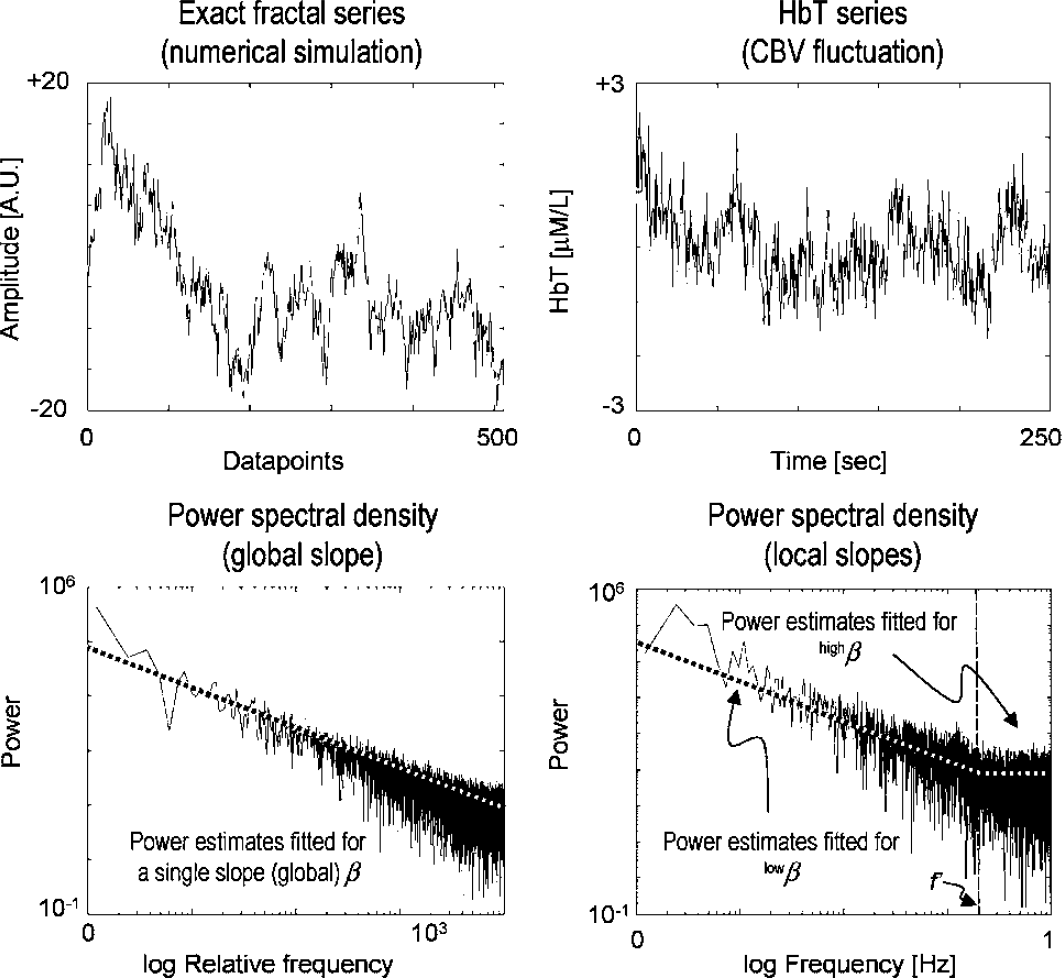
Examples of fractal time series when the self-similarity in the signal is exact (left) and when it is present in statistical distributions only (right). In either case, the slope of the periodogram fitted across a range of spectral estimates yields the spectral index, β, a measure of the 1/f β pattern, which is the fractal character of the signal. The spectrum of an exact monofractal has only a single slope, while the CBV signals in this study exhibited bimodal spectra (right) with a shallow slope for the high ranges and a steep slope for the low ranges of frequencies.
Chaotic analysis: Chaotic analysis was performed by the TSAS software (downloadable from ftp://psas.p.u-tokyo.ac.jp/pub) on the supercomputer of the Hungarian National Information Infrastructure Development Program (which consists of two Sun Fire model 15000 computers and one Sun Fire model 480R computer with a total of 196 parallel processor computing power). Ten surrogate series were created from each raw series and for each correlation dimensions and Lyapunov exponents were computed.
Statistical analysis: Descriptive statistics for the mean, standard deviation, and the calculation of significance by Student's two-tailed t-test were performed in Excel spreadsheets (Microsoft Corporation, Redmond, Washington, DC, USA).
Results
The fluctuation in the backscattered NIR energy with the optode placed over a slab of a mock brain is only a fraction of that detectable from the human forebrain at rest (Figure 1); hence, the former attributes to measurement noise, while the latter relates to fluctuation in the HbT of the brain cortex.
Fractal Analysis of Cerebral Blood Volume Dynamics
Spectra of extended records of spontaneous CBV fluctuations revealed a bimodal distribution of power from fmin to fN as captured in periodograms (Figures 2 and 3). Between fmin and f′, the pattern is self-similar, in that power increases according to an inverse power-law relationship with frequency, otherwise known as a 1/fβ pattern (Eke et al, 2002). The fractal range between fmin and f′ becomes narrower with age (Figures 3 and 4, upper left). A random pattern was found above f′ (Figure 2), which expands into lower frequencies with age (Figure 3). In the pre- and postmenopausal age groups, the respective difference in f′ was significant (F1: up to 0.12 ± 0.06 Hz versus F2: up to 0.05 ± 0.04 Hz at P = 0.015, and M1: up to 0.16 ± 0.05 Hz versus M2: up to 0.11 ± 0.04 Hz at P = 0.044) (Figure 4, upper right). The ranges of fractal CBV fluctuation amplitudes (Figure 4, lower panels) were at a higher level and larger than those of the random dynamics, irrespective of age in men and women alike (M1: 9.07 ± 4.01 versus 1.29 ± 0.38 μmol/L at P < 0.001; M2: 8.85 ± 3.10 versus 2.08 ± 0.91 μmol/L at P < 0.001; F1: 6.93 ± 1.92 versus 1.69 ± 0.65 μmol/L at P < 0.001; and F2: 4.69 ± 1.57 versus 2.13 ± 0.56 μmol/L at P = 0.0016).
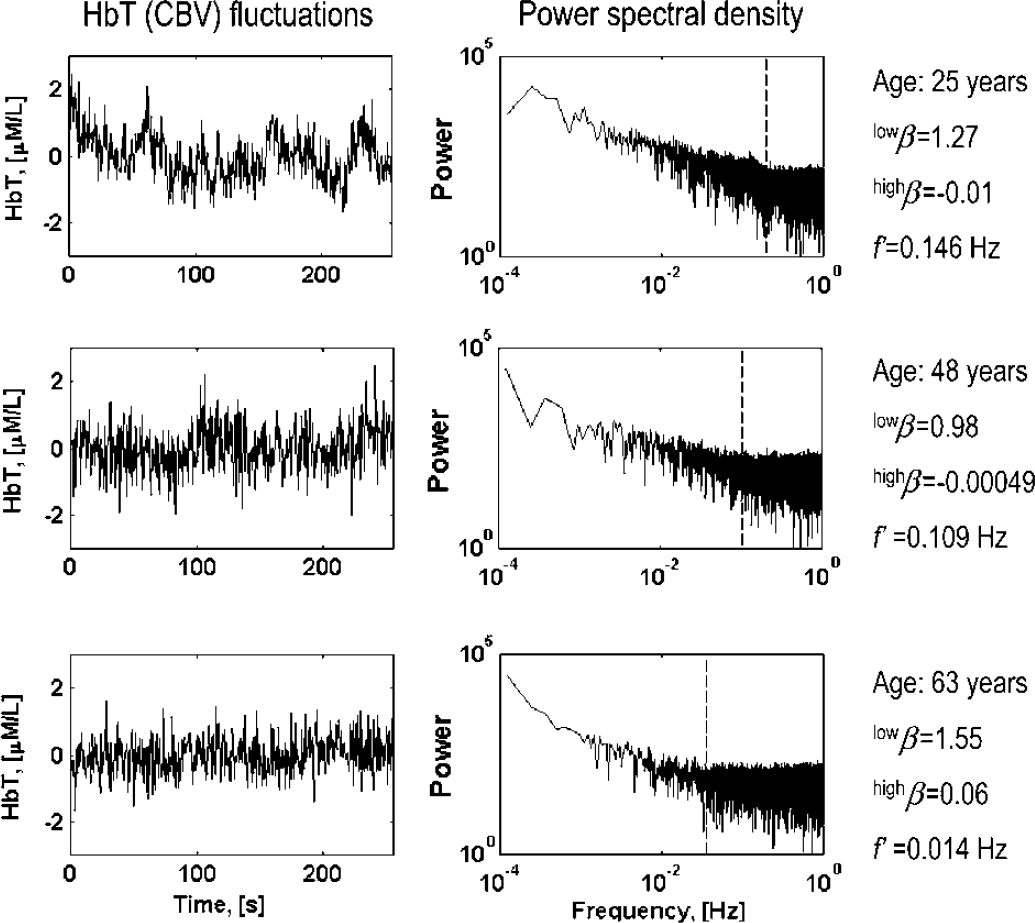
Cerebral blood volume (CBV) fluctuation patterns (left) and their corresponding bimodal spectra in a young, middle-aged, and old woman. The correlated, self-similar, that is, fractal pattern is seen in the low frequencies, while an uncorrelated, noisy dynamics dominates above this frequency range. The aging process increases this noisy domination in CBV dynamics.
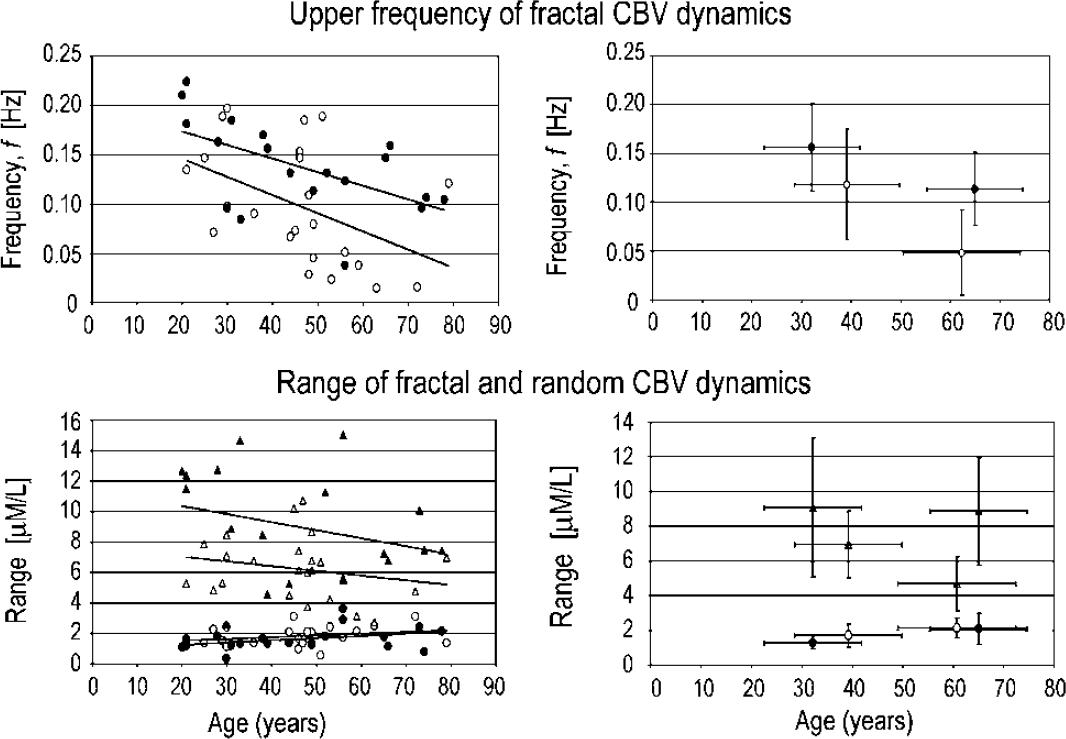
Cutoff frequency between the random high-frequency and the fractal low-frequency dynamics of cerebral blood volume (CBV) as a function of age in male (closed circle) and female (open circle) subjects (upper left). The range of fractal and random fluctuations (triangle and circle) as a function of age is shown for male (closed) and female (open) subjects (lower left). The mean and standard deviation for pre- and postmenopausal women groups and age-matched groups of men are plotted on the right.
The age-dependent narrowing of the fractal dynamics appears to be associated with increasing power slopes in women (Figure 5, upper left); however, in neither age groups did the degree of fractal correlation as measured by lowβ between men and women differ statistically (F1: 1.23 ± 0.25 versus Ml: 1.14 ± 0.22 at P = 0.329; F2: 1.39 ± 0.26 versus M2: 1.17 ± 0.20 at P = 0.089) (Figure 5, upper right). The nearest-neighbor correlation coefficients calculated from the mean of lowβ in each group as r1 = 2β−2−1 (Eke et al, 2000, 2002) were F1: −0.41 versus M1: −0.45, and F2: −0.34 versus M2: −0.44. The difference between F1 and F2 groups was 14% of the full range of anticorrelation, where −0.5 < r1 < 0, while between groups M1 and M2 it was a mere 2%. Dynamics in the high frequencies of the periodograms (above f′) were of a near-zero spectral index (Figure 5, lower left), with no difference in the pre- and postmenopausal female subjects and their age-matched male groups (Figure 5, lower right).
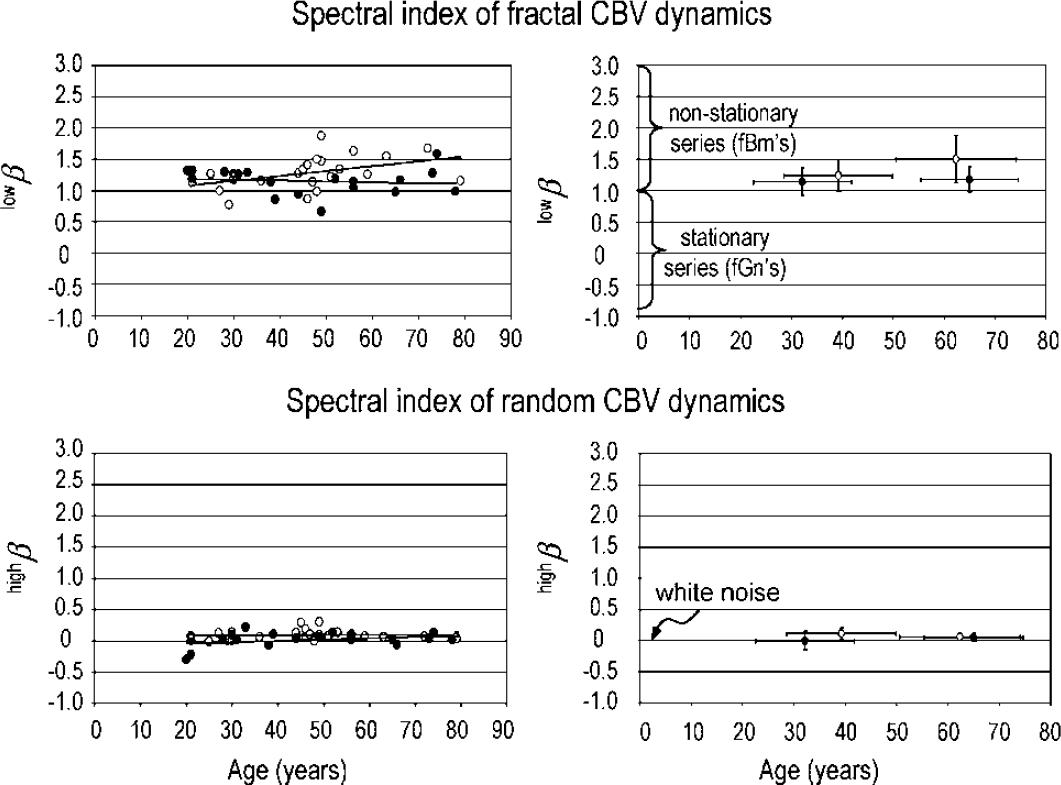
Spectral indices for the fractal and random dynamic components of cerebral blood volume (CBV) fluctuations as a function of age in male (closed circle) and female (open circle) subjects are shown on the left (lowβ and highβ, respectively). The mean and standard deviation for pre- and postmenopausal women groups and age-matched groups of men are plotted on the right.
Chaotic Analysis of Cerebral Blood Volume Dynamics
At an embedding dimension (a fundamental parameter of the chaotic analysis, the dimension of the virtual multispace, which embeds the chaotic attractor) of 12 and lag (time delay; when used in the chaotic analysis it defines the resolution of the chaotic attractor in the virtual multispace, and when used with the autocorrelation function it defines the temporal separation of events to be correlated) of 0.5 secs, we obtained a value of 10.60 ± 0.3 for the correlation dimension, Dcorr, and a value of 0.04 ± 0.03 for the largest Lyapunov exponent, λmax. The corresponding range of values for the surrogate data sets were 9.95 ± 0.66 to 10.77 ± 0.39 and 0.04 ± 0.02 to 0.07 ± 0.01, respectively. Because the surrogate range for Dcorr's and λmax's overlaps with that of the values obtained from the raw data sets, the latter cannot result from chaotic dynamics; hence, further analysis of complexity in this direction was discontinued.
Discussion
The cwNIRS method has a sufficiently high sensitivity for monitoring HbT, and proportionately CBV, because approximately 69% of the measured NIR energy arises from this compartment (Kohri et al, 2002) (Figure 1). The fact that scattering in the parenchyma is strong (scattering coefficient ≫ absorption coefficient) does not preclude that it remain relatively constant. In fact, when scattering and absorption are simultaneously assessed (Kohl et al, 1998), the scattering coefficient has been shown to change only 5% during cortical spreading depression, a condition when cerebral blood flow and CBV undergo marked changes. Moreover, a strong correlation between CBV changes measured by positron emission tomography and changes in HbT, measured by cwNIRS using an NIRO 500 equipment identical to the one employed in our study, was found (Rostrup et al, 2002). Very importantly, these authors found a strong proportionality between CBV and HbT under conditions of hypo- and hypercapnia, producing corresponding changes in CBV and HbT across a range larger than the one of the resting fluctuations reported in our study. The concept of approximating S in the cwNIRS equation (see in Methods) as constant has been described in various review publications (Delpy and Cope, 1997; Hoshi, 2003; Obrig and Villringer, 2003; Villringer and Chance, 1997). Taken together, based on theoretical considerations (Delpy and Cope, 1997; Hoshi, 2003; Obrig and Villringer, 2003; Villringer and Chance, 1997) and experimental data (Kohl et al, 1998; Rostrup et al, 2002) in a steady state of hemodynamics, HbT relates to CBV given the fact that under these conditions the mean tissue hematocrit can also be regarded as constant.
All events occurring within the extra- and intraparenchymal vascular compartments of the ROI are integrated within the 0.5-sec sampling period by the NIRS instrument as the sum of emerging photons. This allows for adequate sensitivity and temporal resolution. In addition, the 0.5-sec integration, 2 Hz sampling rate, and configuration of the NIRO 500 circuitry together exclude signal fluctuations because of heartbeats. Hence, NIRS monitors CBV in a lumped manner from dispersed spatiotemporal domains according to our intention of analyzing the temporal complexity of CBV fluctuations as they emerge from the vasculature of a cerebrocortical region.
The complex fluctuations observed in the cerebrocortical hemodynamics of our subjects as captured in extended records are associated with the resting temporal activity pattern of the human brain. This experimental condition is characterized by an alert state of the subject devoid of stress or provocation, or for that matter frustration, which may occur in an extended setting. For this reason, television viewing and reading of entertaining content were allowed and in fact were offered as standardized means to aid our subjects to remain in a physiologically stationary condition of steady state throughout the session. The stationarity of a physiologic system, however, needs to be discerned from its statistical stationarity, especially when its long-range behavior is studied. Statistical stationarity, that is, the lack of time dependence in the statistical descriptors, is not a prerequisite for a physiologic system to operate in a steady state, as one or more of its parameters may spontaneously fluctuate (Bassingthwaighte et al, 1994; Eke et al, 2000)—as did CBV in our subjects—in a nonstationary manner, referred to as fractional Brownian motion (fBm) (Eke et al, 2000).
We used spectral analysis as a numerically tested fractal tool (Eke et al, 2000; Elbert et al, 1994). The Fourier spectrum captures two fundamental aspects of CBV dynamics: amplitudes and phases of fluctuations and the rate at which these occur. The former two relate to power and the latter relates to the frequency of the spectrum. From our local power slope analysis of the fluctuation spectra, two separate modalities in CBV dynamics were identified: a random emerging in the high-frequency range, and a fractal that blends events of low frequencies into a self-similar order (Figures 2-4). In our study, these modalities were found to be complementary: while amplitudes were dominated by a fractal pattern in a structured manner in the low end of dynamics, higher frequencies were dominated by biologic noise of maximal complexity where no structure in the signal was present. The former was a realization of a nonstationary process, while the latter was a realization of a stationary process (Figure 5, upper right and lower part). They themselves should be regarded as separate signal entities, fBm and fractional Gaussian noise (fGn) bearing a fundamental impact on fractal time-series analyses as described in detail elsewhere (Eke et al, 2000, 2002). Increments of an fBm signal produce an fGn process (Eke et al, 2000, 2002). In light of these definitions, our CBV fluctuations were made up of the following two modalities: a random fGn and a fractal fBm with anticorrelated increments of an fGn character separated by f′. As detailed elsewhere (Eke et al, 2002), the degree of correlation in an fGn signal can be assessed from its autocorrelation function. Specifically, its k-lag autocorrelation coefficient, rk, defines how strongly the momentary value of the signal depends on its past values k-lag apart; the higher the lowβ the slower the rk decays, in other words, the longer the memory of the process. The correlation for the nearest neighbors is given by r1 = 2β−2−1 (Eke et al, 2000, 2002), where β is that of the fBm signal. Increments of an fBm signal creating an fGn signal are uncorrelated, or random when r1 = 0, correlated when r1 > 0, and anticorrelated when r1 < 0. In cases when r1 ≠ 0, past amplitudes will influence future ones in the process to an extent given by r1, often called a long-memory process (Eke et al, 2000, 2002). Most of our CBV records were r1 < 0; hence, memory in these instances can be considered as the overall anticorrelating influence of all those factors that limit CBV drifting out of the physiologic range. One possible physiologic interpretation of the anticorrelated increments observed in most of our CBV signals is that a negative feedback-type control, most certainly of myogenic origin, operates in the monitored vasculature, which is a mechanism that is eliminated with age in postmenopausal women only.
A chaotic explanation of CBV dynamics was rejected because of Dcorr ≫ 3, and because the respective ranges of raw and surrogate series overlapped for Dcorr and λmax. Failure to show chaotic dynamics suggests that synchronized chaotic vasomotion was absent in the monitored vascular trees, which, however, does not preclude that nonsynchronized chaotic patterns could still blend into a regional fractal or random pattern of CBV dynamics, provided the window of observation is long enough for these variations in oscillation frequency to be captured. Indeed, in a narrow window of observation (in 85.3-sec records), using NIRS monitoring of spontaneous CBV fluctuations, Schroeter et al (2004) reported oscillations centered around approximately 0.02 Hz (very low-frequency oscillation, VLFO) and 0.1 Hz (low-frequency oscillation, LFO) in female subjects, and showed that the latter decreased with age.
Nevertheless, our findings of a complex, fractal pattern of spontaneous CBV fluctuations are not at all in conflict with the observations of others (Elwell et al, 1999; Schroeter et al, 2004), who, in short NIRS signals, found them to be oscillating, but instead, are indeed complementary. Namely, while VLFO and LFO are seen and defined in a narrow window of observation (85.3 secs), in extended records of our study, they tend to blend into a self-similar, structured, correlated order, most likely because of variations in the pacemaker rhythms along the vascular tree. This translates into a spread of power in the Fourier spectrum, destroying the isolated peaks of oscillations. Interestingly, the raw time series of Schroeter et al (2004), shown in Figure 1, do appear complex like our records; still, factors, such as a short window of observation (512 data points), the substantial temporal averaging applied (17:1), and, very importantly, the linear scaling that these authors used in representing their spectra together, while favoring identifying local peaks, failed to identify the long-range correlation structure, which, in fact, was not their aim but ours to achieve. Conversely, our log-log representation of the spectra along with line fitting of a fractal model across a range of spectral estimates (Eke et al, 2000, 2002) cannot overlook identification of the fractal long-range correlation in the fluctuating cerebrocortical hemodynamics. In a preliminary test, the VLF and LF peaks could indeed be found in the spectrum of some shorter segments of our extended NIRS records. Furthermore, in a group of 14 female subjects, these authors showed that LFO diminished with age, a finding supported by our results as we showed that f′ decreased beyond the lower limit of their LFO range, that is, 0.07 Hz, more in women (F2: 0.05 ± 0.04 Hz) than in men (M2: 0.11 ± 0.04 Hz) in the postmenopausal (elderly) age groups. Our study gives evidence of the fact that the persisting VLF-type fluctuation in the elderly is not like in the young, but is of an altered correlation structure, again more in women than in men.
Intaglietta (1990) proposed that VLF vasomotions are produced by large vessels, while LF vasomotions are seen in terminal arterioles. On this premise, Schroeter et al (2004) related their VLFOs as originating from larger vessels and LFOs from microvessels of the brain, a view that we share. It is also known that the intraparenchymal arterial tree is formed by generations of branching vessels from the largest to the smallest diameter connecting with the capillary rete. It indeed, seems, likely that the self-similar decline of power amplitudes from the lowest frequency to the cutoff frequency in our spectra can be regarded as being produced by a continuum of vasomotion amplitudes from the large- to the small-diameter vessel segments of the monitored vascular tree. This gradual loss of power towards the high frequencies is more pronounced in the aging woman, where it is also associated with a narrowed fluctuation amplitude, which corresponds well with the fact that in aging men the extracranial large, while in the aging women the intracranial medium-size arterial disease predominates (Caplan et al, 1986). Taken together, it is reasonable to conclude that age-related increased vessel stiffness because of fibrosis (Lundberg and Crow, 1999), and a decline in pacemaker activity in the microvascular smooth muscle cells lead to a narrowed fractal range of fluctuations more in women than in men, and a restricted fluctuation amplitude in women only.
These gender differences can most certainly be attributed to the effects of female sexual hormones, primarily estrogens, as most estrogens are known to be active on the cerebral vasculature (Hurn et al, 1995; Murphy et al, 2004; Rubanyi et al, 2002; Watanabe et al, 2001). Estrogen reduces vasoconstriction elicited by serotonine, thereby decreasing the vasoreactive properties of cerebral vessels (Belfort et al, 1995; Shay et al, 1994). In addition, by reducing the resistance of the middle cerebral artery (Collins, 2001), estrogen enhances CBF compared with the values found in age-matched males, an effect that deteriorates after menopause (Rodriguez et al, 1988). The removal of the vasodilatory effect of estrogen and increased atherosclerosis in postmenopausal women (Belchetz, 1994) resulting in a stiffer, less-reactive cerebral vasculature may thus underly the observed narrowing of the dynamic range and that of the amplitudes of fractal CBV fluctuations. These factors gain momentum after menopause and can most certainly be attributed to the increased morbidity with respect to cerebrovascular diseases, especially ischemic and hemorrhagic stroke in women, as studies have shown that postmenopausal women who have a stroke are more likely to die than men, or if they survive, they are more likely to have a poor outcome (AHA, 2002; Murphy et al, 2004).
Our approach of utilizing a combination of noninvasive NIRS monitoring and fractal analysis of a long-term correlation pattern in spontaneous CBV fluctuations may prove to be a useful tool to identify a potentially risky cerebrovascular condition before any manifest symptoms of ischemic cerebrovascular disease or hemorrhagic stroke develop: if a much lowered f′, and hence lack of LFO, and a much narrowed range of fractal fluctuation amplitudes develop in the elderly, it may lead to an impaired adaptation to suddenly developing under- or overperfusion tendencies in the peripheral cerebrovascular bed that cannot be effectively handled by the persisting large vessel reactions and their neuronal control mechanisms (Ursino, 1991), both being much too distant from the peripheral vascular events.