
Abstract
Conventional graphical analysis of positron emission tomography (PET) recordings of the cerebral uptake of the DOPA decarboxylase substrate [18F]fluorodopa (FDOPA) assumes irreversible trapping of [18F]fluorodopamine formed in the brain. However, 4-h long PET recordings allow the estimation of a rate constant for elimination of [18F]fluorodopamine from the brain (kloss), from which can be calculated an effective distribution volume (EDV1), which is an index of [18F]fluorodopamine storage capacity. We earlier developed a method employing 2-h long FDOPA recordings for the estimation of kloss and EDV, here defined as EDV2. This method is based on subtraction of the calculated brain concentrations of the FDOPA metabolite O-methyl-FDOPA, rather than the subtraction of the entire radioactivity in a reference region. We now extend this method for the parametric mapping of these parameters in the brain of healthy aged volunteers and patients with Parkinson's disease (PD), with asymmetry of motor symptoms. For parametric mapping, we use a novel application of a multilinear solution for the two-tissue compartment FDOPA model. We also test a new application of the Logan graphical analysis for mapping of the FDOPA distribution volume at equilibrium. The estimates of kloss and EDV2 were more sensitive for the discrimination of biochemical abnormality in the putamen of patients with early PD relative to healthy aged subjects, than was the conventional net influx estimate. Of the several methods, multilinear estimates of EDV2 were most sensitive for discrimination of PD and normal putamen. However, kloss was most sensitive for detecting biochemical asymmetry in the putamen of PD patients, and only kloss also detected in the caudate of PD patients a decline in the retention of [18F]fluorodopamine relative to healthy aged control subjects.
Introduction
The quantitative analysis of positron emission tomography (PET) with [18F]fluorodopa (FDOPA) is complicated by the presence in the brain of the plasma metabolite O-methyl-FDOPA (OMFD), and by the eventual catabolism and elimination of [18F]fluorodopamine formed within nigrostriatal terminals (Cumming and Gjedde, 1998). A constrained compartmental analysis of FDOPA kinetics can accommodate these complexities (Gjedde et al, 1991; Huang et al, 1991; Kuwabara et al, 1993). However, the utilization of FDOPA in the brain has frequently been calculated by a linear graphical analysis method based on a model assuming irreversible trapping of brain metabolites (Gjedde, 1988; Martin et al, 1989), derived from the methods of measuring the net brain–brain clearance of deoxyglucose (Gjedde, 1981, 1982; Patlak et al, 1983; Patlak and Blasberg, 1985). In the case of FDOPA, the apparent net blood–brain clearance (
In general, graphical analysis of FDOPA net influx has been performed over an interval of about 1 h, during which time the product [18F]fluorodopamine is assumed to be entirely trapped in nigrostriatal fibres. However, curvature of the influx plots is evident in prolonged PET recordings with FDOPA (Doudet et al, 1997, 1998; Holden et al, 1997; Cumming et al, 2001), reflecting the eventual diffusion of [18F]fluorodopamine metabolites from the brain. The rate constant for the loss of the decarboxylated brain metabolites (kloss) can be calculated from extended graphical analysis of FDOPA influx to the brain of human and non-human primates recorded during 4 h (Holden et al, 1997; Cumming et al, 2001; Sossi et al, 2001, 2002, 2004). Furthermore, the effective distribution volume (EDV1) of FDOPA, an index of the trapping of decarboxylated FDOPA metabolites in human striatum, has been defined as the ratio
Abnormal FDOPA utilization is not expressed uniformly throughout the basal ganglia of patients with PD (Morrish et al, 1996; Rousset et al, 2000), and is asymmetric in patients with asymmetry of motor symptoms (Ito et al, 1999). Parametric mapping of an index of [18F]fluorodopamine storage capacity might permit the detection of focal changes in dopamine metabolism in early PD. We have earlier developed a method for calculating the FDOPA EDV in volumes of interest from emission recordings of only 2 h duration (Kumakura et al, 2005). In this method, EDV2 is defined as the ratio between the intrinsic utilization of FDOPA in the brain (K) and the magnitude of kloss, as distinct from the earlier calculation of EDV1 as the ratio
Materials and methods
Subject Recruitment
Six neurologically normal healthy subjects (59 ± 7 years, range 50 to 73 years) and eight patients with early PD (58 ± 10 years, range 46 to 73 years) were recruited for the study, which was approved by the Research and Ethics Committee of Aarhus University. All subjects provided written informed consent to participate in the PET study. The exclusion criteria for the control group included current neurologic, psychiatric, or systemic disease, and current use of drugs affecting the central nervous system. Patients were recruited from the Movement Disorders clinic, and were followed up clinically for at least 2 years. Severity of motor symptoms was assessed using the Hoehn and Yahr scale (mean score of 2.4 ± 0.2; range 2 to 3). Six of the eight patients had received levodopa monotherapy as Sinemet (mean dose 675 mg/day; range 450 to 900), and two were never-medicated de novo patients. All patients had initial unilateral motor symptoms. The mean duration of illness was 3.1 ± 1.5 years (range 1 to 1.5 years for the de novo patients and 3 to 6 years for the others). At the time of scanning, one of the de novo patients had hemi-PD (right side), while the other patients had bilateral PD, but with persistent asymmetry of motor symptoms on one side (five right and two left). Final diagnosis of PD was verified by an apomorphine test (Bonuccelli et al, 1993).
Scanning Procedures
Subjects fasted overnight before scanning, and the previously treated PD patients had pause of Sinemet for 3 days. Catheters were placed in an antecubital vein and a radial artery of the nondominant hand. Carbidopa (Merck Sharpe and Dohme) was administered at a dose of 150 mg (per os) 1 h before the PET recordings to minimize the decarboxylation of FDOPA in peripheral tissues (Cumming et al, 1993).
Subjects reclined on the scanning bed of the ECAT EXACT HR 47 whole-body PET (CTI/Siemans, Knoxville, TN, USA), with their heads comfortably immobilized using a custom-made head-holder. After recording of a 10-min transmission scan, a dynamic three-dimensional (3D) emission recording consisting of 28 frames (6 × 0.5, 7 × 1, 5 × 2, 4 × 5, 5 × 10, and 1 × 30 mins frames) for a total of 120 mins was initiated on intravenous injection of FDOPA (200 MBq). During this time, a series of 40 arterial blood samples was collected at intervals increasing from 10 secs to 10 mins, and the total [18F]-radioactivity in the plasma was measured in a well-counter cross-calibrated to the tomograph. The fractions of untransformed FDOPA and its major plasma metabolite OMFD were determined in eight selected plasma samples (2.5, 5, 15, 25, 35, 60, 90, and 120 mins) by reverse-phase high-performance liquid chromatography (Cumming et al, 1993), and the continuous plasma input functions for FDOPA and OMFD were calculated by fitting biexponential functions to the measured fractions (Gillings et al, 2001).
Image Analysis and Brain Metabolite Correction
The dynamic PET sequences were realigned and corrected framewise for head motion using a rigid-body transformation with six degrees of freedom, employing as the target a magnetic resonance imaging (MRI)-derived four-dimensional (4D) template specific for FDOPA (Reilhac et al, 2003; Kumakura et al, 2004). After motion correction, the dynamic scans were summed and registered to the Montreal Neurological Institute (MNI) stereotaxic brain, using the affine transformation of the Automated Image Registration (AIR) algorithm (Woods et al, 1992), and fitted to a grey matter MRI template of the MNI average brain (Collins et al, 1998; International Consortium for Brain Mapping, (ICBM)) with its striatum intensity doubled to emulate radioactivity distribution of the summed FDOPA emission images.
After motion correction and spatial normalization, a time–radioactivity curve was extracted from the cerebellum with an anatomical template from the MNI brain. Using the plasma inputs for FDOPA and the metabolite OMFD, a one-compartment constrained compartmental model (Gjedde et al, 1991, 1993; Huang et al, 1991; Hoshi et al, 1993) was fitted to the first 60 mins of the cerebellum recording. In this model, the magnitudes of the unidirectional FDOPA blood–brain clearance (
Parametric maps were calculated in the native PET space using MATLAB (The Mathworks, Natick, MA, USA) and four algorithms for
Graphical Analysis for Net Blood–Brain Clearance (Kappin)
Maps of the net blood–brain clearance of Kappin were calculated by graphical analysis with conventional frame-by-frame subtraction of the total time–radioactivity curve in the cerebellum (Martin et al, 1989), based on the definition of the intrinsic blood–brain clearance of a tracer (Gjedde, 1981, 1982; Patlak et al, 1983; Patlak and Blasberg, 1985). Metabolite-corrected arterial inputs for FDOPA, and emission frames recorded in the interval of 20 to 60 mins were used for this linear graphical analysis.
Conventional Nonlinear Optimization for kloss and EDV2
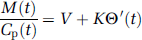
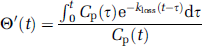
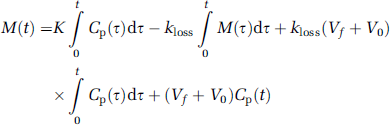
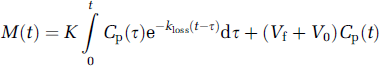
In the conventional graphical analysis, the intrinsic net influx of a tracer (K) is defined as K1k3/(k2 + k3), where K1 is the unidirectional blood–brain clearance, k2 is the rate constant for return of the tracer to circulation, and k3 is the rate constant for the irreversible trapping of tracer in the brain. However, in the case of FDOPA, decarboxylated metabolites eventually diffuse from the brain. In a generalization of the graphical analysis, the intrinsic magnitude of K is calculated from the ratio of mass of the tracer in brain (M(t)) to the plasma tracer concentration (Cp(t)) as a function of the normalized integral of the arterial input, modified (Θ′) for the case of metabolite loss (Equation (1)). Here, Θ′ is a virtual time calculated as the ratio of Cp(t) convolved with the impulse response function using a rate constant for the elimination of trapped metabolites from the brain, defined as kloss (Patlak and Blasberg, 1985; Holden et al, 1997), to Cp(t) itself (Equation (2)). Thus, in a generalization of the Patlak graphical analysis with correction for kloss (Equation (1)), the slope represents the magnitude of K, and the ordinate intercept the magnitude of V:
Voxelwise parametric maps of the intrinsic net FDOPA influx (K) and the elimination rate constant (kloss) were calculated by optimization of a second-order polynomial fitted to the curvature of M(t)/Cp(t) versus Θ′, such that the absolute value of the coefficient of the quadratic term of the polynomial was minimized as a function of kloss. This procedure is equivalent to the least-squares optimization of K and kloss by Equations (1) and (2) above (Holden et al, 1997). Here, voxelwise time–radioactivity curves in the interval of 10 to 120 mins calculated by framewise subtraction of the brain OMFD curves were used for the regression. In analogy to the approach of Holden et al (1997) for VOI analysis, maps of the EDV2 were calculated as the ratio of the estimates of K and kloss in each voxel.
Optimization Using Multilinear Solution for kloss and EDV2
We also applied an explicit nongraphical compartmental analysis for the voxelwise estimation of K and kloss. If brain OMFD is subtracted, and the precursor pool in the brain is disregarded in the calculation of K, the mass of the tracer trapped in the FDOPA metabolite pool in the brain (Mm(t), that is, [18F]fluorodopamine and its deaminated metabolites) can be expressed as a first-order differential equation:
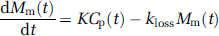
which on integration yields
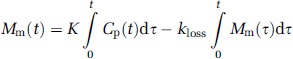
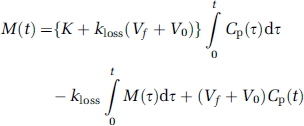
Assuming that the distribution volume of the precursor pool (Vf) approaches a constant, K1/(k2 + k3), in the brain, and given an effective plasma volume in the brain (V0), the total mass of the tracer, M(t), then becomes

Substituting Equation (4) into Equation (5) gives
which can be rearranged in multilinear form,
and expressed as a multilinear equation, with the noisiest term (M(t)) placed on the right-hand side,
where the coefficients of the three terms on the right-hand side are macroparameters (p(1), p(2), and p(3)) to be estimated by system equations as functions of FDOPA circulation time. Since voxelwise estimation of these macroparameters is prone to bias because of the noise in PET data, the linear regression with the spatial constraint (LRSC) method (Zhou et al, 2003) was used to calculate EDV2 as p(1) + p(3)/p(2), and kloss as 1/p(2).
Logan Graphical Analysis for the Total Distribution Volume (Vd)
Finally, maps of the total equilibrium distribution volume of FDOPA and its metabolites in the brain (Vd) were calculated using the total or perpendicular least squares for the Logan plot (Logan et al, 1990; Varga and Szabo, 2002), with the arterial FDOPA input and voxelwise time–radioactivity curves calculated after subtraction of the OMFD during 60 to 120 mins after FDOPA injection.
After voxelwise calculations, all parametric maps were resampled into the common stereotaxic space using the transformations calculated above, and smoothed with an isotropic 3D Gaussian kernel of 6 mm full-width at half-maximum (FWHM). In the case of the PD group, final maps were flipped so that the hemisphere contralateral to the main symptoms was on the right side. Mean parametric images were then calculated for the healthy control group and for the PD subjects.
Volume of Interest Analysis
High-resolution T1-weighted head images were obtained from each subject using a GE Signa Horizon 1.0-T MRI scanner (General Electric Medical Systems, Milwaukee, WI, USA), as described previously (Kumakura et al, 2004). The uniformity-corrected MRI images were registered to the MNI standard brain, using affine transformation and nonlinear warping to minimize interindividual anatomical morphometric variability. Individual VOIs of the putamen and caudate were obtained using 3D model-based anatomic segmentation methods; ANIMAL (Automatic Nonlinear Image Matching and Anatomical Labeling) and INSECT (Intensity Normalized Stereotaxic Environment for the Classification of Tissue), developed at the Montreal Neurological Institute (Collins et al, 1995; Sled et al, 1998). After subtraction of the brain OMFD, time–radioactivity curves were extracted by applying the VOIs from MRI segmentation to the dynamic recordings. Using the four methods described above, the magnitudes of Kappin, kloss, EDV2, and Vd were calculated in the VOIs. Mean voxelwise estimates of the kinetic parameters were also calculated for the left and right caudate and putamen VOIs.
Statistics
The significance of differences in the estimates between groups and side-to-side differences was tested using the two-tailed Student's t-test in cases of equal variance, Welch's unpaired t-test in cases of unequal variance, and the paired t-test for left–right comparisons.
Results
Representative fitting of a time–radioactivity curve after subtraction of OMFD in the putamen of a patient with early PD using the multilinear equation (8) for the interval of 10 to 120 mins is illustrated in Figure 1A. Logan analysis of the same data for the interval 60 to 120 mins is illustrated in Figure 1B. Mean parametric maps of Kappin in healthy elderly (Figure 2A) and PD patients (Figure 2B) are illustrated along with maps of the magnitude of kloss calculated by the conventional nonlinear method of Holden et al (1997) in the healthy (Figure 2C) and PD groups (Figure 2D), and by the new multilinear method in the healthy (Figure 2E) and PD groups (Figure 2F), with insets showing the magnitude of kloss over a more restricted range (Figures 2G and 2H). Maps of kloss calculated using the nonlinear conventional method did not reveal more effect on trapping of decarboxylated metabolites in the basal ganglia relative to surrounding brain structures (Figures 2C and 2D), whereas using the multilinear method, the caudate and putamen could be visually identified as zones of low kloss (Figures 2E and 2F).
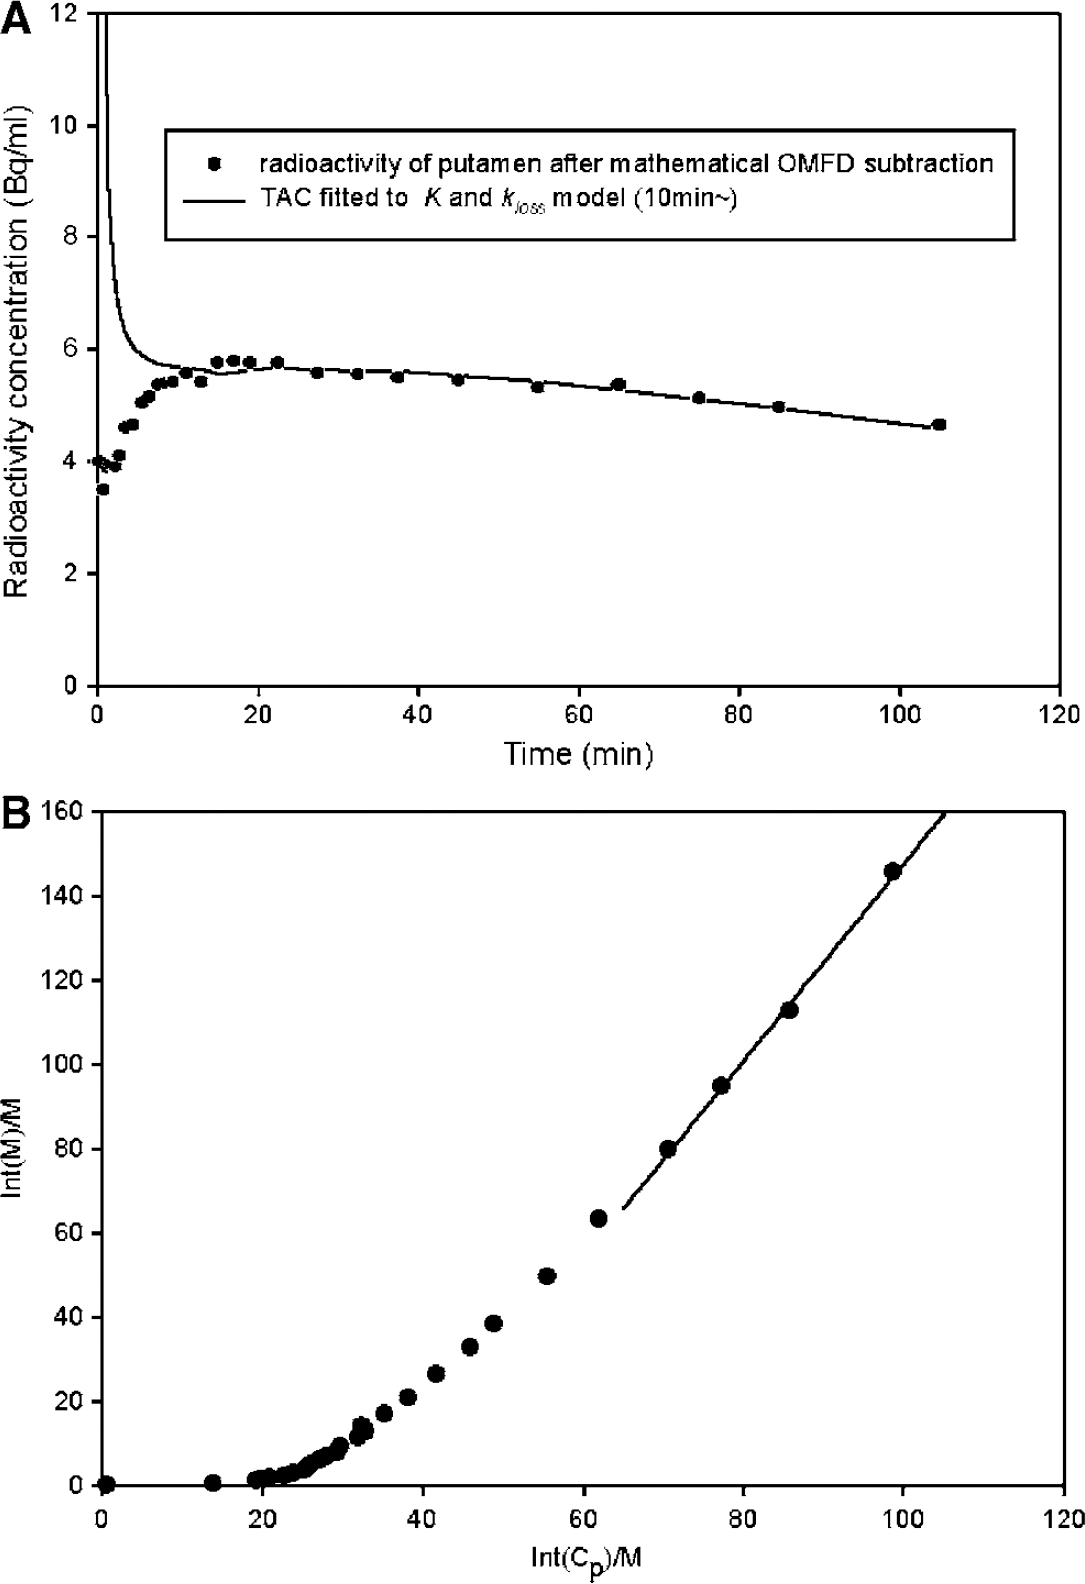
Fitting of the multilinear solution (
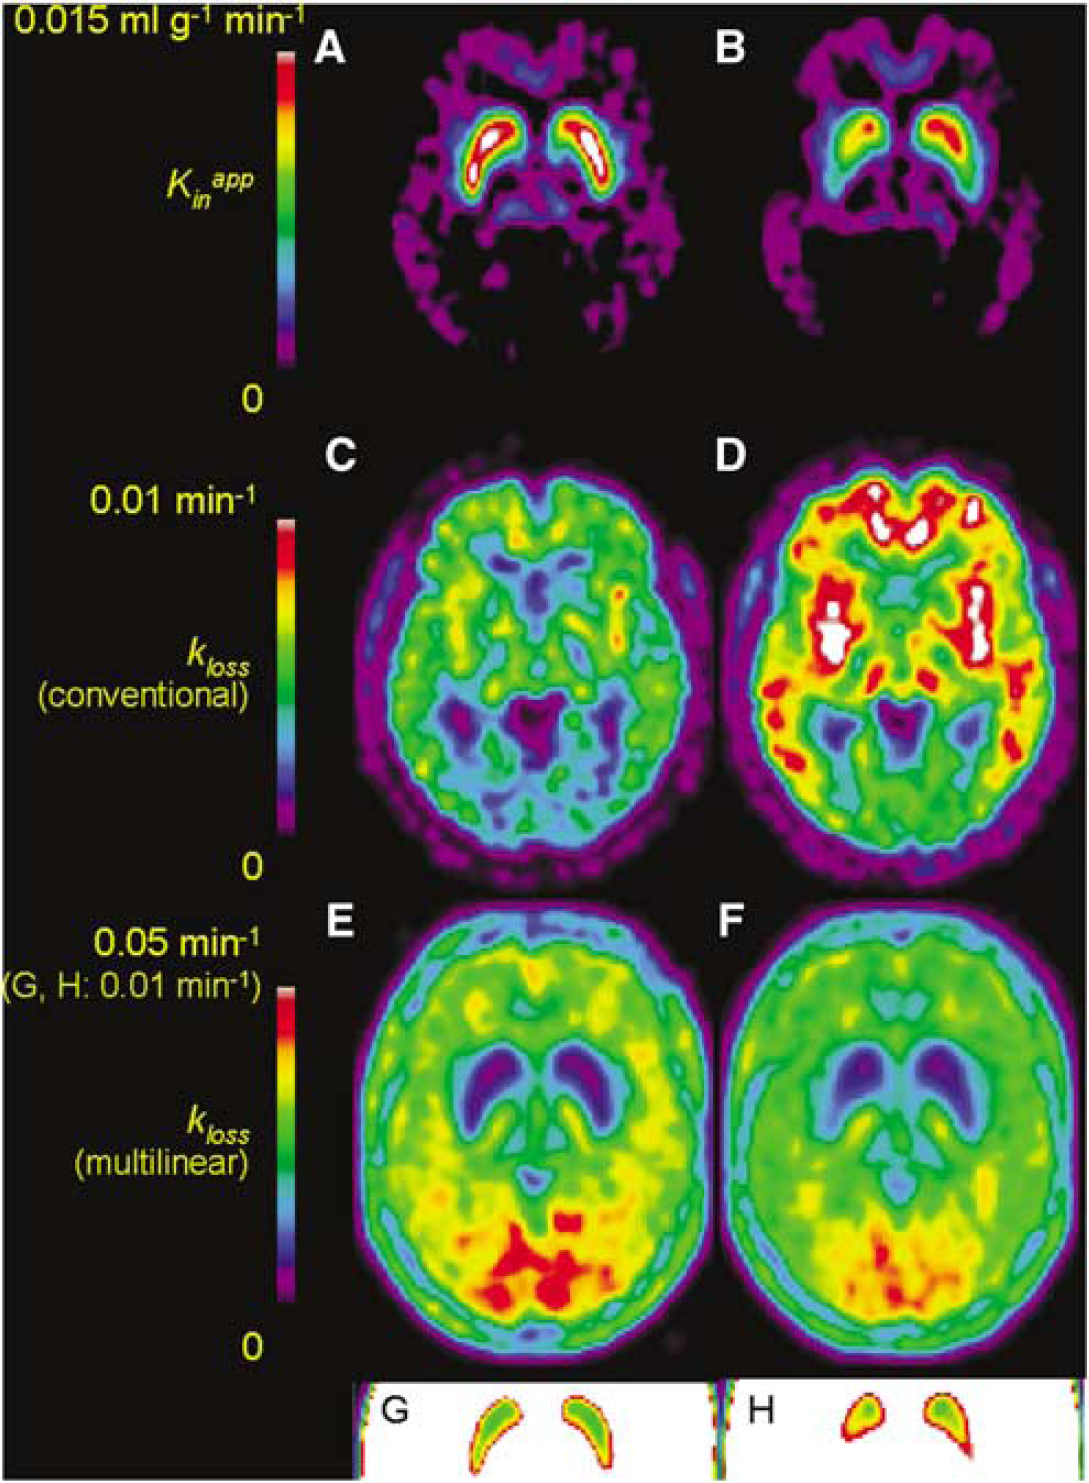
Mean parametric maps of the magnitude of the net blood–brain clearance of [18F]fluorodopa (FDOPA) (Kappin, ml/g min) in healthy aged subjects (
Mean maps of the magnitude of EDV2 calculated by the conventional nonlinear method in the healthy elderly (Figure 3A) and PD groups (Figure 3B), by the multilinear method in the healthy elderly (Figure 3C) and PD groups (Figure 3D), and by the Logan method in the healthy elderly (Figure 3E) and PD patients (Figure 3F) are illustrated. To contrast the noise characteristics of nonlinear and multilinear parametric mapping methods, maps of kloss calculated by nonlinear (Figure 4A) and multilinear analysis (Figure 4B) and corresponding maps of EDV2 by nonlinear (Figure 4C) and multilinear analysis (Figure 4D) in a representative PD patient are also illustrated. Using MATLAB (The Mathworks, Natick, MA, USA) on a Linux workstation equipped with an Intel Pentium 4 2.4 GHz processor, the computation time for parametric mapping of whole brain volume was approximately 10 mins by the multilinear equation (8) and 60 mins by nonlinear kloss optimization.
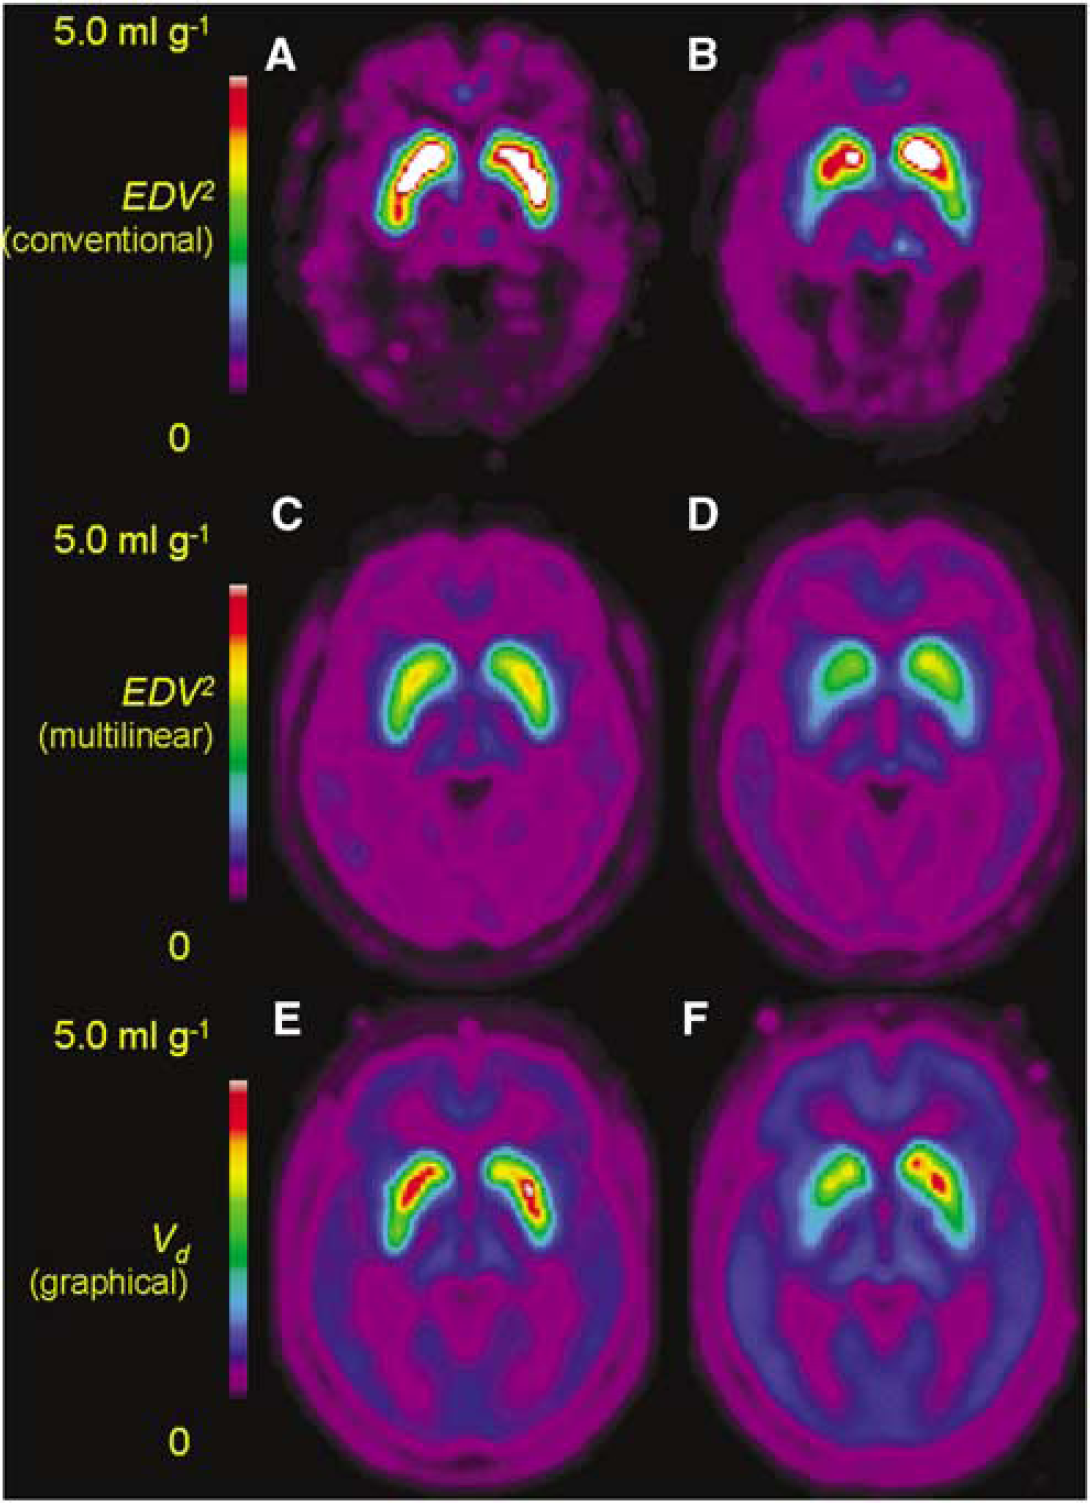
Mean parametric maps of the magnitude of the effective distribution volume of [18F]fluorodopa (FDOPA) (EDV2, ml/g) calculated by a nonlinear method in healthy aged subjects (
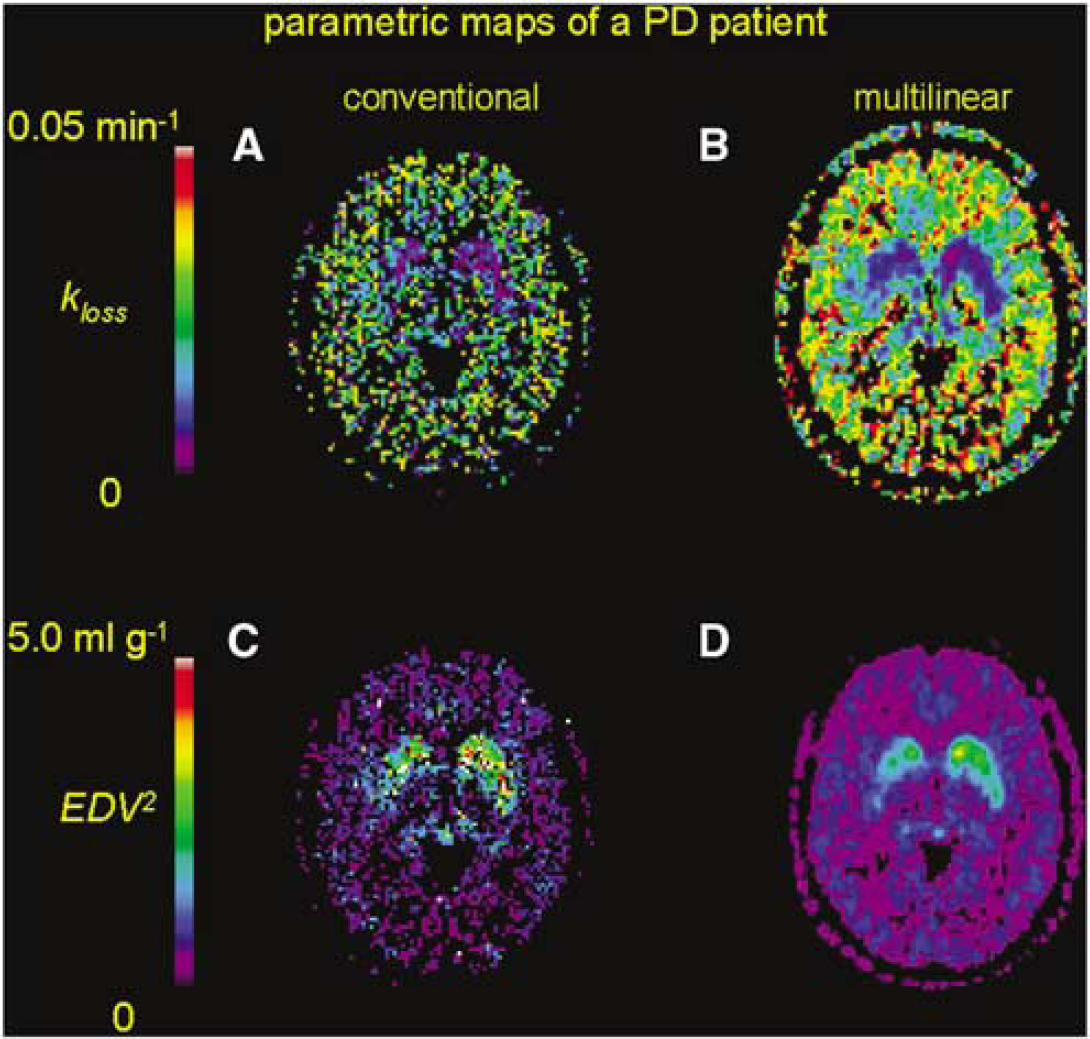
Parametric maps of the magnitude of the elimination rate constant for [18F]fluorodopamine formed in the brain (kloss) calculated by nonlinear conventional (
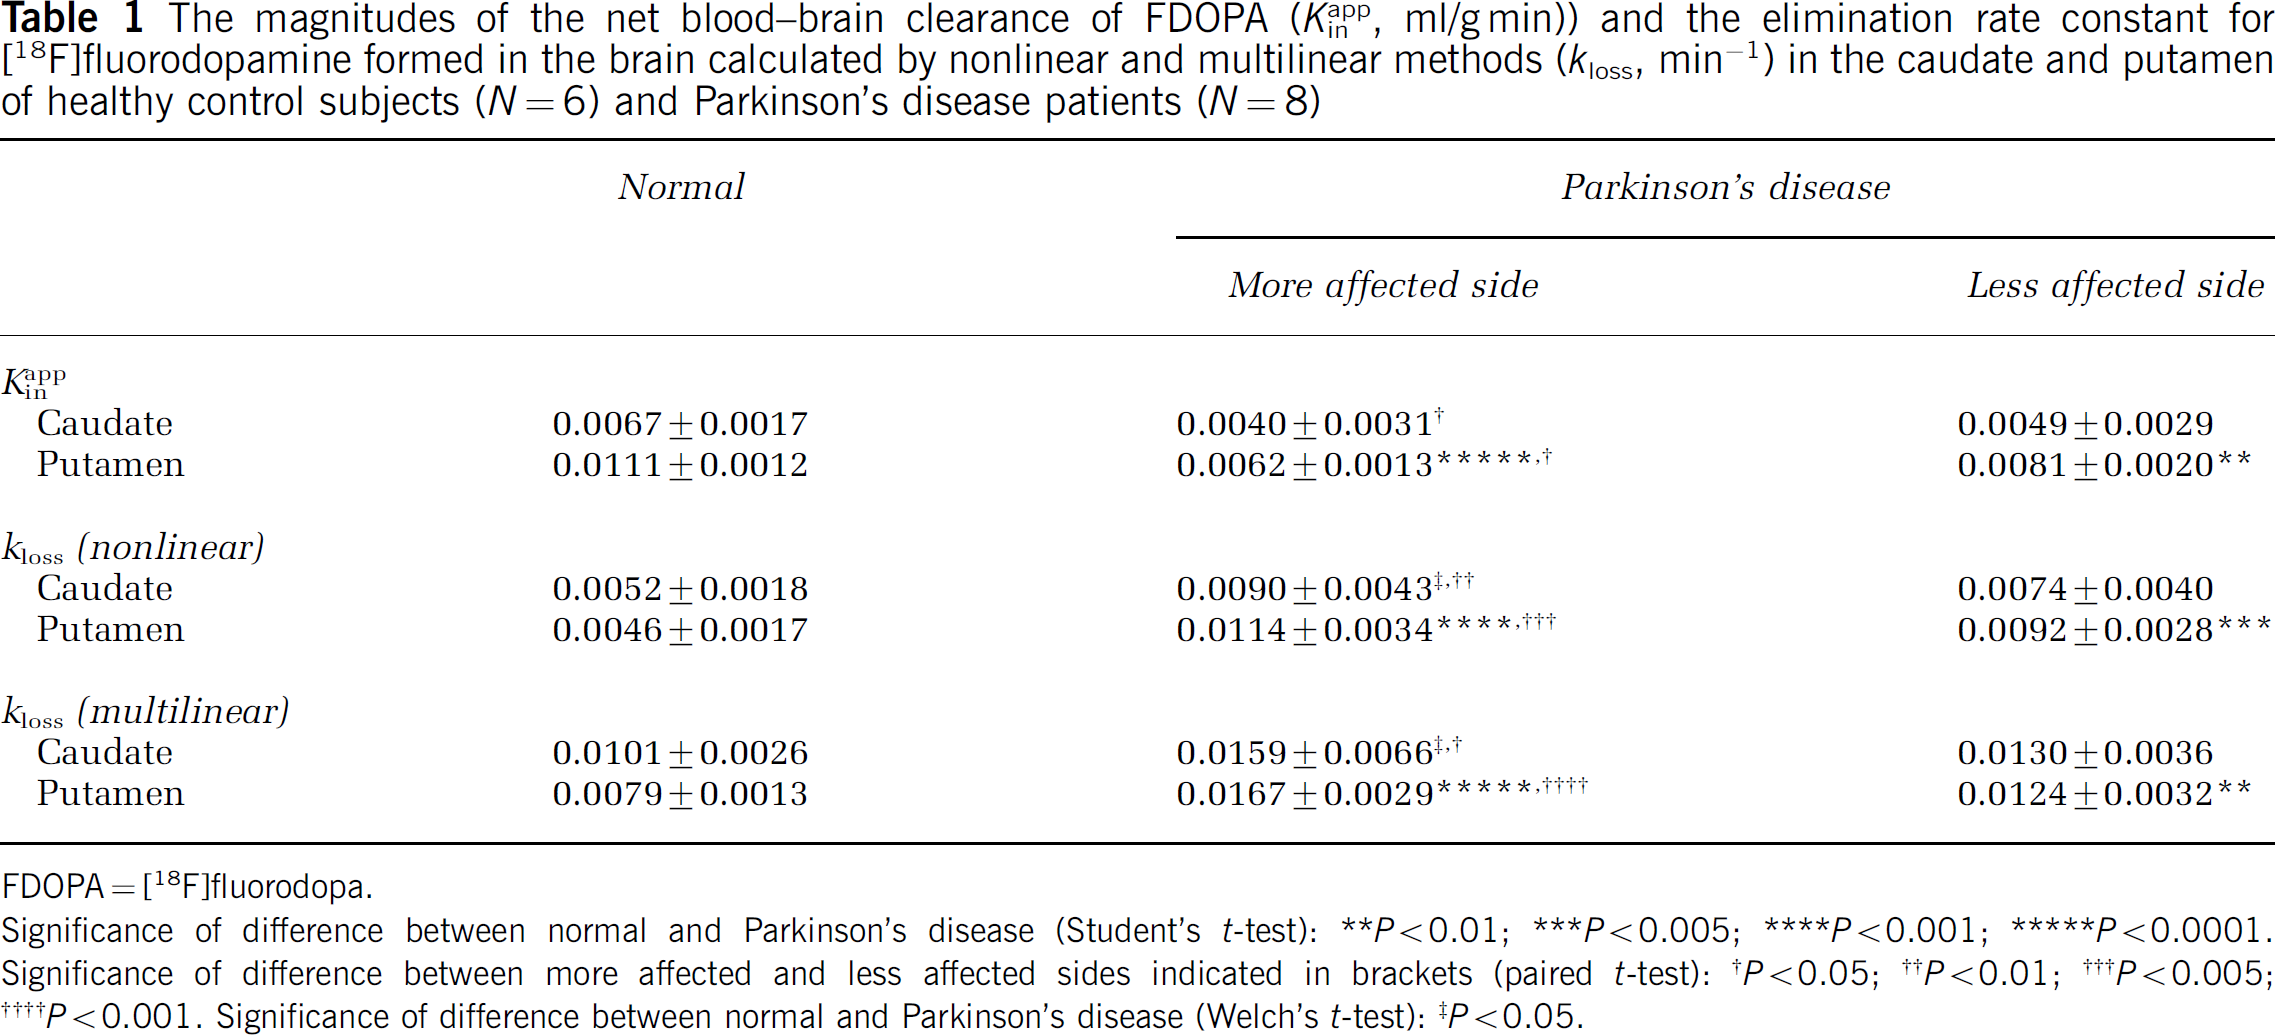
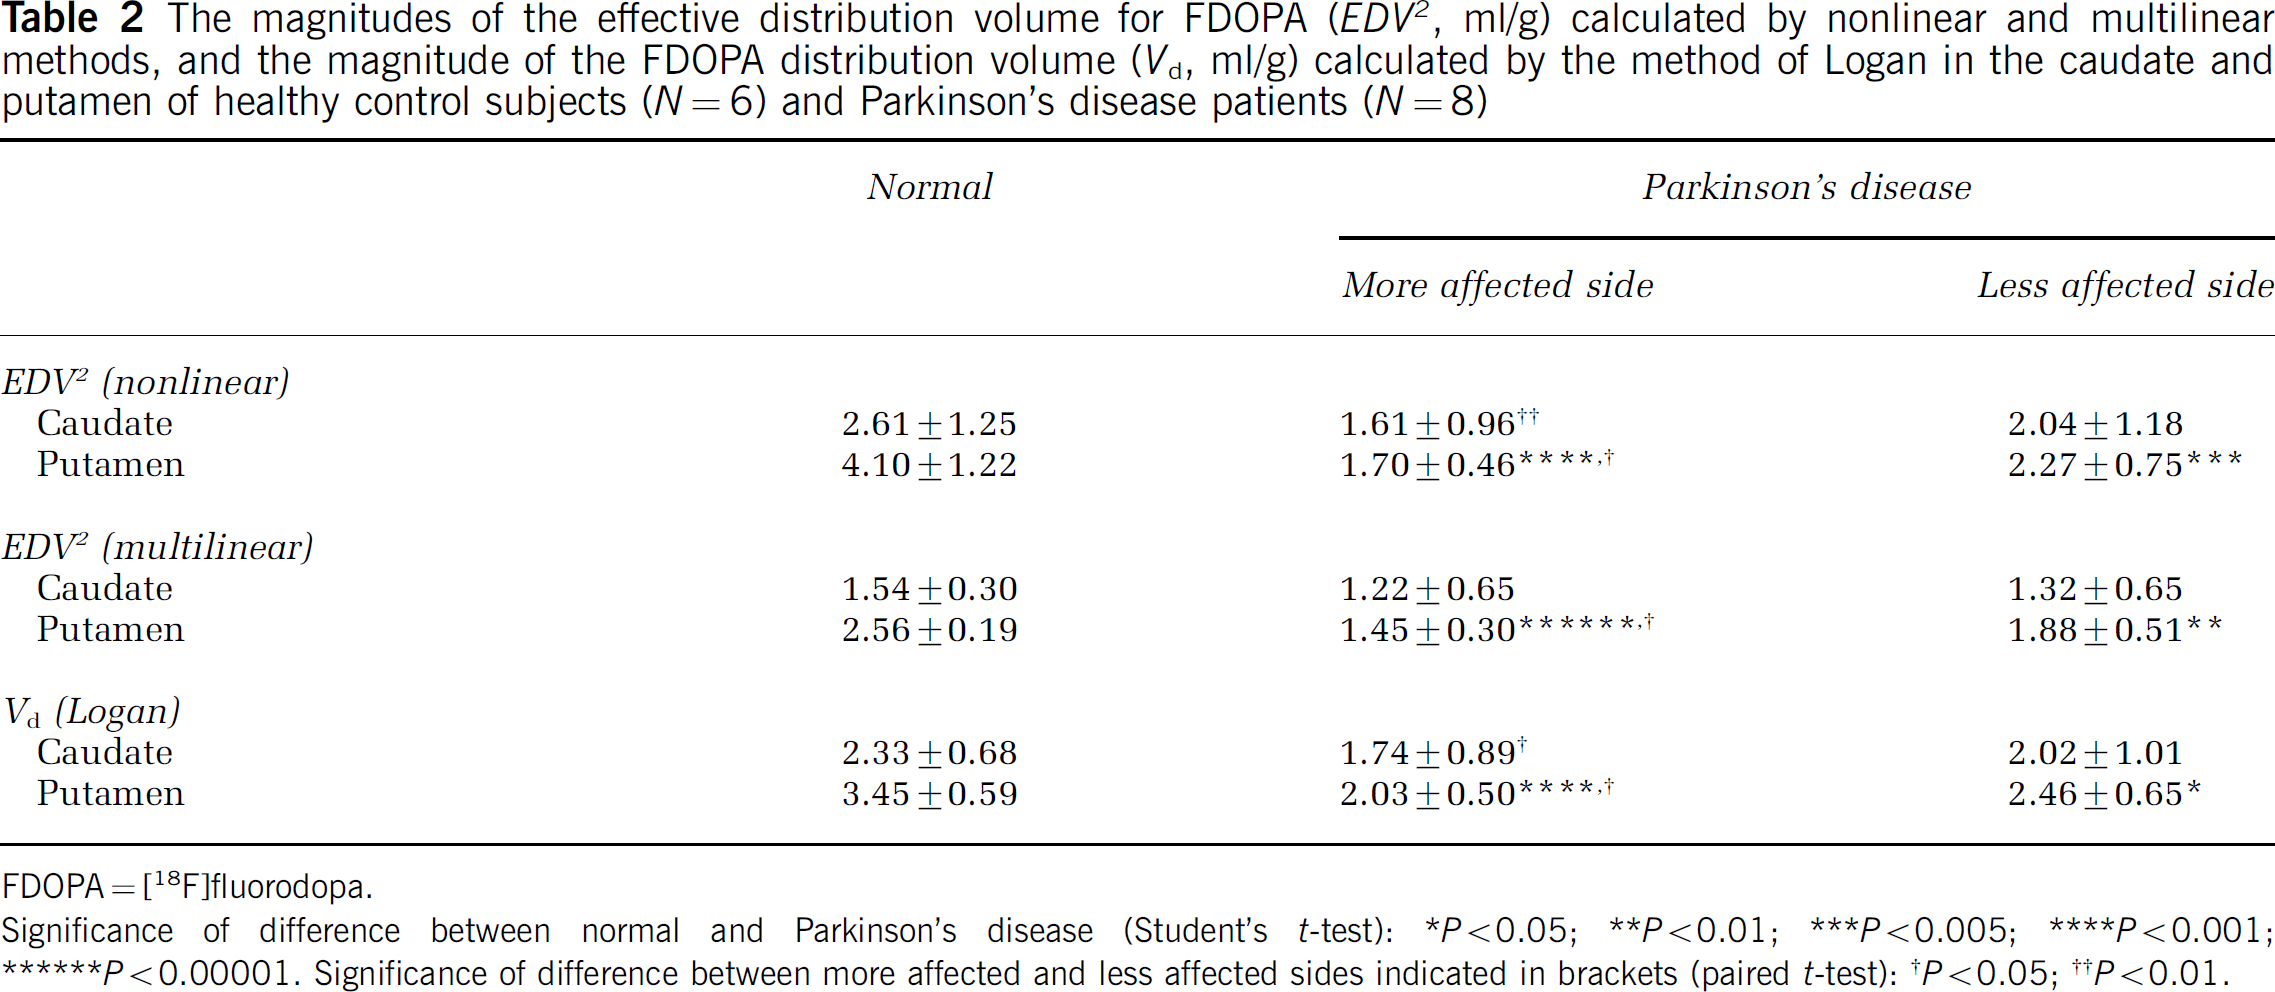
Using VOI analysis, there were no side-to-side differences in the mean magnitude of any estimates in the caudate and putamen of the normal group. Mean estimates of the magnitudes of Kappin, and of kloss calculated by the two methods in the caudate and putamen of the normal group (left and right together) and the PD group (more affected and less affected sides) are presented in Table 1. Relative to the normal aged group, the mean magnitude of Kappin was significantly decreased in the putamen, whereas kloss was significantly increased in the putamen of the PD patients, and also in the caudate, contralateral to the most severe motor symptoms. Side-to-side differences in both parameters were present in the caudate and putamen of the PD group. Mean estimates of the magnitudes of EDV2 calculated by the nonlinear and multilinear methods and of Vd calculated by the method of Logan in the caudate and putamen of the normal group (left and right together) and the PD group (more affected and less affected sides) are presented in Table 2. Magnitudes of EDV2 and Vd were significantly reduced in the putamen relative to the healthy aged controls, but side-to-side differences were present in the putamen, and also in the caudate of the PD group.
The magnitudes of the net blood–brain clearance of FDOPA (Kappin, ml/g min)) and the elimination rate constant for [18F]fluorodopamine formed in the brain calculated by nonlinear and multilinear methods (kloss, min−1) in the caudate and putamen of healthy control subjects (N = 6) and Parkinson's disease patients (N = 8)
FDOPA = [18F]fluorodopa.
Significance of difference between normal and Parkinson's disease (Student's t-test): **P<0.01; ***P <0.005; ****P <0.001; ***** P<0.0001. Significance of difference between more affected and less affected sides indicated in brackets (paired t-test): †P<0.05; ††P<0.01; †††P<0.005; ††††P<0.001. Significance of difference between normal and Parkinson's disease (Welch's t-test): ‡P<0.05.
The magnitudes of the effective distribution volume for FDOPA ((EDV2, ml/g) calculated by nonlinear and multilinear methods, and the magnitude of the FDOPA distribution volume (Vd, ml/g) calculated by the method of Logan in the caudate and putamen of healthy control subjects (N = 6) and Parkinson's disease patients (N = 8)
FDOPA =[18F]fluorodopa.
Significance of difference between normal and Parkinson's disease (Student's t-test): * P<0.05 ** P<0.01; *** P<0.005; **** P<0.001; ****** P<0.00001. Significance of difference between more affected and less affected sides indicated in brackets (paired t-test): †P<0.05; ††P<0.01
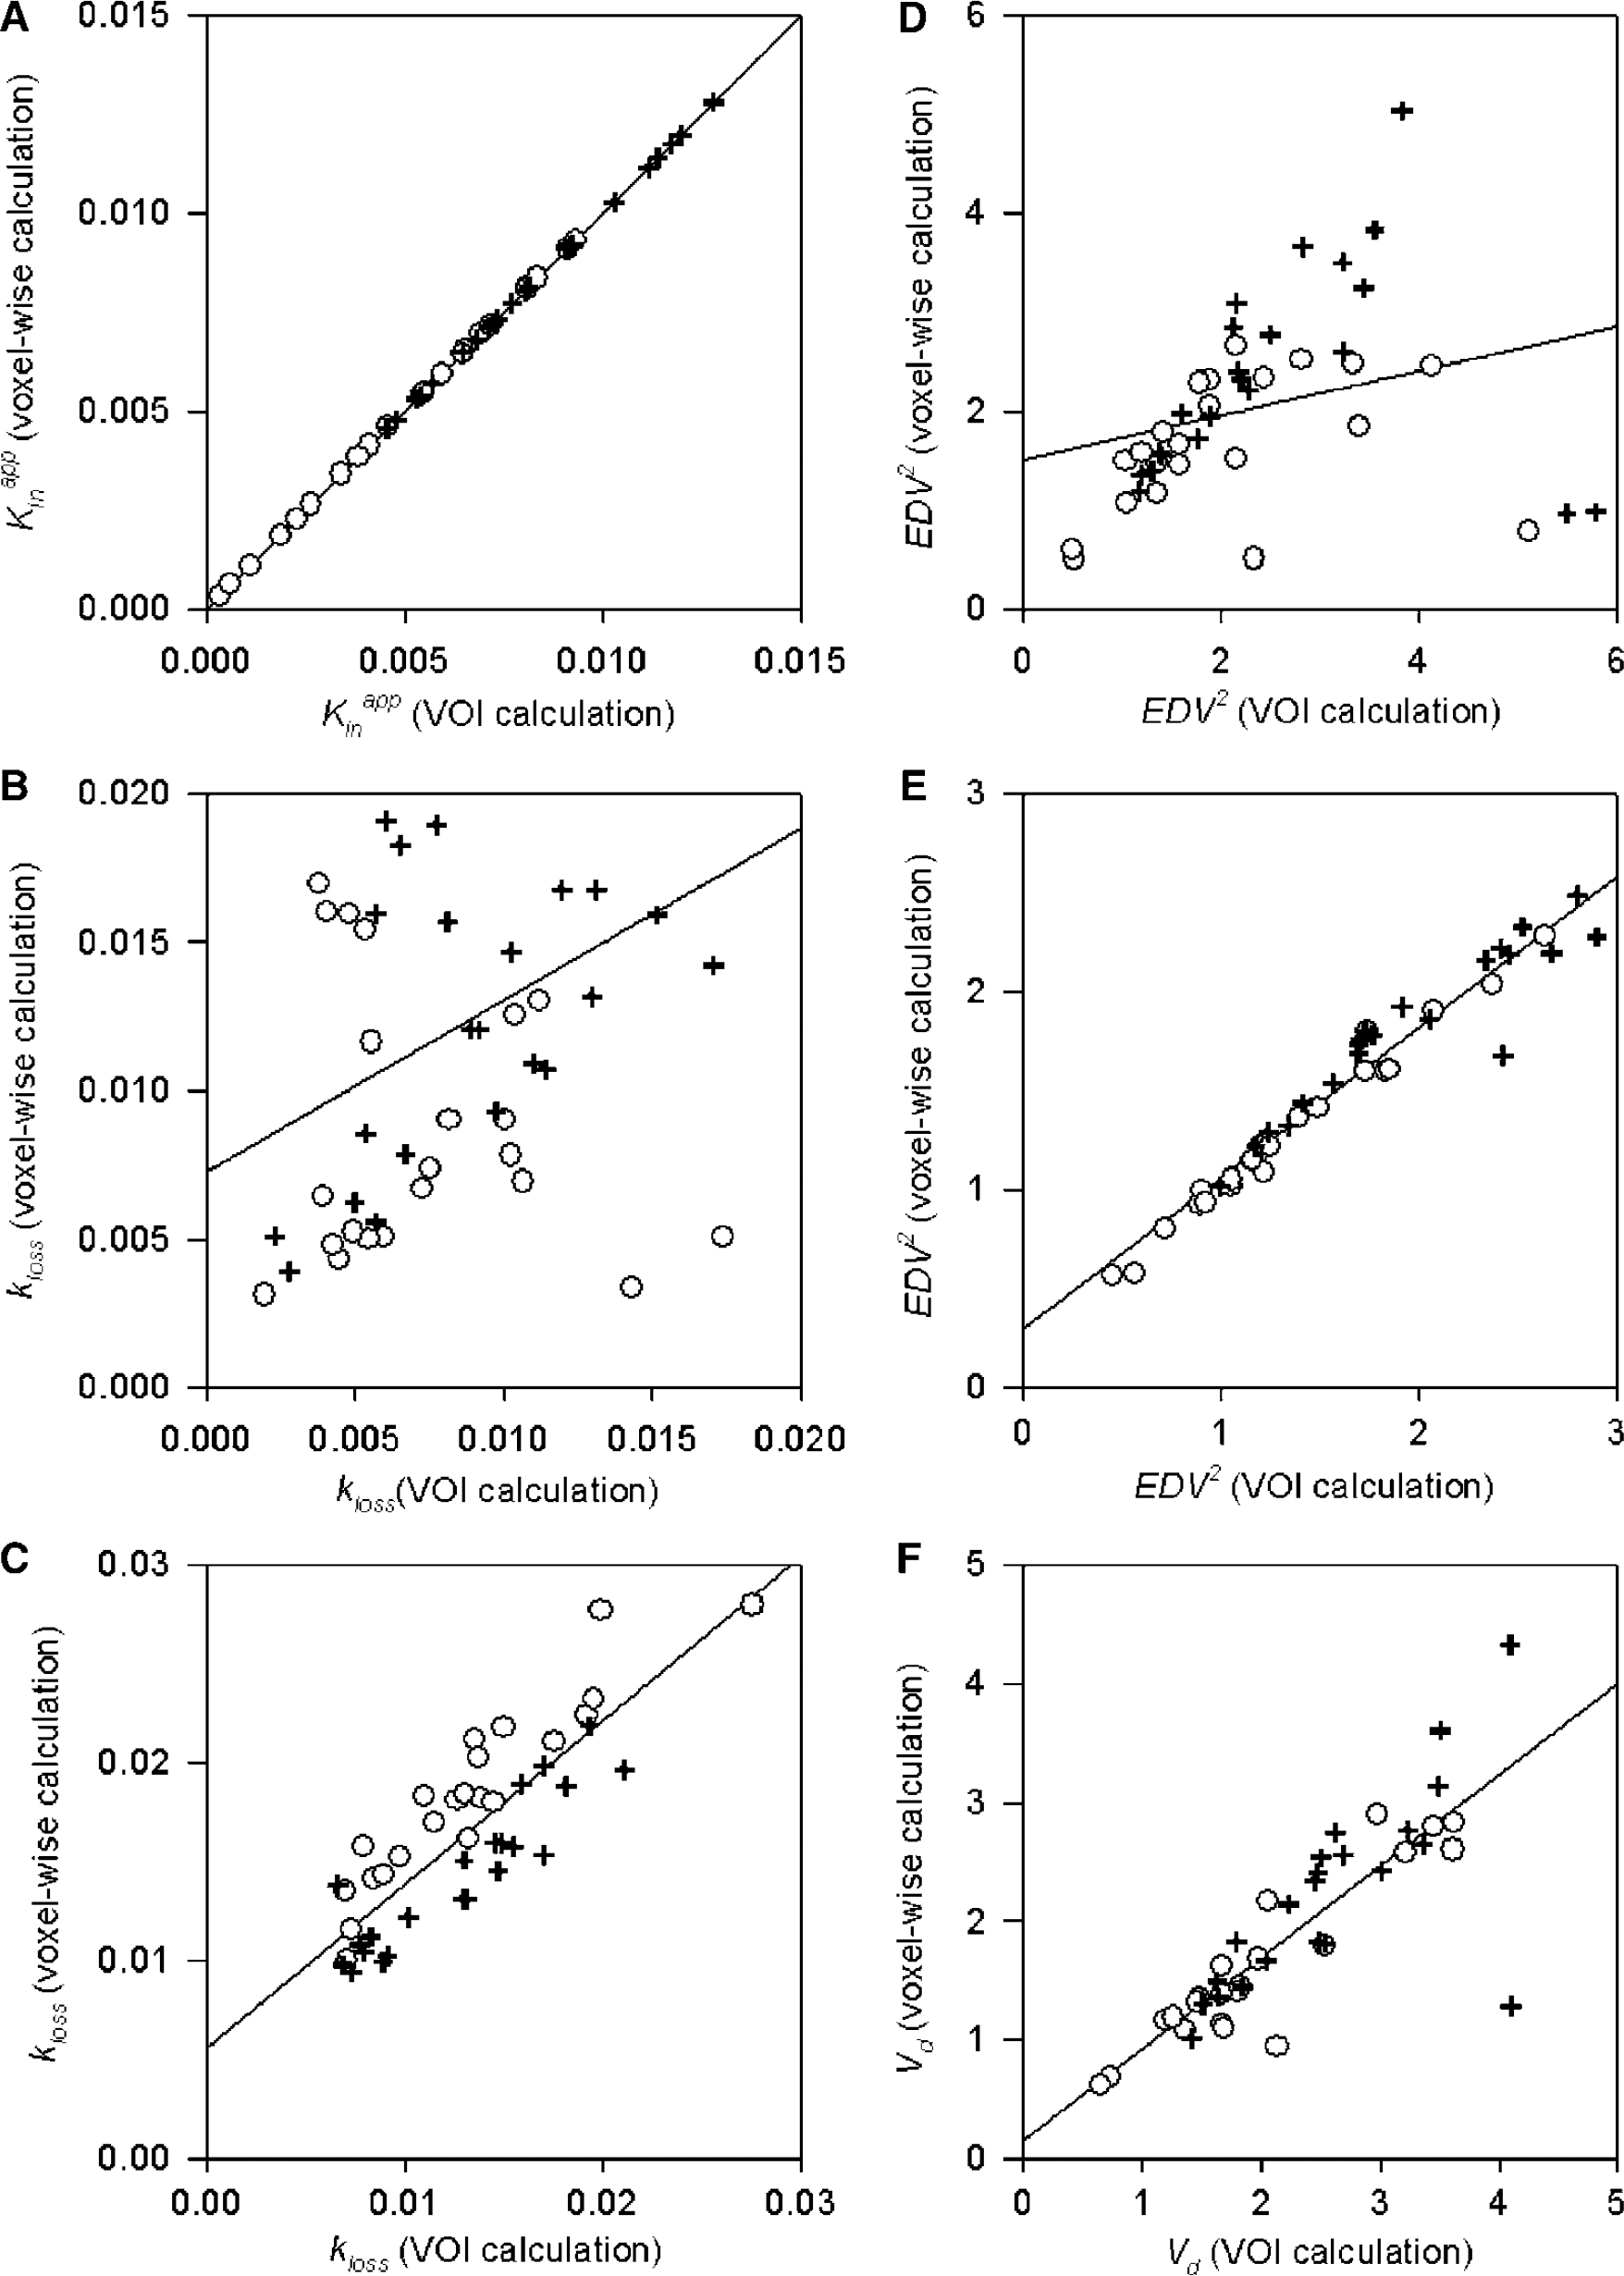
Correlations between VOI-based calculation and voxelwise calculations in the caudate and putamen for both populations are illustrated for Kappin (Figure 5A), for kloss by the nonlinear method (Figure 5B), for kloss by the multilinear method (Figure 5C), for EDV2 by the nonlinear method (Figure 5D), for EDV2 by the multilinear method (Figure 5E), and for Vd by the Logan method (Figure 5F). Results of linear regression analysis for these six kinetic parameters showed that parametric mapping of the linear and multilinear methods had better correlation between voxelwise calculation and VOI calculation than was typical for the nonlinear methods. The correlation coefficients squared (r2), slopes, and ordinate intercepts of the regression analyses were 0.999, 1.000, and 0.000 (Figure 5A), 0.046, 0.273, and 0.008 (Figure 5B), 0.723, 0.827, and 0.006 (Figure 5C), 0.084, 0.224, and 1.503 (Figure 5D), 0.943, 0.763, and 0.292 (Figure 5E), and 0.683, 0.768, and 0.163 (Figure 5F).
Scatter plots for the correlations between voxelwise and volume of interest calculations of net blood–brain clearance of [18F]fluorodopa (FDOPA) (Kappin;
Discussion
In FDOPA/PET studies, radioactivity is preferentially retained in the healthy striatum (Garnett et al, 1983), reflecting the formation in situ of [18F]fluorodopamine (Cumming et al, 1987a, b; Endres et al, 2004). The graphical analysis of FDOPA net influx from plasma Kappin), which is performed after subtraction from the dynamic emission recordings the total radioactivity measured in the cerebellum or other reference region, assumes irreversible trapping of the metabolite [18F]fluorodopamine in the brain in the course of the experiment (Gjedde, 1988; Martin et al, 1989). Based on a generalization of graphical analysis (Patlak and Blasberg, 1985), the method for estimation of Kappin has been extended by correcting for the eventual elimination of FDOPA metabolites (Holden et al, 1997; Doudet et al, 1998; Cumming et al, 2001; Sossi et al, 2001). In this model, [18F]fluorodopamine and its acidic metabolites are assumed to diffuse from the brain as a single metabolic compartment at the rate constant defined as kloss. This approach provides the basis for calculating the EDV of FDOPA in the brain, EDV1, defined as the ratio Kappin/kloss, which is an index of the dopamine storage capacity in the brain. The magnitude of EDV1 was substantially reduced in the striatum of MPTP-treated monkeys (Sossi et al, 2001) and patients with early PD (Sossi et al, 2002), indicating an impaired capacity to retain [18F]fluorodopamine within the brain. The magnitude of EDV1 was reduced by 84% in the striatum of monkeys with severe MPTP lesions compared with healthy monkeys, whereas the magnitude of Kappin declined by only 66% (Cumming et al, 2001). Thus, [18F]fluorodopamine storage capacity in the parkinsonian brain is more impaired than is the net FDOPA influx. However, a practical limitation of the EDV1 method is imposed by the requirement of 4-h long emission recordings for this analysis.
We have shown earlier that the present procedure for the mathematical subtraction of the calculated brain OMFD allows the stable estimation EDV2 (the magnitude of the ratio K/kloss) in VOIs using dynamic emission recordings of only 2-h duration (Kumakura et al, 2005). We have argued furthermore that the calculation of EDV1 may be biased because of oversubtraction of the precursor pool in the brain. The present OMFD subtraction procedure unmasks the curvature in influx plots already present during the interval 60 to 120 mins after FDOPA injection (Kumakura et al, 2005), which is obscured in conventional Kappin plots by the incorrect subtraction of the total mass of FDOPA and OMFD measured in the reference tissue; in effect, the assumptions underlying the method of Sossi and Holden become progressively less violated because of the eventual depletion of FDOPA throughout the brain during 4 h of tracer circulation.
In the present study, we extended our earlier VOI analysis for the case of parametric mapping. Specifically, we introduce a multilinear solution of the FDOPA model, assuming that the distribution volume of the precursor pool approaches a constant value (Equation (8)). The initial phase of fitting the multilinear equation exhibits positive deviation (Figure 1A) because of violation of the assumption of steady state for the precursor pool in the brain, which apparently reaches equilibrium after 10 mins. Once equilibrium is attained, Equations (3) and (5) can be transformed to a convolution form
Then, dividing both sides of Equation (9) by Cp(t) yields Equation (1) with Θ′ as defined by Equation (2), that is, the graphical analysis form derived by a generalization of Patlak and Blasberg (1985). Despite the mathematical similarity between the present nonlinear and multilinear methods, the two methods yielded estimates of kloss and EDV2 of somewhat different magnitude in the basal ganglia, mainly because of extreme sensitivity of the kloss estimation to the number of initial time points excluded in the Patlak graphical analysis extended for nonlinear kloss estimation. However, the nonlinear and multilinear estimates of kloss and EDV2 both successfully distinguished normal subjects and PD patients in parametric maps and in VOI-based analysis, and the magnitude of K was unaffected by the choice of method. By definition, kloss and EDV2 are in a hyperbolic relation (kloss × EDV2 = K). In the course of normal aging and because of PD, the magnitude of EDV2 in striatum declines, while the magnitude of K tends to be unaffected (Kumakura et al, 2005).
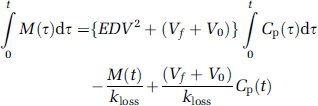
A reference tissue Logan analysis has earlier been tested for measuring the influx of FDOPA to the occipital cortex; the method failed to distinguish normal subjects and PD patients (Kawatsu et al, 2003). In the present analysis, with subtraction of the calculated OMFD in the brain, the Logan graphical analysis assumes a linear form everywhere in the brain between 60 and 120 mins of tracer circulation, suggesting that the rates of FDOPA trapping and of [18F]fluorodopamine elimination are at equilibrium in this interval. The present Logan method detects a decline in FDOPA Vd in the putamen of PD patients relative to the healthy aged group. Furthermore, the magnitude of Vd was intermediate to the linear and nonlinear estimates of EDV2. A rearrangement of the multilinear equation (8), divided by M(t) and disregarding the third Cp(t)/M(t) term, which approaches zero with time, yields:
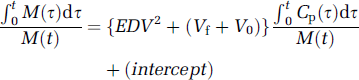
which has the same form as the Logan linearization, and likewise correctly predicts that the magnitude of Vd should exceed that of EDV2, calculated by the multilinear method, by a small offset (Vf + V0) (Figure 1B). Thus, the Logan method with the subtraction of OMFD presents a useful alternative procedure for calculating FDOPA storage capacity in the living brain, and might present a convenient approach for equilibrium analysis in FDOPA/PET studies with catechol-O-methyltransferase inhibition (e.g., Ruottinen et al, 1995; Ishikawa et al, 1996).
The Logan graphical analysis is frequently used for tracers with reversible kinetics in terms of tracer exchange across blood–brain barrier. However, it is noteworthy that in first-order compartmental models, the vascular input activity Cp(t) is sampled upstream to the capillary bed containing the VOI (Munk et al, 2003), and the effect of tracer efflux on downstream plasma radioactivity is ignored. Therefore, these models are in general insensitive to the destination of tracer exported from the VOI, which could be CSF or venous blood. In the current study, two metabolic compartments, which have been defined for nondiffusible [18F]fluorodopamine and its diffusible acidic metabolites (Kuwabara et al, 1993), are collapsed to a single diffusible compartment at steady state (Deep et al, 1997). In any case, Logan analysis with a plasma input is valid for an arbitrary number of brain compartments (Gunn et al, 2002).
The statistical noise in voxelwise PET signals can contribute to bias in the estimation of kinetic parameters relative to estimates obtained for larger VOIs (Carson, 1993; Cumming et al, 2003; Ichise et al, 2003; Logan, 2003; Slifstein and Laruelle, 2000; Zhou et al, 2003). Therefore, we have in the present study made a systematic investigation of the bias in voxelwise estimates of several kinetic parameters for FDOPA in the caudate and putamen (Figure 5). In the case of Kappin, there was a complete lack of bias and scatter about the regression line, indicating the stability of this robust linearization in which the abscissa is entirely unaffected by noise in the PET data. In the cases of the nonlinear estimates of kloss and EDV2, there were poor correlations between the voxelwise and VOI-based estimates for the caudate and putamen; the extreme noisiness of the nonlinear voxelwise maps is likewise evident in Figure 4. In contrast, parametric mapping of EDV2 and kloss using the multilinear approach (Equation (8)) produces much smoother maps. However, the voxelwise bias properties of these two parameters are not identical; whereas voxelwise estimates of EDV2 are consistently underestimated by 13% relative to VOI-based estimates (Figure 5E), the voxelwise estimates of kloss tend to be overestimated when kloss is less than 0.015 min−1, especially in the caudate nucleus (Figure 5C), which may reflect anatomic differences in the sensitivity of this parameter to effects of partial volume (Rousset et al, 2000). Optimization of the simultaneous estimations of EDV2 and kloss using a multilinear algorithm may require further investigation, although the present study places emphasis on the more stable voxelwise estimates of EDV2, the equilibrium binding parameter that reflects storage capacity for [18F]fluorodopamine. Finally, there was a negative bias in the voxelwise estimation of Vd by the modified Logan method (25%, but declining to 11% with exclusion of one out-lying point), consistent with earlier Monte Carlo simulations for receptor ligands (Slifstein and Laruelle, 2000).
The relationship between lateralization of PD motor symptoms and markers of dopamine innervation has been investigated in a number of previous imaging studies. For example, asymmetry in the magnitude of Kappin, the FDOPA influx relative to a reference tissue (also known as Kappin), correlated with clinical asymmetry in limb rigidity in PD patients (Eidelberg et al, 1990; Ito et al, 1999; Rakshi et al, 1999). In a SPECT study with the dopamine/serotonin transporter ligand [123I]beta-CIT, striatal binding was most reduced contralateral to motor symptoms of patients with asymmetric PD (Brucke et al, 1997). Finally, the Kappin for FDOPA and the specific binding of [18F]CFT to dopamine transporters seemed equally suited to the detection of asymmetric changes in dopamine innervations (Rinne et al, 2001).
In previous studies, the magnitude of Kappin was significantly reduced only in the putamen of patients with early PD (Bhatt et al, 1991; Rakshi et al, 1999; Rousset et al, 2000; Kumakura et al, 2004), although the magnitude of Kappin was significantly reduced by 25% in the caudate of a large cohort (N = 35) of PD patients relative to healthy control subjects (Lee et al, 2000). Thus, the general lack of earlier reports of reduced FDOPA utilization in the caudate nucleus may reflect insufficient statistical power to detect relatively small declines in that structure (25% to 40% in the present study of eight PD patients). However, the present parametric mapping procedure reveals a significant increase in the magnitude of kloss in the caudate (and putamen) of eight PD patients relative to healthy controls, as well as significant asymmetries in the magnitudes of Kappin, kloss, and EDV2 in both the caudate and putamen of PD patients with clinical asymmetry, with the greatest changes contralateral to the side with greatest motor symptoms. As in an earlier compartmental analysis (Rousset et al, 2000), the magnitude of kloss was increased 50% in the caudate and two-fold in the putamen of early PD patients. Similar two-fold increases in kloss have been reported in the whole striatum of monkeys with MPTP-induced parkinsonism (Doudet et al, 1997; Sossi et al, 2001; Cumming et al, 2001), and in the putamen of patients with early PD (Sossi et al, 2002). We have earlier attributed a decreased capacity to retain [18F]fluorodopamine in the brain to a specific loss of vesicular storage in PD patients (Kumakura et al, 2005). Indeed, the binding of [11C]dihydrotetrabenazine to vesicles (Frey et al, 1996; Lee et al, 2000) and the availability of dopamine transporters for [11C]methylphenidate (Lee et al, 2000) were significantly decreased in the caudate of PD patients. Thus, the present FDOPA results are consistent with earlier imaging results— that the biochemical pathology of early PD is not restricted to the putamen, but is also present in the caudate nucleus—and with earlier postmortem findings of dopamine loss also in the caudate of patients dying with PD (Kish et al, 1988).
The dopamine innervation of the caudate is implicated more in cognitive performance than in motor symptoms of PD. Thus, in a PET study of dopamine transporters, binding in the caudate nucleus correlated inversely with sequence learning in PD patients (Carbon et al, 2004). In earlier FDOPA/PET studies, Kappin in the caudate of PD patients correlated inversely with performance of a memory task (Holthoff-Detto et al, 1997), somatosensory discrimination (Weder et al, 1999), and the Stroop interference task (Rinne et al, 2000; Brück et al, 2001). We now use quantitative parametric methods to reveal an increased elimination rate constant for [18F]fluorodopamine in the most affected caudate nucleus of patients with early PD, predicting that cognitive processes may be influenced by asymmetric changes in dopamine turnover.
In conclusion, we have implemented several new procedures for the parametric mapping of FDOPA utilization in the human brain. For these analyses, the calculated brain radioactivity concentration of the FDOPA metabolite OMFD was first subtracted from 2-hour long dynamic emission recordings. After this subtraction, a novel multilinear solution of a one metabolite-trapping compartment FDOPA model was defined for mapping the magnitude of indices of [18F]fluorodopamine storage capacity in the striatum, whereas a novel application of the Logan graphical analysis was used to map tracer distribution volume. All these methods showed a substantial decline in the capacity to store [18F]fluorodopamine in the putamen of patients with early PD patients, most notably on the side contralateral to the major motor symptoms. Of the several methods, multilinear estimates of EDV2 were most sensitive to discrimination of PD and normal putamen. However, only kloss also detected a biochemical abnormality in the caudate of PD patients relative to normal subjects, suggesting that the biochemical pathology of the early disease is not restricted to the putamen. In general, the present parametric mapping methods are particularly suited to detecting asymmetric changes in the caudate and putamen of patients with early PD.