
Abstract
Intensive insulin therapy in patients with type 1 diabetes mellitus reduces long-term complications; however, intensive therapy is also associated with a three-fold increase in hypoglycemic episodes. The present study in conscious rats characterizes the physiologic and neuropathologic consequences of a single episode of moderate hypoglycemia. In this model, intravenous insulin is used to reduce plasma glucose to 30 to 35 mg/dL for 75mins. This single hypoglycemic insult acutely induces hypoglycemia-associated autonomic failure (HAAF), with epinephrine responses to hypoglycemia reduced more than 36% from control. Neuropathology after this insult includes the appearance of dying cells, assessed with the marker Fluoro-jade B (FJ). After hypoglycemic insult, FJ+ cells were consistently seen in subdivisions of the medial prefrontal cortex, the orbital cortex, and the piriform cortex. There was a significant correlation between depth of hypoglycemia and number of FJ+ cells, suggesting that there is a critical threshold below which vulnerable cells begin to die. These data suggest that there is a population of cells that are vulnerable to moderate levels of hypoglycemia commonly experienced by patients with insulin-treated diabetes. These cells, which may be neurons, are primarily found in cortical regions implicated in visceral perception and autonomic control, raising the possibility that their loss contributes to clinically reported deficits in autonomic and perceptual responses to hypoglycemia.
Introduction
Hypoglycemia is a common occurrence in individuals treated with insulin for type 1 diabetes mellitus, and the incidence of hypoglycemia increases in patients striving to maintain optimal glycemic control to reduce long-term diabetic complications (DCCT, 1993, 1997). When hypoglycemia occurs because of exogenous insulin administration for diabetes, recovery from hypoglycemia is largely integrated by the central nervous system (CNS). In response to insulin-induced hypoglycemia, the brain initiates behavioral, autonomic, and endocrine responses including food intake, increased gastric motility, secretion of epinephrine, glucocorticoids, and growth hormone, and increased sympathetic nervous system activity. Recurrent episodes of hypoglycemia are associated with decreased conscious perception of the hypoglycemic state and blunted or absent secretion of counterregulatory hormones. These sequelae of recurrent hypoglycemia are termed ‘hypoglycemia unawareness’ and ‘hypoglycemia-associated autonomic failure’ (HAAF), respectively (Gerich et al, 1991; Cryer, 2001). One approach to elucidating the nature of these hypoglycemia-induced deficits is to study animal models of HAAF.
When rats sustain 2 to 7 episodes of mild hypoglycemia (40 to 60 mg/dL), they have diminished epinephrine responses to hypoglycemic challenge administered 1 day later. Variable effects on norepinephrine, glucagon, and corticosterone responses to hypoglycemia have been reported (Evans et al, 2001; Shum et al, 2001; Flanagan et al, 2003; De Vries et al, 2004). A recent report indicates that a single prolonged episode of moderate hypoglycemia does not significantly reduce the epinephrine response to subsequent hypoglycemic challenge (Paranjape and Briski, 2004). We previously reported that three episodes of moderate hypoglycemia (30 to 35 mg/dL) delivered at 48 h intervals resulted in decreased epinephrine responses. Rats killed after one to three hypoglycemic episodes also had positive TUNEL staining in cells of the arcuate nucleus, indicating DNA damage, and reduced mRNA for arcuate neuropeptide Y (NPY) and proopiomelanocortin (POMC) (Tkacs et al, 2000).
Pathologic effects of hypoglycemia on the brain have also been studied using a model of severe hypoglycemia induced in anesthetized rats while continuously monitoring EEG. Neuroglycopenia is maintained at a level to produce cerebral isoelectricity for 30 to 60 mins duration, with blood glucose values less than 15 mg/dL. After this insult, extensive neuron death occurs in cortical layers 2 and 3, in the striatum, and in hippocampal neurons, particularly in the dentate gyrus (Auer et al, 1984; Ouyang et al, 2000). The effect of severe hypoglycemic coma on counterregulatory responses to hypoglycemia has not been reported.
The first experiment we report here aimed to confirm and extend our previous finding that a single episode of moderate hypoglycemia is sufficient to reduce counterregulatory hormone responses to subsequent hypoglycemia (Tkacs et al, 2000). The time points and experimental manipulations were based on our prior study with the following modifications: epinephrine, norepinephrine, glucagon, and corticosterone responses to equivalent mild hypoglycemia were compared between rats studied 48 h after a single episode of moderate hypoglycemia and control, pair-fasted rats. Immediately after blood sampling for hormone measurements was completed, these rats were euthanized and perfused for subsequent neuropathologic assessment using Fluoro-Jade B (FJ), a recently developed putative marker of neuron death (Schmued and Hopkins, 2000; Sato et al, 2001; Munñoz et al, 2001). The second experiment characterized the time course of appearance of FJ and other injury markers after moderate hypoglycemia in rats that were not subjected to blood sampling for hormone measurements.
Materials and methods
All protocols used in these experiments were reviewed and approved by the University of Pennsylvania Institutional Animal Care and Use Committee. At all times, the work performed was in accord with the Guide for the Care and Use of Laboratory Animals of the Institute of Laboratory Animal Resources, Commission on Life Sciences, National Research Council, 1996.
Animal Preparation and Handling
The experiments were performed on adult male Sprague–Dawley rats. After shipping, the rats were group-housed and held for 1 week before surgery to allow recovery from stress. Rats were maintained in a Research Animal Facility of the University of Pennsylvania in a temperature and humidity controlled room with 12:12 h light:dark cycle (lights on at 0700) and with free access to rodent chow (Lab Diets) and water. Surgery was performed under a combined anesthetic/analgesic mixture of ketamine/xyla-zine/buprenorphine (50, 10, and 0.2 mg/kg, respectively, delivered by intraperitoneal injection). The right jugular vein was isolated and a saline-filled silastic catheter was introduced and advanced to the approximate level of the superior vena cava/right atrium junction. The catheter was tunneled subcutaneously to exit between the scapulae and was closed with a stainless steel plug. Daily catheter care involved aspiration of any clots and refilling with a suspension of polyvinylpyrrolidone (20% PVP-40) in sterile heparinized saline (50 U/mL heparin). Rats were maintained until they recovered preoperative weight before initiating the experimental protocol 5 to 7 days after surgery.
Experiment 1: The Effect of a Single Episode of Hypoglycemia on Counterregulatory Hormone Responses to Subsequent Hypoglycemia and Brain Fluoro-Jade B Staining
Male Sprague–Dawley rats were obtained from Charles River Laboratories, Kingston, NY, USA. Initial weights ranged from 320 to 360 g. Rats were surgically prepared with jugular venous catheters as described above. Rats were maintained postoperatively until they regained preoperative weight. During this time, the rats were given a 2-h period of training to the experimental conditions in the procedure room. For the first hypoglycemic episode, rats were fasted overnight before the treatment day. In the morning, rats were brought to the procedure room and were administered insulin 4 U/kg (intravenous) (insulin-insulin n = 10) or saline (saline–insulin n = 8). Blood samples (75 µL) for glucose and lactate were drawn every 15 mins after insulin and every 30 mins after saline and were analyzed using an YSI 2700 glucose/lactate analyzer (Yellow Springs Instruments, Yellow Springs, OH, USA). Additional doses of insulin 0.5 to 1 U/kg (intravenous) were administered to maintain hypoglycemia at a level between 30 and 35 mg/dL for 75 mins. After the 90 mins blood sample was drawn, insulin-treated rats were administered dextrose 1 g/kg intravenously to restore euglycemia, and food was returned to all rats.
For the second hypoglycemic episode, 48 h after the initial hypoglycemic episode, all rats were fasted overnight before hypoglycemic challenge. An initial blood sample was drawn to measure baseline levels of glucose, lactate, epinephrine, norepinephrine, glucagon, and corticosterone. Insulin was administered at a dose of 0.75 U/kg (intravenous). This dose was repeated for a total of 3 times at 5 mins intervals, and a small sample for blood glucose was drawn 5 mins after the third dose. This insulin-dosing schedule was developed in pilot studies with the aim of maintaining plasma glucose at 40 to 45 mg/dL for 2 h. Additional doses of 0.25 to 0.75 U/kg were administered as necessary to maintain the desired level of hypoglycemia. Blood was drawn for glucose, lactate, and hormone measurements at 20, 40, 60, 80, and 120 mins after insulin. In each case, the blood sample volume was 0.8 mL. The blood was centrifuged, plasma was removed and red blood cells were resuspended in saline and returned to the rat via the intravenous catheter. After the final blood sample the rats were deeply anesthetized with sodium pentobarbital and were perfused via the aorta with heparinized saline followed by 4% paraformaldehyde in phosphate buffer. Brains were removed and were postfixed in 4% paraformaldehyde for several hours. Forebrain and brainstem blocks were then cryoprotected in 30% sucrose overnight, frozen on powdered dry ice, and kept at −80°C until sectioning. Forebrain and brainstem sections were cut at 40 µm thickness on a Leica cryostat and were saved serially in six wells with an ethylene glycol-based cryoprotectant (Watson et al, 1986). Sections were held at −20°C until staining.
Histology
For the FJ staining procedure, one set of sections (comprising a one-in-six series through the forebrain or brainstem) was removed from the cryoprotectant, rinsed in PBS, after which sections were mounted on gelatin-coated slides and were air-dried for at least 24 h. Fluoro-Jade B (Histo-Chem, Jefferson, AR, USA) staining was performed following the protocol described by Hopkins et al (2000), except that the incubation time in potassium permanganate was reduced to 5 mins. Sections were examined using an Olympus fluorescence microscope and Chroma filter set 41001 (FITC/Bodipy/Fluo3/DiO). All fluorescent cells were counted for each set of brain sections by an observer who was masked to the treatment groups. Forebrain sections from the first six rats represented levels from 1 mm anterior to bregma through the posterior hypothalamus, based on atlas plates (Paxinos and Watson, 1998). After this processing was completed, it was apparent that FJ staining was maximal in the most rostral sections, so forebrain blocks for the remaining 12 rats included the entire forebrain from the olfactory bulbs through the posterior hypothalamus.
Statistical analysis was performed using two-way repeated measures analysis of variance and area under the curve measurements were compared between treatment groups using unpaired t-tests.
Hormone Assays
Plasma for catecholamine assay was vortexed with 5 N perchloric acid and then immediately frozen on dry ice and held at −70°C for further processing. After all rats completed the protocol, the samples were briefly thawed and centrifuged, and 100 µL of supernatant was mixed with the internal standard dihydroxybenzylamine. Catecholamine assay using HPLC with electrochemical detection was performed at the VAMC in East Orange, NJ, USA. Plasma for glucagon assay was mixed with protease inhibitor consisting of leupeptin, trasylol, and EDTA, following the protocol of the University of Pennsylvania Diabetes Center radioimmunoassay core facility. Glucagon radioimmunoassay was performed using the Linco antibody and corticosterone assay was performed using an enzyme immunoassay kit from ALPCO.
Experiment 2: Time Course of Fluoro-Jade B Appearance
Experiment 2A. The results of experiment 1 indicated that FJ was present in brains collected 2 h into a second episode of hypoglycemia, and we hypothesized that this staining was the result of the initial episode of moderate hypoglycemia 48 h before killing. We thus elected to assess the time course of FJ staining after a single episode of moderate hypoglycemia. The time course of FJ staining was evaluated in 33 rats in which brains were collected 4, 8, 12, 24, 48, 72 h or 5 or 10 days after one episode of hypoglycemia.
Experiment 2B. Previous work in this lab and others studied hypoglycemia repeated at least two times, which might be expected to exacerbate neuronal damage and death. Therefore, the neuropathologic consequences of repeated hypoglycemia were studied in an additional four rats. These rats were subjected to 2 episodes of hypoglycemia, 2 days apart, and were perfused 24 h (n = 2) or 48 h (n = 2) after the second episode of hypoglycemia.
Tissue Processing for Experiments 2A and 2B
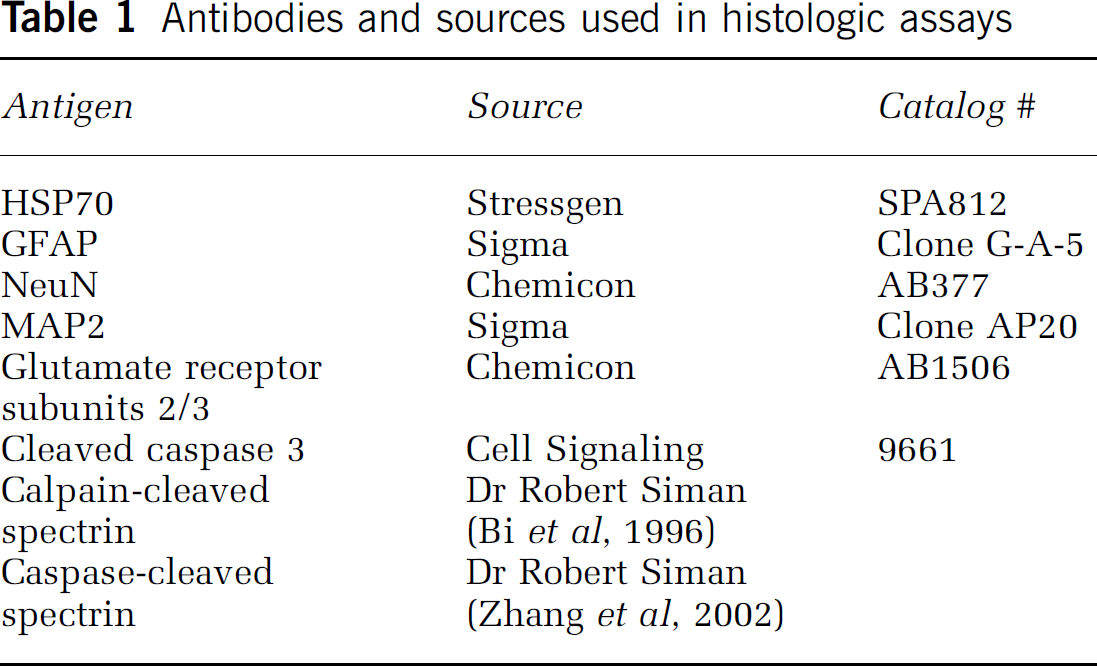
Brain sections from all rats subjected to hypoglycemic insult were processed for FJ. FJ+ cells were counted on sections representing 1 mm intervals through the forebrain from 4.7 mm anterior to bregma through 4.3 mm posterior to bregma. Selected additional sections from rats at 12, 24, or 48 h after hypoglycemic insult were processed using immunohistochemistry for the following markers of neuron injury or death: 72 kDa heat shock protein (HSP70), activated caspase-3, a calpain-generated spectrin cleavage product or a caspase-generated spectrin cleavage product. Antibody detection was performed using a Vector ‘Elite’ ABC kit and diaminobenzidine as the chromogen. Reactive gliosis was assessed using a mouse monoclonal antibody to glial fibrillary acidic protein (GFAP). Additional selected sections were used to assess double-label fluorescent immunohistochemistry with FJ staining using antibodies for neurons (NeuN, MAP2), astrocytes (GFAP), and glutamate receptor subunits 2/3. A list of antibodies used in these experiments and their sources is shown in Table 1.
Antibodies and sources used in histologic assays
Experiment 3. The cardiovascular effects of hypoglycemic insult were assessed in two rats. In these rats, carotid artery catheters were inserted in addition to jugular venous catheters. After recovery, rats were subjected to 90 mins of insulin-induced hypoglycemia after an overnight fast, with continuous recording of blood pressure and heart rate using the Micro-Med BPA system (Louisville, KY, USA).
Data Analysis
Data were entered into SPSS 11.0 (SPSS, Chicago, IL, USA) for statistical analysis. Data are expressed as mean ± standard deviation throughout the report. Statistical comparison for hormone measurements used two-way repeated measures analysis of variance. Area under the curve measurements were compared with unpaired t-test. Counts of FJ+ cells over time after hypoglycemia were compared with one-way analysis of variance. Significance was set at P < 0.05 for all statistical tests.
Results
Experiment 1
Blood glucose, lactate, and hormones: On day 1 of this experiment, the initial treatment consisted of one episode of hypoglycemia in overnight fasted rats or a control episode consisting of blood sampling in overnight fasted rats. Blood glucose levels in the HYPO rats declined to a nadir of 29.8 ± 4.9 mg/dL 30 mins after insulin injection and averaged 34.6 ± 6.1 mg/dL over the 75 mins hypoglycemic episode. Recovery from hypoglycemia was accomplished with intravenous dextrose and with food. Glucose, lactate, and hormone responses to mild hypoglycemic challenge were assessed in all rats 48 h after the first treatment. At that time, hypoglycemia was maintained for 120 mins at average blood glucose of 40 mg/dL in saline–insulin and insulin–insulin rats (Figure 1A). The lactate response to repeat hypoglycemia was significantly lower in insulin–insulin rats than in saline–insulin rats, which experienced hypoglycemia for the first time (Figure 1B, interaction of time and group F(512) = 3.397, P = 0.038, repeated measures ANOVA). Epinephrine results from the first 6 rats were lost because of technical difficulties with the assay, so the epinephrine data are based on measurements from the final 12 rats (7 insulin–insulin, 5 saline–insulin). The epinephrine response to hypoglycemia was significantly blunted in insulin–insulin rats, relative to saline–insulin rats (Figures 1C and 1D, no significant group × time interaction; effect of group F(1,10) = 6.492, P = 0.029; mean AUC is different by unpaired t-test, P = 0.04). Glucagon (Figure 1E), corticosterone (Figure 1F), and norepinephrine (not shown) responses to hypoglycemia were not significantly different between treatment groups.
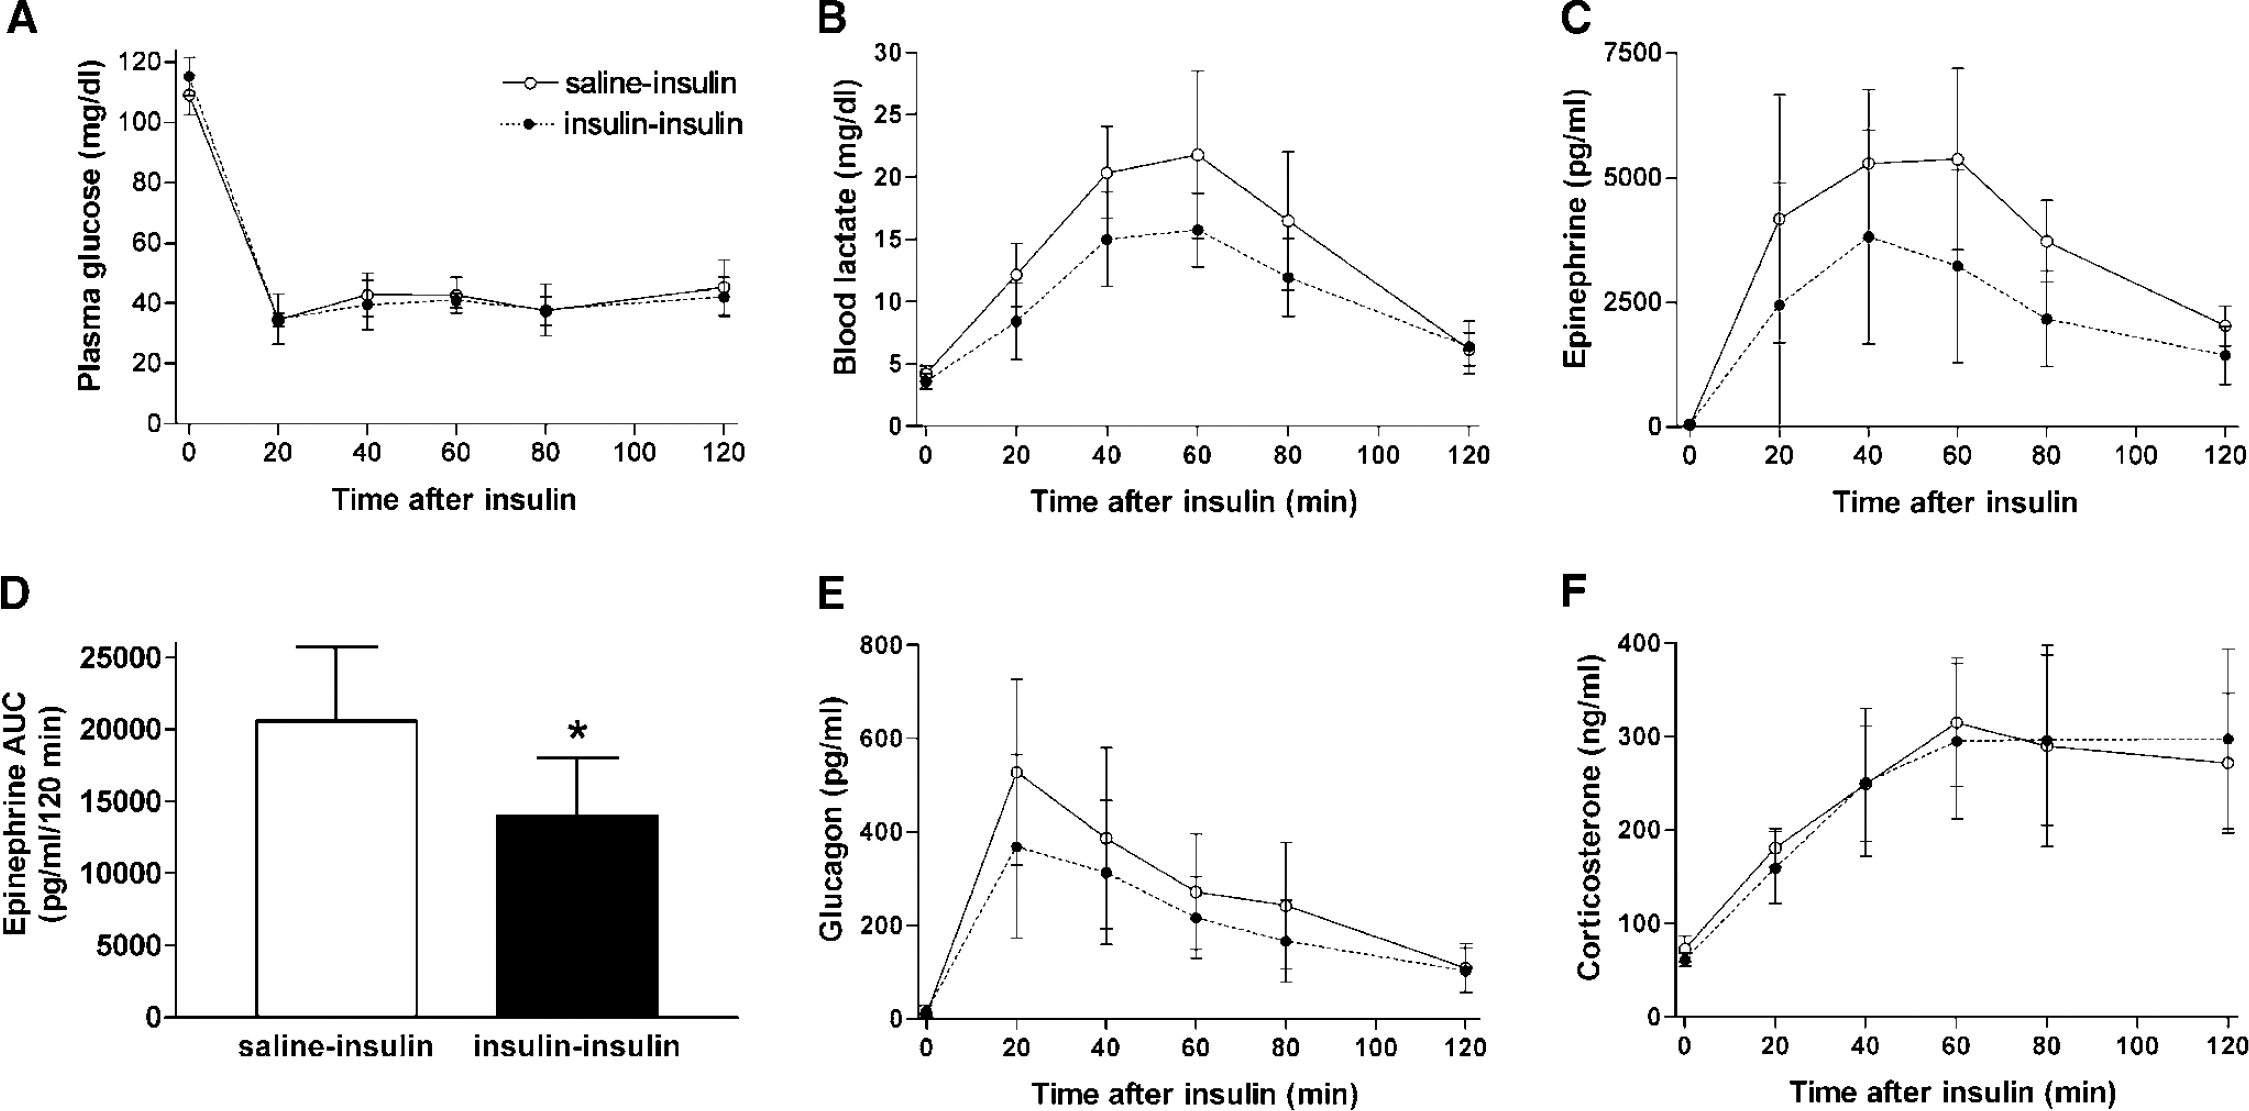
Glucose, lactate, and hormone responses to hypoglycemia in saline–insulin and insulin–insulin rats. The legend in panel (
Histology
Experiment 1: Fluoro-Jade B staining of saline–insulin brains did not result in any detectable fluorescence, while FJ + cells were seen in all insulin–insulin forebrains (Figure 2). Schematic illustrations summarize data from seven HYPO brains with all FJ + cells counted and locations noted on selected representative forebrain sections (Figure 3). FJ + cells were most numerous in sections anterior to bregma. The regions with the greatest numbers of FJ + cells are the piriform cortex and several divisions of the prefrontal cortex, including the prelimbic, infralimbic, and cingulate regions of the medial prefrontal cortex and medial, ventral and lateral subdivisions of the orbital cortex. The structure with the greatest rostro-caudal extent of staining was piriform cortex, where FJ staining was observed on sections from 1.7 mm anterior to bregma through 4.3 mm posterior to bregma. In most cases, the FJ + cells were observed in relatively deep cortical layers (III to V), but there was no obvious laminar distribution of FJ staining. For each brain, a 1 in 6 series was processed with FJ, and the total number of FJ + cells counted on these sections averaged 514 ± 203 cells. The FJ + cells are small, with retracted process, and are similar in staining and morphology to FJ-labeled neurons in published reports of neuron death after hypoglycemia, ischemia, or traumatic brain injury. No FJ staining was observed in any hypothalamic or brainstem sections from insulin–insulin or saline–insulin rats. None of the FJ + cells reacted with antibody for neurons (NeuN—Figure 2, MAP2, glutamate receptor subunits 2/3) or astrocytes (GFAP—Figure 2).
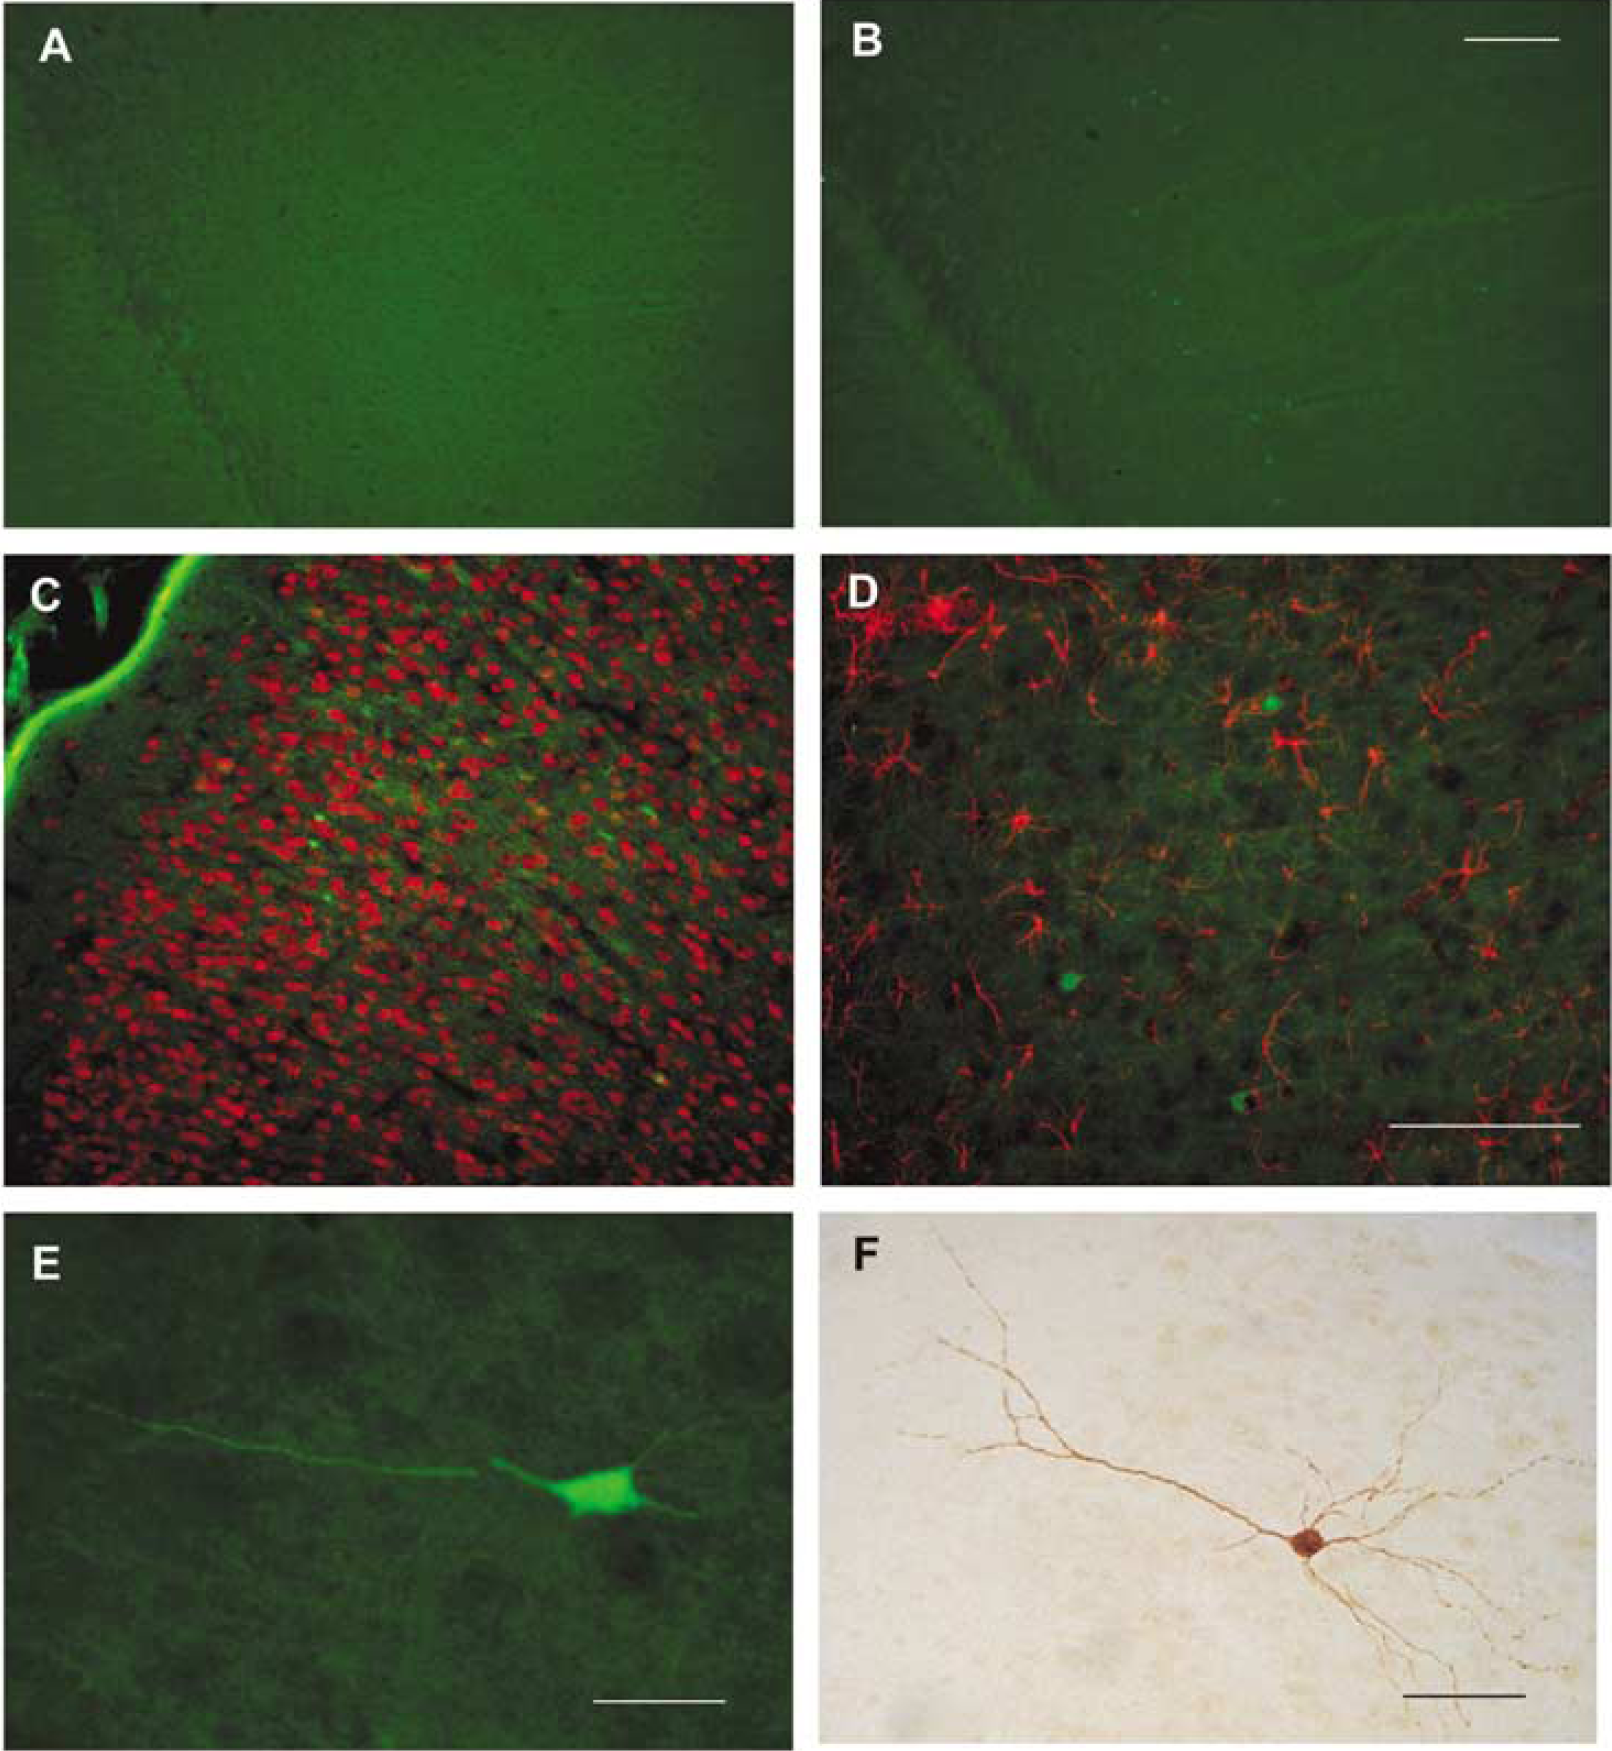
Fluoro-jade B (FJ) labels cortical cells in insulin–insulin brains, not in saline–insulin brains. (
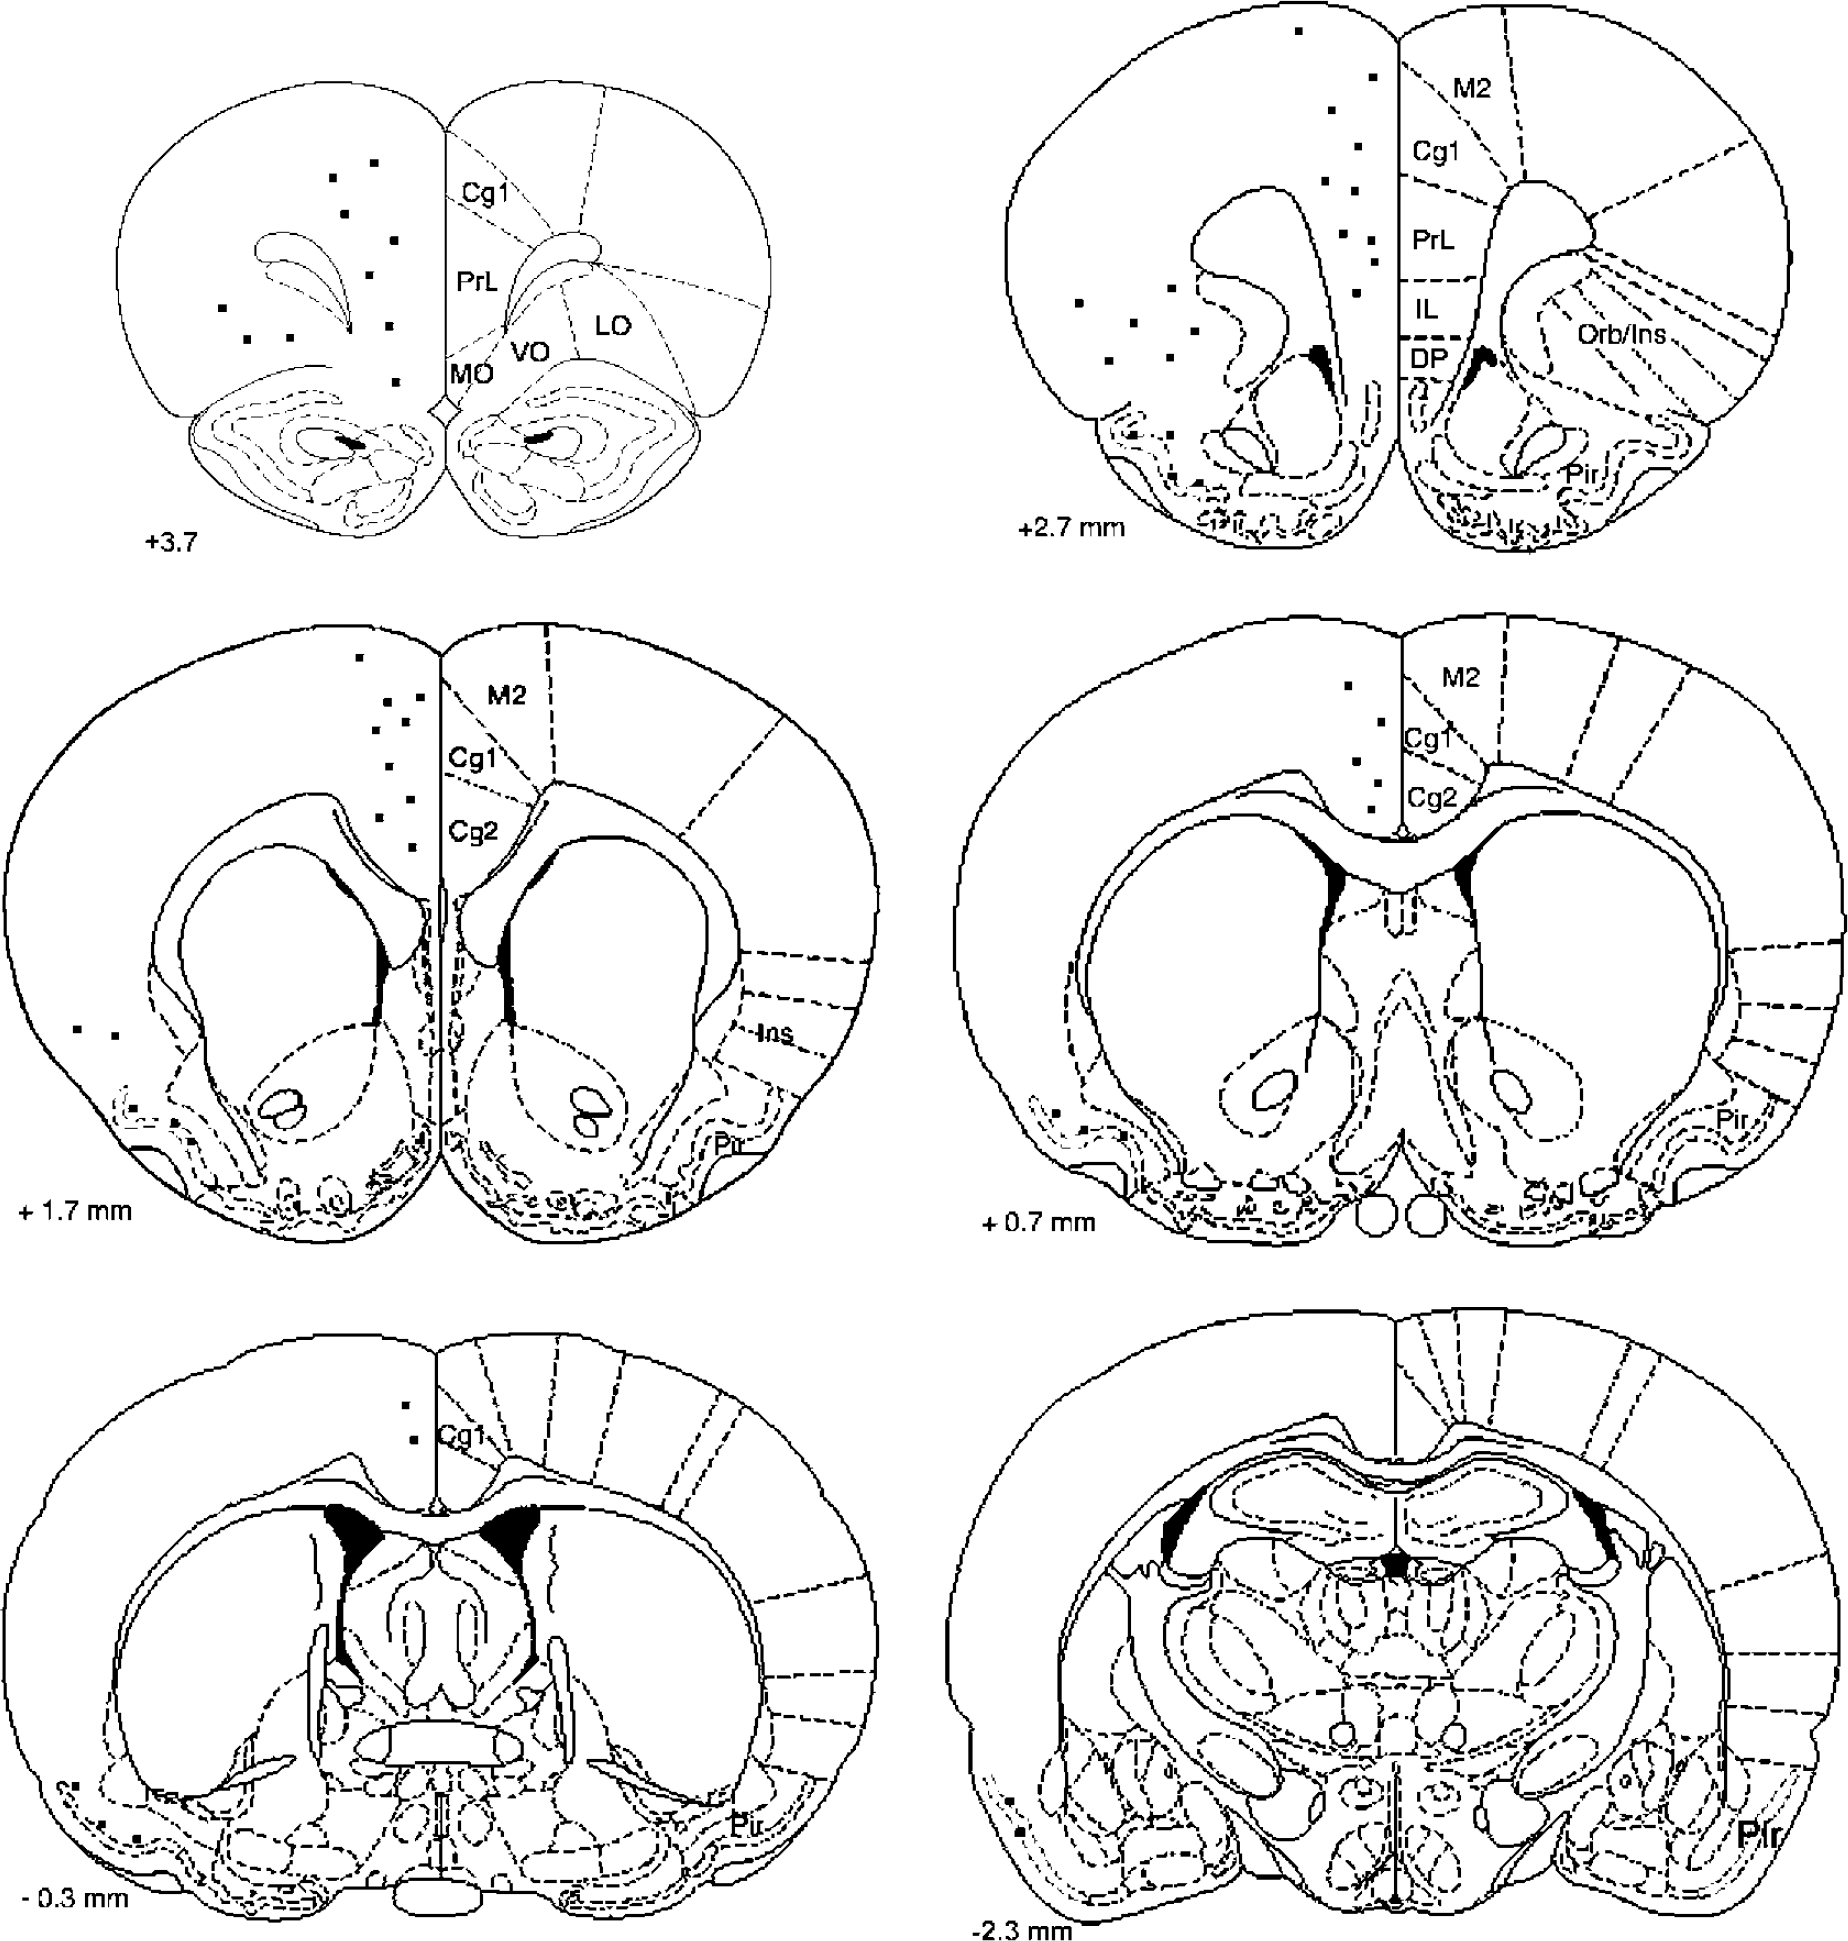
Histographs of fluoro-jade B (FJ) labeling after hypoglycemic insult. The rostro-caudal distribution of average FJ labeling is indicated on line drawings from a rat brain atlas (Paxinos and Watson, 1998). Individual dots represent 3 to 4 FJ + cells appearing at levels + 3.7, + 2.7, + 1.7, + 0.7, −0.3, and −2.3 mm relative to bregma. Cg1, 2, Cingulate area 1,2; DP, dorsal peduncular; IL, infralimbic; LO, lateral orbital; M2, secondary motor; MO, medial orbital; orb/ins, orbital/insular; Pir, piriform; Prl, prelimbic; VO, ventral orbital.
Experiment 2A: time course of Fluoro-Jade B appearance: No FJ + cells were observed in brains Collected 4 h after hypoglycemic insult or in control brains, while FJ + cells were present in all brains collected 8 h or more after hypoglycemic insult. At earlier time points (8 and 12 h) after hypoglycemic insult, FJ + cells appeared neuronal, with well-filled processes (Figure 2E), while after 24 h, FJ + cells appeared shrunken, with short processes. There was no time-dependent trend in numbers of FJ + cells observed in brains collected from 8 h to 10 days after hypoglycemic insult (Figure 4, P = 0.675). The rostrocaudal distribution of staining did not change over time after the insult, and the pattern was similar to that observed in Experiment 1, with the greatest number of FJ cells in rostral sections (Table 2). In this study, the number of FJ + cells/brain averaged 262 ± 266, summed from the 10 sections examined at 1 mm intervals through the forebrain. Linear regression analysis showed a highly significant relationship (r = 0.595; P = 0.0022) between average blood glucose during hypoglycemic insult and the total number of FJ-stained cells at any time point (Figure 5). Of the 26 rats with complete sets of blood glucose data during hypoglycemic insult, two rats had extremely high numbers of FJ cells (902 and 1,149) and these rats were not included in the linear regression analysis.
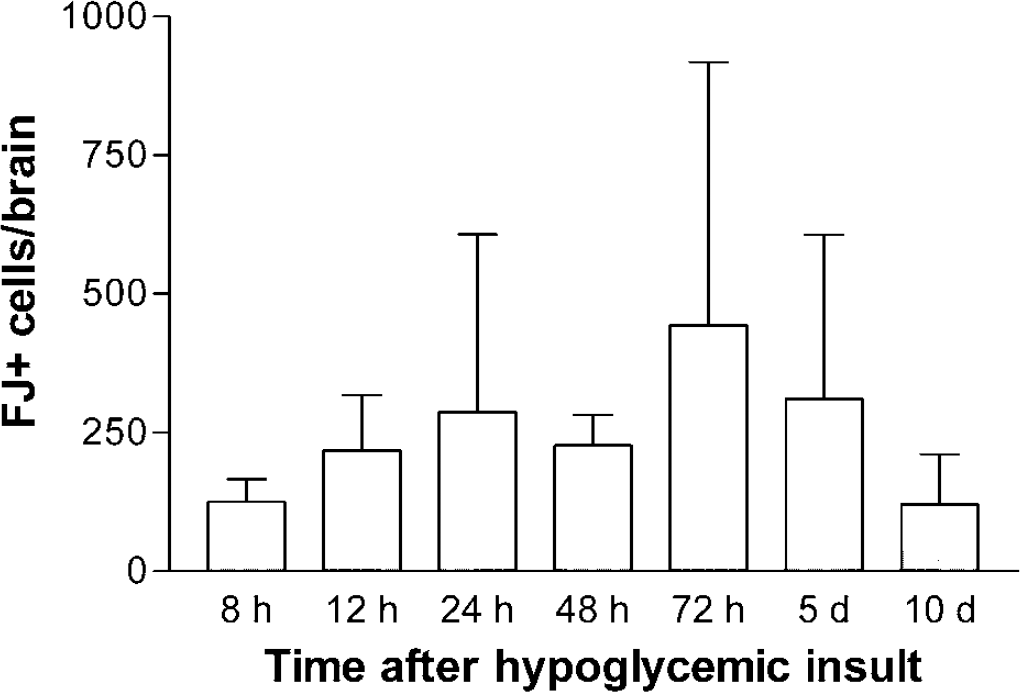
Total numbers of FJ + cells over time after hypoglycemic insult. The time course of FJ appearance was evaluated by counting all FJ + cells on 10 sections representing 1 mm intervals through the rat forebrain, from 4.7 mm rostral to bregma to 4.3 mm caudal to bregma. After hypoglycemic insult, rats were euthanized and perfused at 8 h (n = 3); 12 h (n = 4); 24 h (n = 6); 48 h (n = 3); 72 h (n = 4); 5 days (n = 6); 10 days (n = 4). All hypoglycemic rats were included, whether complete blood glucose records were available during hypoglycemia. The data are displayed as mean ± s.d.
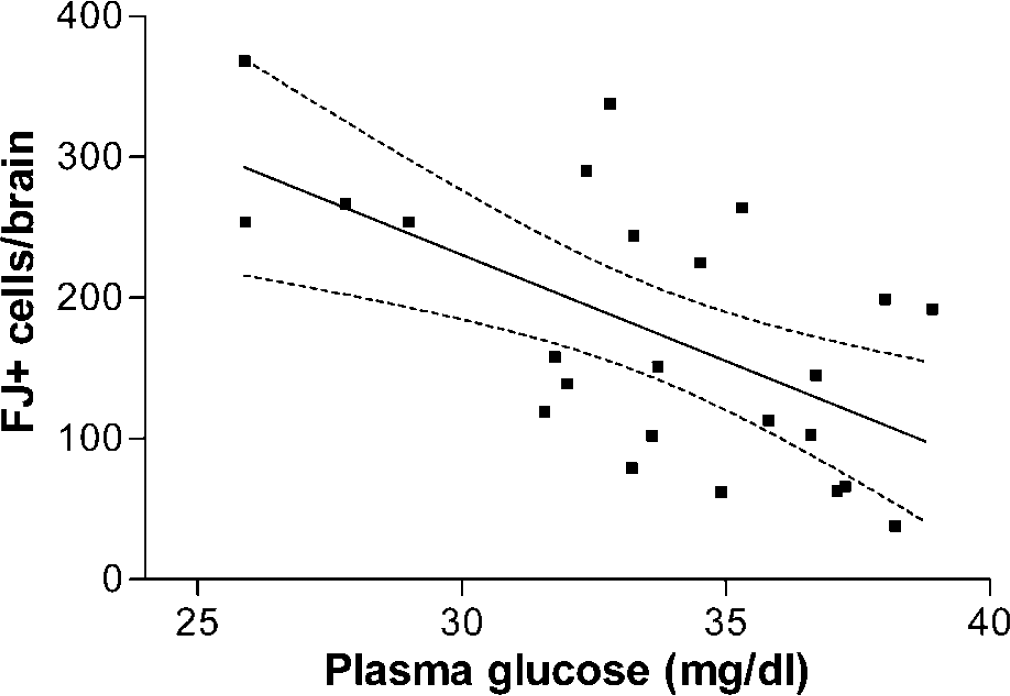
FJ + cell counts are correlated with average plasma glucose during hypoglycemic insult. Linear regression analysis indicates a statistically significant relationship between depth of hypoglycemia and extent of FJ staining with r = 0.595, P = 0.0022. Dashed lines show 95% confidence intervals. This analysis included all rats that had complete blood glucose records during the time of hypoglycemia and excluded two rats that were statistical outliers with total FJ cell counts of 902 cells and 1,149 cells.
Rostrocaudal distribution of FJ + cells in experiment 2A
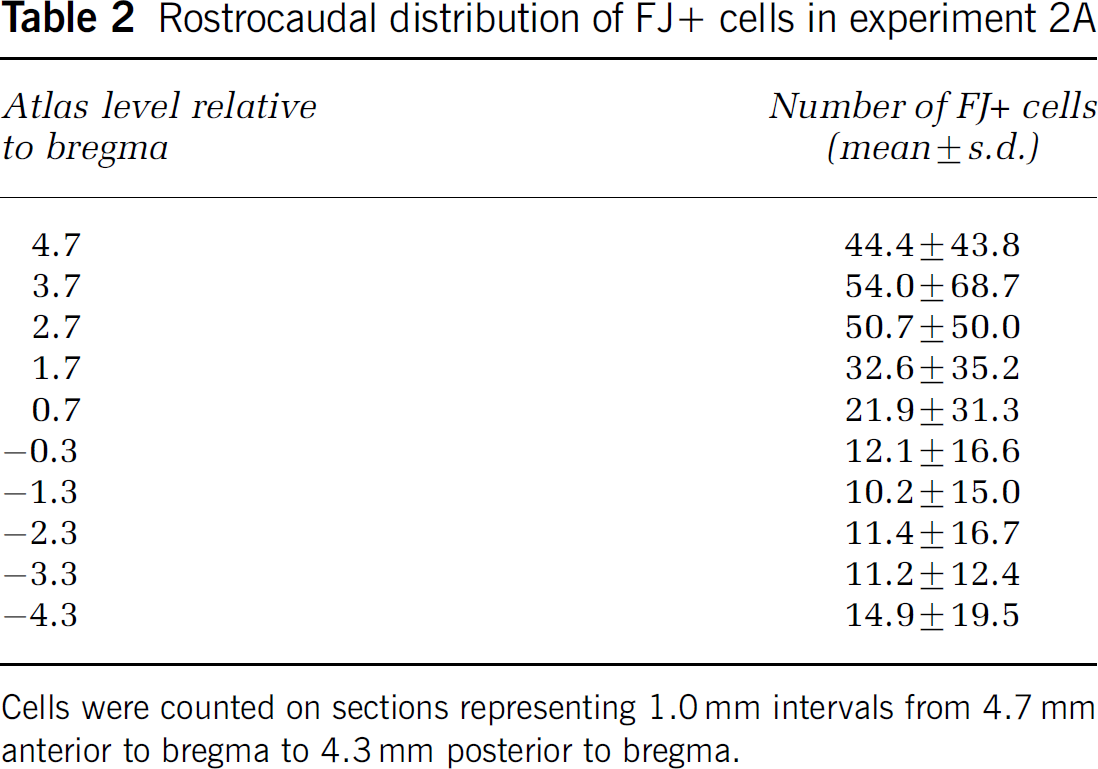
Cells were counted on sections representing 1.0 mm intervals from 4.7 mm anterior to bregma to 4.3 mm posterior to bregma.
Experiment 2B: Fluoro-Jade B staining after two episodes of hypoglycemia: Subjecting rats to two episodes of hypoglycemia, 2 days apart, increased the number of FJ + cells. Compared with brains examined after one hypoglycemic insult, FJ + cells totaled 744 ± 547 cells/brain after two hypoglycemic episodes (n = 4), but the distribution of FJ + cells was the same as described for the single hypoglycemic injury.
The effect of hypoglycemia on other markers of neuronal injury: As opposed to the large number of FJ + cells, only a few cells/brain were immunoreactive for HSP70 at 48 and 72 h after hypoglycemic insult. These cells were only seen in rostro-medial prefrontal cortex and orbital cortex (Figure 2F). At 12, 24, or 48 h after hypoglycemic injury, no neurons appeared to contain immunoreactivity for activated caspase-3 or for the calpain or caspase cleavage products of spectrin. Finally, at 12, 24, or 48 h after hypoglycemia in rats (n = 12 HYPO, 6 CTRL) treated with a similar protocol, there were no cells positive for activated caspase-3 immunoreactivity in sections taken through the hypothalamus where we previously reported TUNEL-positive cells at 48 h (but not 24 h) after hypoglycemia (Tkacs et al, 2000).
As we found in brains collected 48 h after insult, FJ staining did not colocalize with NeuN or GFAP in brains collected at earlier time points (8 or 12 h).
Cardiovascular measurements during hypoglycemia: To evaluate the extent of cardiovascular perturbations during hypoglycemic insult, blood pressure and heart rate were measured in two rats following our usual protocol. Overnight-fasted rats were administered regular human insulin, 4 U/kg (intravenous). Hypoglycemia was maintained between 30 and 35 mg/dL for 90 mins, and the hypoglycemic episode was terminated with 50% dextrose and food. In both rats, hypoglycemia was accompanied by bradycardia with heart rate decreasing from the control level of 318 beats/min to 240 and 260 beats/min during hypoglycemia. Mean arterial pressure was approximately 110 mm Hg in each rat and remained constant in both rats for the duration of the hypoglycemic episode.
Discussion
Reports of rodent HAAF models generally show blunted hormone responses to hypoglycemia occurring within 24 h after recurrent hypoglycemia (2 to 7 episodes of prior hypoglycemia) but not after a single hypoglycemic episode. In our previous study, we observed apparent blunting of hormone responses to repeated hypoglycemia delivered at 48 h intervals; however, our study did not include a control group of pair-fasted rats. In the present study, we compared hormone responses to hypoglycemia between rats with a single episode of moderate hypoglycemia and pair-fasted controls exposed to identical experimental conditions as the hypoglycemic rats. We assessed hormone responses 48 h after the initial insult to allow 1 day for recovery from the initial insult followed by a night of fasting. Despite the fact that we only exposed the rats to one episode of hypoglycemia and we waited 48 h for recovery, we still found significant blunting of epinephrine responses to hypoglycemia after a single episode of moderate hypoglycemia. This rodent model of HAAF is unique in that suppressed epinephrine responses are seen after a single episode of moderate hypoglycemia, rather than multiple episodes used in other models (Evans et al, 2001; Sivitz et al, 2001; Inouye et al, 2002; Flanagan et al, 2003).
In this model, we also aimed to study neuropathologic consequences of a single episode of hypoglycemia using the histologic marker FJ. The data presented here show positive staining with FJ after a single 75 mins episode of moderate, hypoglycemia that did not cause loss of consciousness. Fluoro-Jade B has been used as a marker of neuron death in a variety of brain injury models including ischemia, traumatic brain injury, and excitotoxicity (Sato et al, 2001; Butler et al, 2002). A previous study using FJ to assess brain injury after hypoglycemic coma indicated that FJ labels neurons in the cortex, hippocampus, and subiculum after 30 mins of cerebral isoelectricity (Suh et al, 2003). In agreement with our model, in young rats, recurrent hypoglycemia without loss of consciousness (3 episodes averaging 40 mg/dL) was reported to induce FJ staining in a few neurons in the sagittal and temporal cortex (averaging 17 and 6 neurons/section, respectively) at a mid-hypothalamic level (3 mm posterior to bregma) (Yamada et al, 2004).
The present data are consistent with these findings, but indicate that cells in far rostral cortical regions may be more vulnerable to hypoglycemia than previous reports indicated. Specifically, we found a highly reproducible pattern of FJ staining in the medial prefrontal cortex, including the prelimbic, infralimbic, anterior cingulate regions; the orbital cortex, including the medial, ventral, and lateral orbital regions; and the piriform cortex. The FJ-stained cells appear to be neurons, although the morphology changes significantly from 12 to 48 h after hypoglycemic insult. Early time points show FJ extending well into cell processes, while at later time points the FJ + cells appear smaller than surrounding neurons, with retracted or absent processes. This is consistent with other descriptions of FJ staining after traumatic brain injury or excitotoxicity (Sato et al, 2001; Gilliams-Francis et al, 2003; Singleton and Povlishok, 2004). Since the initial description of FJ as a marker of neuron death, there have been only two reports of FJ staining nonneuronal cells in rat CNS injury models. In one report, glial staining was restricted to the spinal cord, and in the other report, glial FJ staining in the CNS was observed weeks after the injury (Butler et al, 2002; Anderson et al, 2003) Thus, under conditions similar to ours, FJ staining has been used as a valid and reliable marker of neuron death.
The fact that the FJ + cells do not react with antibodies to neuron markers such as NeuN or glutamate receptor subunits may indicate that the FJ-stained cells in this study are not neurons. However, it is possible that NeuN is rapidly cleared during a cell death process, because proteolysis is an early event after injury in neurons (Lee et al, 2003). Although cells undergoing apoptosis may retain some neuronal markers until late stages of the death process, the same has not been shown for neurons dying by necrosis or autophagy. Further work is needed to confirm the neuronal nature of the FJ-stained cells after this moderate hypoglycemic insult.
The mechanism of cell death is not indicated by these results, because FJ, like silver staining, marks cells dying from either apoptosis or necrosis (Sato et al, 2001). We did not detect labeled cells after hypoglycemic insult by using immunohistochemical probes of caspase and calpain pathways. However, these do not represent the only modes of neuron death as cathepsins are also implicated in neuron death, for example, after cerebral ischemia (Seyfried et al, 1997; Hill et al, 1997; Ünal-Çevik et al, 2004). Because the number of dying cells is small in this model, it is not likely that methods for quantifying neuron loss (such as Nissl staining) will detect significant depletion of neurons. The appearance of HSP70 immunoreactivity in the orbital and medial prefrontal cortex neurons after hypoglycemic insult supports the possibility that the FJ staining indicates dying neurons, and points to the relative vulnerability of these brain regions to moderate hypoglycemic insult. However, the lack of FJ staining in the hippocampus at any time point after hypoglycemia indicates that our insult was sub-threshold, relative to the effects of hypoglycemic coma (Suh et al, 2003). The extent of cell death significantly correlated with the depth of hypoglycemia during the insult. Based on the regression equation developed, we would predict that there would be little to no cell death if hypoglycemia is kept higher than 40 mg/dL. In fact, we have not seen FJ staining in rats subjected to hypoglycemia at 45 mg/dL for 2 h (data not shown).
The depth of hypoglycemia during the insult is associated with cardiovascular alterations indicated by moderate bradycardia. This is consistent with other reports showing bradycardia during either acute or chronic severe hypoglycemia in rats (Bryan and Pelligrino, 1988; Bryan et al, 1994). At the level of hypoglycemia (< 2.0 mmol/L) achieved in our model, it is also assumed that there would be an abrupt increase in cerebral blood flow, as shown by other investigators (Bryan et al, 1994; Horinaka et al, 1997; Choi et al, 2001). Using nuclear magnetic resonance spectroscopy to measure brain glucose levels, the cerebral blood flow increase during hypoglycemia occurs at a plasma glucose threshold of 2.0 mmol/L, at which point the brain glucose concentration approaches zero (Choi et al, 2001). However, even at very low brain glucose levels, astrocyte-derived lactate would contribute to maintenance of cerebral function for at least 30 mins (Ransom and Fern, 1997; Pellerin and Magistretti, 2004). Because our rats were responsive to stimulation during the entire hypoglycemic episode, it is likely that some substrate (glucose and/or lactate) was available throughout the 75 mins of hypoglycemia.
In our experiments, FJ + cells are seen reproducibly when moderate/severe hypoglycemia is maintained below 40 mg/dL (2.2 mmol/L) for at least 60 mins. However, the global reduction in energy substrate does not explain the specific vulnerability of neurons in the medial prefrontal, orbital, and piriform cortices observed in this study. One possible explanation for this vulnerability is that these neurons may be activated during hypoglycemia, accelerating their rate of energy depletion. A recent positron emission tomography (PET) study indicates that, in humans studied during hypoglycemia, portions of the medial prefrontal and orbital cortex were activated, while the remaining cerebrum, brainstem, and cerebellum showed decreased activity (Teves et al, 2004). Hypoglycemic activation of homologous cortical regions in rats could predispose neurons to rapid energy depletion and neuron death.
Surprisingly, we did not observe FJ staining in the arcuate nucleus of the hypothalamus, where we previously identified TUNEL staining and altered gene expression after hypoglycemic insult (Tkacs et al, 2000). The reversibility of hypoglycemic DNA damage in neurons has been shown in vitro, as striatal neurons exposed to aglycemia for 24, 48, or 72 h show increased TUNEL staining that reverses when the neurons are returned to glucose-containing culture medium (McDermott et al, 2003). In fact, even though we previously showed evidence for hypoglycemia-induced TUNEL staining in the hypothalamic arcuate nucleus cells (Tkacs et al, 2000), neither FJ + nor activated caspase-3-positive cells were found in the arcuate. This suggests that some minor DNA fragmentation may occur but this does not necessarily lead to cell death in the hypothalamus.
Future neuropathologic studies of noncoma hypoglycemia are needed to identify the phenotype of the cells positive for FJ and other injury markers. In addition, the location of these vulnerable cells may be significant to the well-described deficits in hypoglycemia responses of diabetic patients. Patients with recurrent hypoglycemia have blunted or absent warning signs of hypoglycemia, that is, they suffer from hypoglycemia unawareness (Gerich et al, 1991). Given the human PET data showing medial prefrontal and orbital cortex activation during hypoglycemia, it is possible that these brain regions participate in hypoglycemia awareness, the conscious perception of the symptoms engendered by autonomic activation (including palpitations, hunger, sweating, tingling) (Teves et al, 2004). Alternatively, functional imaging in humans and neuroanatomic tracing studies in rats have consistently suggested a role of medial prefrontal cortex in visceral sensation and regulation (Terreberry and Neafsey, 1983; Jansen et al, 1997; Ter Horst and Postema, 1997; King et al, 1999; Buijs et al, 2001; Westerhaus and Loewy, 2001; Owens and Verberne, 2001; Floyd et al, 2001; Cameron and Minoshima, 2002). Thus, the loss of neurons in the medial prefrontal and orbital cortex may be one element contributing to reduced compensatory adrenomedullary responses to hypoglycemia in our model.
Many, if not most, children and adults with type 1 diabetes mellitus sustain single or multiple episodes of hypoglycemia at the level we use to induce hypoglycemic insult in this rodent study. The preponderance of the evidence from studies of diabetic patients who experience repeated moderate hypoglycemia shows sustained preservation of cognitive function and gross brain integrity. This implies that neuroprotective mechanisms, such as the presence of the ATP-sensitive potassium channel, prevent large-scale neuron death during hypoglycemia (Mobbs et al, 2001). However, recurrent hypoglycemia can result in long-term reductions in hypoglycemia awareness and compensatory autonomic responses that are not always fully reversible with avoidance of hypoglycemia (Mitrakou et al, 1993). Our results using a sensitive marker of cell death show that there are vulnerable cells, which may be neurons, in the medial prefrontal, orbital, and piriform cortex, that die after a single episode of moderate hypoglycemia. It remains to be determined whether persistent deficits such as hypoglycemia awareness and counterregulatory responses result, in part, from a selective vulnerability of these brain regions to hypoglycemic injury.
Footnotes
Acknowledgements
The authors gratefully acknowledge the expert technical assistance of Antoinette Moralishvili. The authors thank Jason Davis for advice on Fluoro-Jade B staining, Dr Hilaire Thompson for dedicated assistance with photomicrographs, and Dr Tracy McIntosh for helpful discussions related to models of neuron death. The authors thank Dr Robert Siman for the generous gift of the antibodies to calpain- and caspase-cleaved spectrin. The radioimmunoassays were performed in the core facility of the University of Pennsylvania Diabetes Endocrinology Research Center (DK19525).