
Abstract
Peri-infarct depolarisations (PIDs) contribute to infarct expansion in experimental focal ischaemia; furthermore, depolarisations propagate in the injured human brain. Glucose utilisation is increased under both conditions, and depletion of brain glucose carries a poor prognosis. We studied dynamics of cerebral glucose and lactate in relation to PID patterns in experimental stroke. The middle cerebral artery was occluded for 3 h in 23 cats under terminal chloralose anaesthesia. We used fluorescence imaging to detect occurrence of PIDs, and rapid-sampling online microdialysis (rsMD), coupled to a flow-injection assay, to examine changes in cerebral cortical extracellular glucose and lactate at intervals of 30 sec each. After 30 min' ischaemia, lactate had increased by 43.6±s.d. 45.9 μmol/L, and stabilised in that range for 3 h. In contrast, glucose fell only slightly initially (11.9±9.7 μmol/L), but progressively decreased to a reduction of 56.7±47.2 μmol/L at 3 h, with no evidence of stabilisation. There was a highly significant inverse relationship of frequency of PIDs with plasma glucose (P<0.001). The results also characterise a metabolic signature for PIDs for possible application in clinical work, and emphasise potential risks in the use of insulin to control plasma glucose in patients with brain injury.
Introduction
The cortical ischaemic territory that results from experimental middle cerebral artery occlusion (MCAO) encompasses a densely ischaemic central core and a less densely ischaemic penumbral zone (Astrup et al, 1981; Siesjo, 1992). Recurrent, spontaneous depolarisations occur and propagate in the penumbra in a number of species including non-human primates (Branston et al, 1977; Strong et al, 2000), cat (Strong et al, 1983; Saito et al, 1995), and the rat (Nedergaard and Astrup, 1986; Gill et al, 1992; Iijima et al, 1992). These events—peri-infarct depolarisations (PIDs)—appear to arise principally at the edge of the core area and spread into the peri-infarct zone (Strong et al, 1996). A role for PIDs as a cause rather than simply as a marker of the progression of infarct growth has been indicated by the positive correlation between number of PID events and infarct size (Gill et al, 1992; Chen et al, 1993; Mies et al, 1993) and, critically, by the demonstration that induction of depolarisations within or adjacent to the penumbra can enlarge the infarct (Back et al, 1996; Busch et al, 1996; Takano et al, 1996).
There is increasing evidence to suggest that frequency of PIDs, while influencing infarct size, is also itself influenced by the plasma glucose concentration during experimental focal cerebral ischaemia. Nedergaard and Astrup (1986) reported a higher PID rate in the penumbra after MCAO in rats at normoglycaemia (9.3 mmol/L) compared with hyperglycaemic (32.5 mmol/L) animals. They also reported a high cerebral glucose utilisation rate in this territory, and inferred that the cortical free glucose pool would be highly labile, and perhaps totally depleted under these conditions. In support of these findings, a study of the frequency of spontaneous PIDs after MCAO in the cat found serendipitously that this increased at mean postocclusion plasma glucose levels of less than some 4.5 mmol/L (Strong et al, 2000). The apparent dependence of PID frequency on plasma glucose was interpreted (on the assumptions that anaerobic glycolysis had become established in the penumbra and that the astrocytic glycogen pool had been exhausted) as indicating that maintenance of ion/excitatory-neurotransmitter homostasis becomes critically dependent on glucose availability from residual perfusion. This would likely be reflected in a greater incidence of spontaneous depolarisations. Lability of the cortical glucose pool would thus be a cause as well as a consequence of increased PID frequency—thus forming a potential vicious circle. The issue of a possible dependence of PID frequency on plasma glucose concentration has taken on new importance for clinical management of acute brain injury, since there is widespread support in general intensive care units for a policy of tight control of plasma glucose with insulin (Van den Berghe et al, 2001). Furthermore, studies of microdialysate glucose concentration in patients with acute brain injury have indicated that depletion of the brain glucose pool carries a poor prognosis (Langemann et al, 1995; Vespa et al, 2003), and there is now good evidence for the occurrence of depolarisation events in the injured brain in many patients (Mayevsky et al, 1996; Strong et al, 2002).
In the present study, we therefore sought to assess the degree of variability in the cortical extracellular glucose pool in the ischaemic penumbra, and to examine, prospectively and specifically, the relationship between PID rate and postocclusion plasma glucose concentration. We used an open-skull preparation, and recorded changes in extracellular glucose and lactate using rapid-sampling (30-sec) microdialysis coupled to a dual enzyme-based flow-injection assay system (Jones et al, 2000, 2002). Individual PIDs were detected by monitoring for transient changes in 450 nm cortical fluorescence, with particular reference to the area of cortex adjacent to the microdialysis probe (Strong et al, 1996). In the accompanying paper (Parkin et al, 2005), we describe initial results of the application of rapid sampling microdialysis, combined for the first time with electrophysiological monitoring to detect PID-like events, in patients with acute brain injury.
The data we report in this paper suggest a progressive downward trend in dialysate glucose in the first 3 h of ischaemia, offer robust confirmation of the dependence of PID frequency on plasma glucose level during focal cerebral ischaemia, and show a typical ‘metabolic signature’ of a PID, characterised by a transient reduction in dialysate glucose and an increase in lactate. Some of the data have previously been reported in abstract form (Hopwood et al, 2003).
Materials and methods
Animal Preparation
All procedures were specifically licensed under the Animals (Scientific Procedures) Act 1996. Adult cats of either sex in the weight range 2.8 to 5.95 kg were anaesthetized with halothane (4%, then 2%, in a mixture of 70% N2O and 30% O2) for induction and initial surgery. The right femoral vein was cannulated for fluid administration, and the right femoral artery cannulated for continuous monitoring of arterial blood pressure and serial measurements (every 30 mins) of arterial blood glucose concentration, PaO2, PaCO2, [HCO3−], and pH. Arterial blood samples were analysed immediately using a GEM Premier 3000 analyzer (Instrumentation Laboratory, UK), and blood glucose was measured electrochemically with Exactech strips (Medisense, UK). Rectal temperature was monitored and maintained at 37°C with a heating blanket. The animal was intubated and ventilated mechanically, with pancuronium (slow bolus of 0.06 mg/kg, and 0.06 mg/kg h maintenance) for neuromuscular blockade. Anaesthesia was maintained with α-chloralose (bolus: 60 mg/kg), and was repeated (occasionally supplemented with a brief increase in halothane from 0.5% to 1% or 1.5%) if indicated by tachycardia. Intravenous infusion of saline was maintained at a rate of 4.5 mL/kg h.
Target ranges for the maintenance of arterial blood gases were pO2 100 to 120 mm Hg, pCO2 27 to 33 mm Hg, and pH 7.34 to 7.43, maintained by adjustments of inspired N2O:O2 ratio, ventilation rate or tidal volume, and bolus infusions of 3 mL 8.3% sodium bicarbonate, respectively. Target range for arterial blood pressure was 60 to 100 mm Hg; lower values often responded to bicarbonate but were also treated with additional 5 to 10 mL bolus doses of Gelofusine (Braun, Melsungen, Germany); higher values were treated by an increase in halothane % or additional chloralose bolus.
The main trunk of the right middle cerebral artery (MCA) was exposed transorbitally for occlusion later using a miniature Scoville clip (O'Brien and Waltz, 1971). A craniotomy (2.5 cm anteroposterior by 1.5 cm lateral) was performed over the outer MCA vascular territory and the dura mater removed to expose the marginal and suprasylvian gyri (MG, SG) and the outer part of the ectosylvian gyrus (EG). A pool was established, and a microdialysis probe (MAB 06: Metal Handlung, Sweden: 2 mm membrane length) was implanted in the superficial MG (penumbral region) and perfused with artificial CSF (147 mmol/L NaCl, 2.7 mmol/L KCl, 1.2 mmol/L CaCl2, 0.85 MgCl2) with a microinjection pump (CMA/100: CMA Microdialysis, Sweden) at a rate of 2.5 μL/min−1. After probe placement, the pool was filled with warm mineral oil, and the temperature monitored and maintained at 37°C±0.5°C using a miniature water coil in the base of the pool. After the lighting had been arranged and the video camera positioned, basal imaging and microdialysis measurements were made for at least 30 mins and the MCA then occluded for 3 h. All experiments were terminated by perfusion-fixation.
Imaging of Cortical Perfusion with Umbelliferone
Before the orbital dissection, the right lingual artery was cannulated for intermittent 0.75 ml bolus injections of the fluorescence indicator umbelliferone (0.125% solution, filtered). This was used after MCAO (by direct visual inspection) to verify loss of perfusion in the MCA territory, and to confirm that residual delivery of the indicator was from the direction of the anterior cerebral artery.
Plasma Glucose
Because depletion of the astrocyte glycogen pool before ischaemia might potentially sensitise the cortex to subsequent reductions in plasma glucose after MCAO, plasma glucose was monitored at intervals of 30 min before MCAO. Intermittent intravenous bolus volumes, typically 2 mL of 20% dextrose, were given (femoral cannula) if plasma glucose fell below 4.5 mmol/L. After MCAO, animals were assigned for either high-medium (>5.5 mmol/L) or low-medium (3 to 5.49 mmol/L) target plasma glucose management, according to which of these bands the initial postocclusion plasma glucose fell into. Elevation of plasma glucose was achieved where required with bolus doses of 20% glucose as in the preocclusion phase. Plasma glucose was lowered by a combined infusion of insulin and glucose. Guideline insulin (soluble) dosage was 4.5 mU/kg min for 3 min then 3.0 mU/kg min for 4 mins, and finally maintained with 1.5 mU/kg min. Glucose (10%) was infused typically at 2.0 mg/kg min for 3 min, then at 2.5 mg/kg min for 4 min, then 3.0 mg/kg min for 5 min, and finally at 4.0 mg/kg min (maintenance). Plasma glucose was monitored during the beginning phase at 5-min intervals and the infusion rate of glucose adjusted accordingly.
On-Line Dual Glucose and Lactate Assay
The dialysate was analysed for glucose and lactate using a dual on-line assay developed in this laboratory (Jones et al, 2002), which is based on ferrocene-mediated detection enzyme bed technology. The assay set-up is shown schematically in Figure 1. Low volume microdialysis tubing (dead volume 1.2 μL/10 cm length) connected the probe outlet to a needle placed in the injection port of a multiport electrically actuated valve (Valco Instruments Inc., Switzerland). A ferrocene buffer (pH 7.0) was continuously pumped into the valve at the rate of 0.6 mL/min using a HPLC pump (Flux Instruments, Switzerland). The injection valve was programmed to switch at 30 secs or (more recently) 15 secs intervals throughout, splitting the dialysate between two parallel assays for sequential amperometric detection of glucose and lactate every 60 or 30 secs. Each assay consisted of an enzyme bed reactor (containing either glucose oxidase and horseradish peroxidase or lactate oxidase and horseradish peroxidase; all obtained from Genzyme, UK) and a downstream radial flow electrode (BAS Inc., USA) held at −100 mV relative to an Ag/Ag/Cl reference electrode.
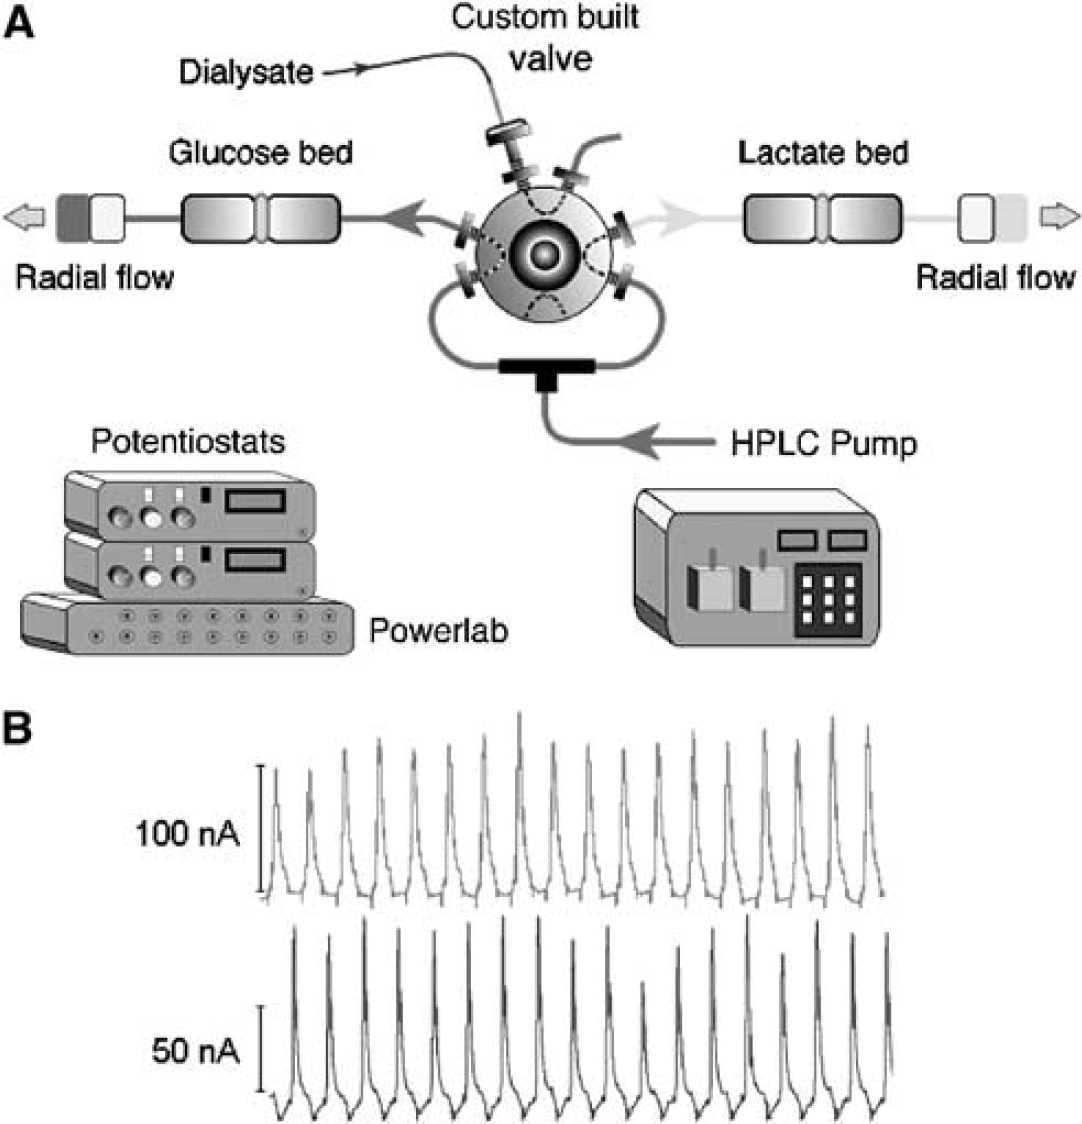
Schematic diagram of the on-line microdialysis assay showing sequential detection of glucose and lactate present in the dialysate. The pair of internal loops in the (2-position) valve ensures delivery of a fresh sample to the appropriate enzyme bed when the valve changes. Inset shows an example of the glucose and lactate peaks recorded from the assay system.
Data were collected using a Powerlab 16/SP A/D converter (ADInstruments, Australia) controlled via a portable computer (Apple G4 Powerbook) with Chart software (ADInstruments). Both pre- and post-experimental calibrations of the system for glucose and lactate were performed by manual injection of a series of standards (50 to 2000 μmol/L) into the injection port of the valve. Calibration curves were fitted to the Hill equation using MacCurveFit (Kevin Raner Software, Australia).
Cortical Fluorescence Imaging
The cortex was illuminated at 370 nm and sequences of raw grey level 450 nm fluorescence images digitised at 12 secs intervals. Details of the experimental system have been described previously (Strong et al, 1996). Briefly, it comprises (1) fluorescence excitation (75-W xenon source) at 370 nm delivered via 2 liquid light guides and oblique epi-illumination; (2) intensified charge-coupled device camera (Prostab, UK); and (3) a frame-grabbing system (Synoptics Ltd, UK) within a personal computer host, which was programmed with appropriate image-acquisition sequences. Sequences of up to 300 images were acquired before and during the 3 h after MCAO. A fresh baseline image was used for each sequence to facilitate detection of changes in fluorescence over the duration of the sequence. On termination of a sequence, a new sequence was initiated, usually immediately, but sometimes after intervals of approximately 4 to 5 mins, such that sampling was essentially continuous for the great majority of the post-MCAO period.
Image sequences were rendered in rainbow pseudocolour as differences from the initial image in the sequence, both for detection of PIDs and for exclusion of artifacts (Impresso: Foster Findlay Associates, Newcastle-Upon-Tyne, UK). Fluorescence transients taken to mark a PID were defined as a rapid increase in raw cortical 450 nm fluorescence that propagated across the cortical surface at a rate of 1 to 5 mm/min. In cases where PID(s) propagated to the region of the microdialysis probe, a small ‘region of interest’ (ROI) contour was drawn proximal to probe and the time course of fluorescence in this ROI reviewed: the time at which the fluorescence level began to increase sharply was taken as the time of onset of the PID at the probe (Figure 2). In a few instances, a decrease in fluorescence was observed on the medial MG, and was interpreted as indicating propagation of a depolarisation that had elicited a response more characteristic of the hyperaemic response to cortical spreading depression (CSD) than of the PID response (Strong et al, 1996). However, before such observations only occurred in conjunction with a more typical PID response a little nearer the MCA input; the number of PIDs recorded was not affected.
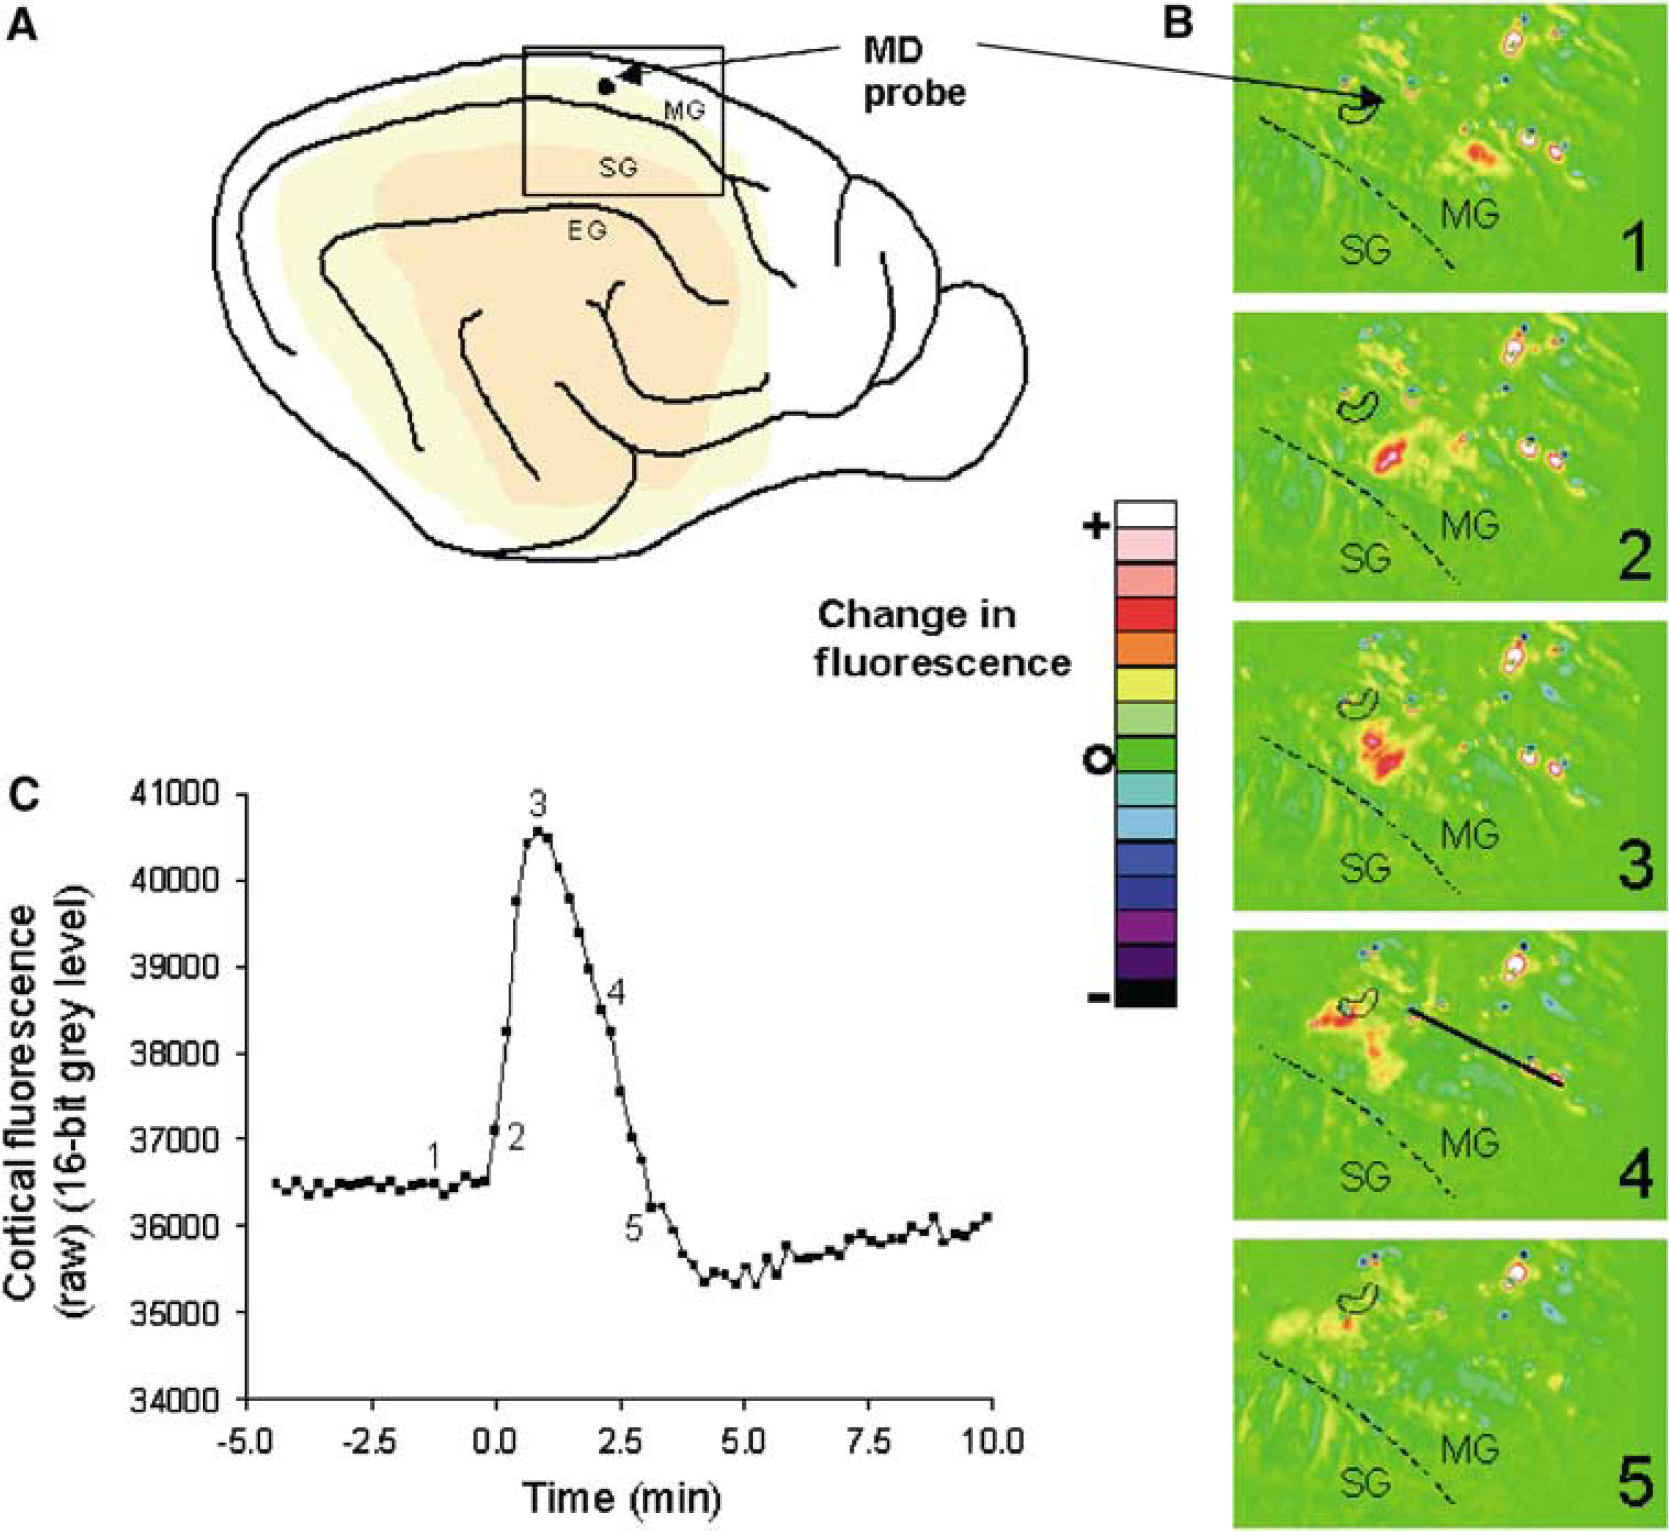
Diagrammatic illustration of the propagation of a transient increase in cortical fluorescence posteriorly along the marginal gyrus, and involving cortex in the region of the microdialysis probe. (
Data Analysis and Statistics
All dialysate glucose and lactate values (μmol/L) are expressed as mean±standard deviation. Basal glucose or lactate levels were defined as the mean of samples collected over a 10-min period immediately before MCAO. Pre-PID analyte levels were defined as the mean of values over 90 secs (for 30 secs dialysate sampling) or 2 mins (60 secs sampling) before the time of arrival of a PID at the microdialysis probe site. Significance of changes in dialysate glucose and lactate from preocclusion (Figure 4) or from pretransient (Figure 5) values was tested using paired t-tests after confirming Gaussian distribution of the data. Linear regression analysis was used to test for a relationship between number of PID events post-clip and mean post-occlusion plasma glucose. Statistical testing was performed using Prism software (GraphPad Inc, San Diego, USA).
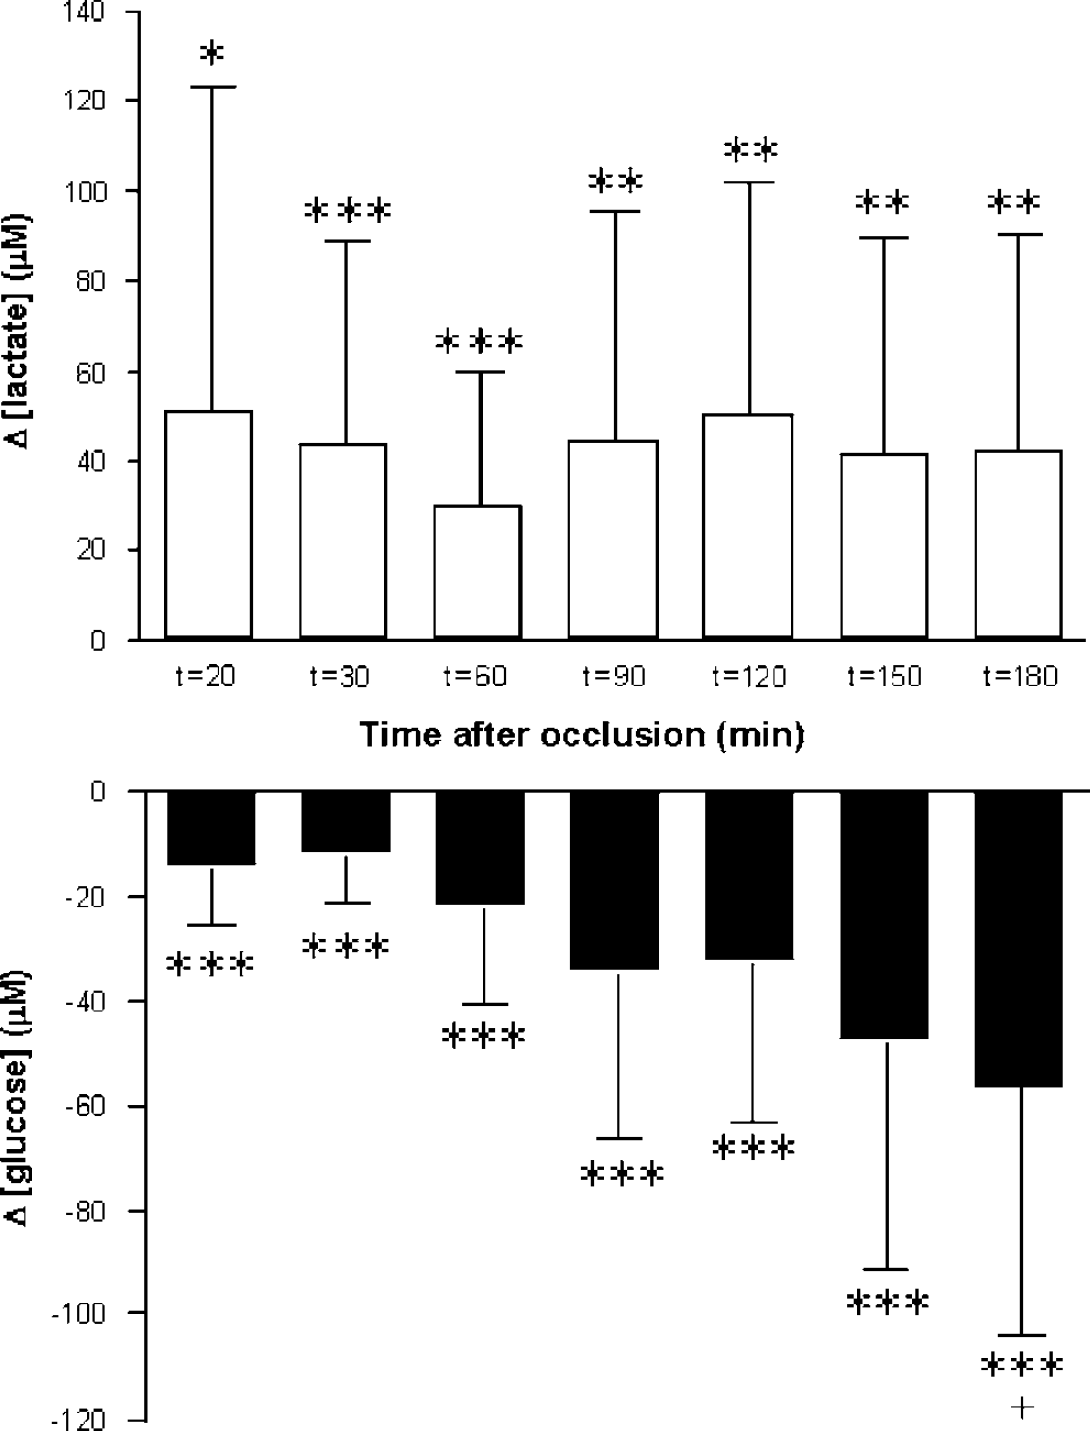
The effect of middle cerebral artery occlusion (MCAO) on cortical dialysate glucose and lactate levels. Data shown are 3-min averages, expressed as mean changes (at t=20 to 180 mins after MCAO) from preocclusion levels (n=10 to 15). Error bars are 1.0 s.d. Data are Gaussian: a paired t-test for significance of difference values from zero was used. *P<0.05; **P<0.03; ***P<0.01. A downward trend in glucose concentration is maintained at 3 h (+: 180 versus 20 mins, t (paired)=3.075, P=0.0133), whereas lactate appears more stable.
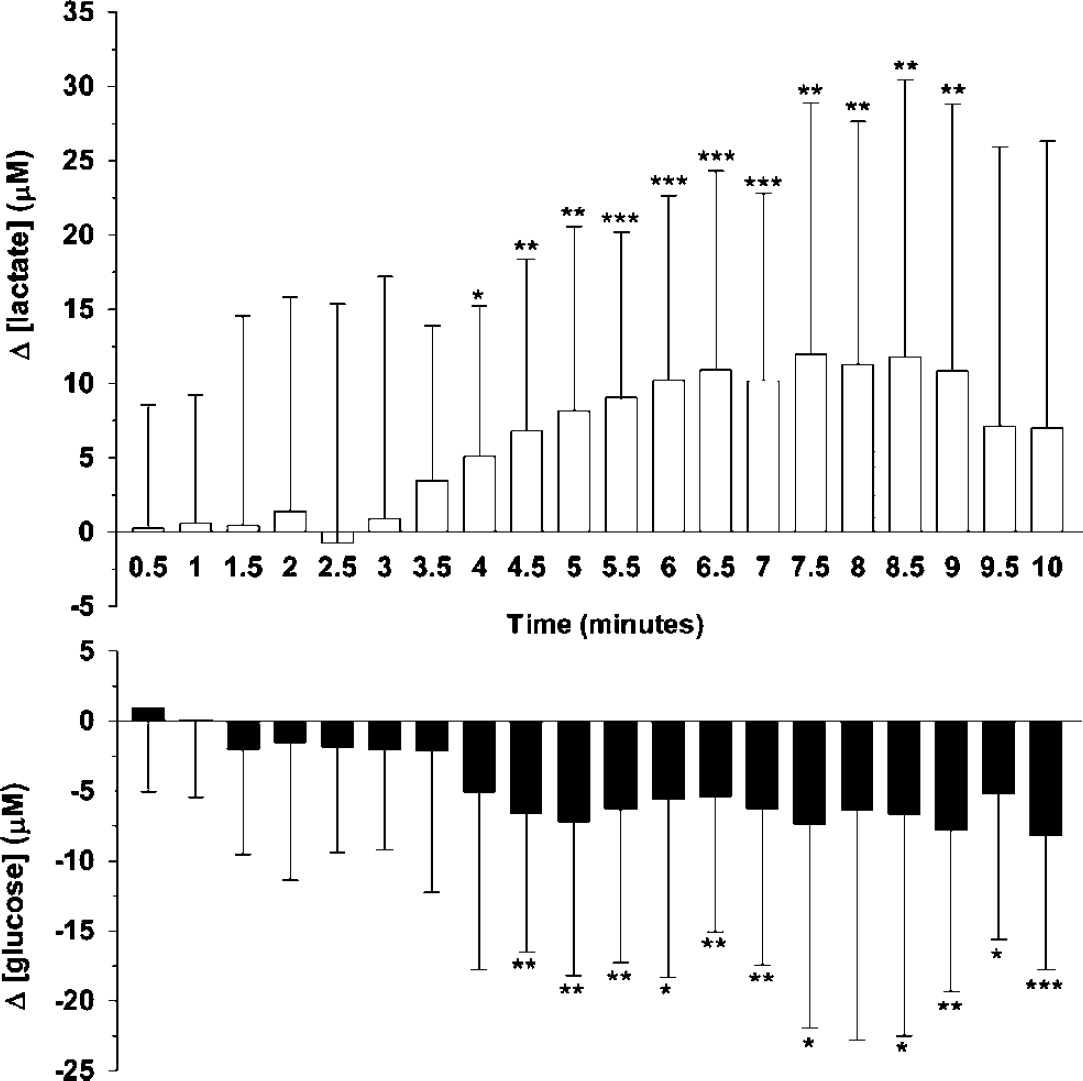
Average time course of dialysate glucose and lactate levels during a peri-infarct depolarisation (PID). Changes in glucose or lactate (μmol/L) were calculated relative to a pre-PID baseline (90 secs) period. Error bars are 1 s.d. For statistical evaluation, values obtained over a 10 mins period after the onset of a PID (at the microdialysis probe site) were grouped into 30 secs data ‘bins’ (1 to 20). *P<0.05; **P<0.01; ***P<0.001.
Results
Overall, 23 experiments were performed. Fluorescence imaging data were available for 19 animals, and glucose and/or lactate were monitored with the on-line microdialysis assay in 18 experiments. Both fluorescence imaging and microdialysis data were available for 14 animals. Basic physiological data are shown in Table 1.
Physiological variables
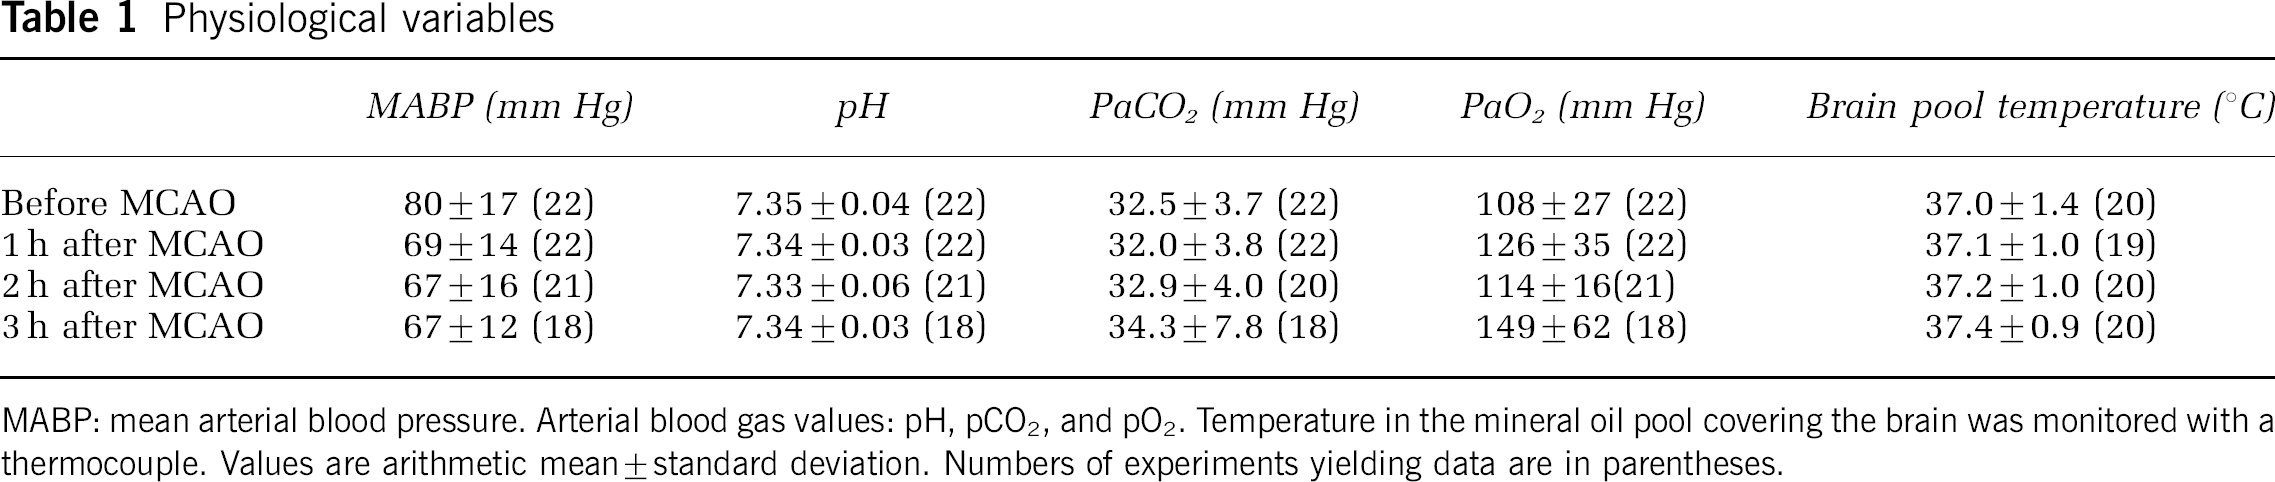
MABP: mean arterial blood pressure. Arterial blood gas values: pH, pCO2, and pO2. Temperature in the mineral oil pool covering the brain was monitored with a thermocouple. Values are arithmetic mean±standard deviation. Numbers of experiments yielding data are in parentheses.
Fluorescence Transients
No fluorescence transients indicative of CSD (spreading decrease in fluorescence) or of a PID (spreading increase in fluorescence) were observed during the recording period preceding MCAO in any of the experiments (n=19). After MCAO, PIDs were observed in 16 animals.
Figure 2 illustrates the progression of a transient increase in fluorescence, interpreted as propagation of a PID, along the MG. The fluorescence time series (Figure 2C) was recorded from an ROI immediately beside the microdialysis probe (Figures 2A, 2B). As in previous experiments (Strong et al, 1996), a sustained increase in fluorescence suggestive of ‘terminal’ ischaemic depolarisation sometimes occurred on the SG soon after MCAO, but on other occasions this was delayed for approximately 1 h. Such events on the SG often propagated into the MG as increases in fluorescence, but usually resolved there within some 2 mins, thus behaving on the MG as PIDs. During the remainder of the MCAO period, if there were four or more transient fluorescence increases seen in a given experiment, these showed a clear trend to originate on a single gyrus—SG or MG. Thus, in eight experiments, transients originated mainly on the MG, and in four, on the SG. In one experiment, most events originated on the SG early in the experiment (some two thirds of these propagating onto the MG), but later arose on the MG—suggesting an enlarging infarct, compatible with the concept of ‘penumbral recruitment’. In one experiment, several events appeared to originate from the lateral (marginal) sulcus, and there were occasional instances of events propagating proximally for a short distance towards the MCA input. Where events began on the MG, the origin was more often laterally (nearer to the middle than to the anterior cerebral artery input).
Plasma Glucose and Incidence of Fluorescence Transients
During the early phase of surgical preparation, there was, in most experiments, a tendency to hyperglycaemia, which settled before MCAO (6.7±2.3 mmol/L). Overall, mean post-MCAO plasma glucose was 5.9±1.4 mmol/L; the range of mean postocclusion values in individual experiments is indicated in Figure 3.
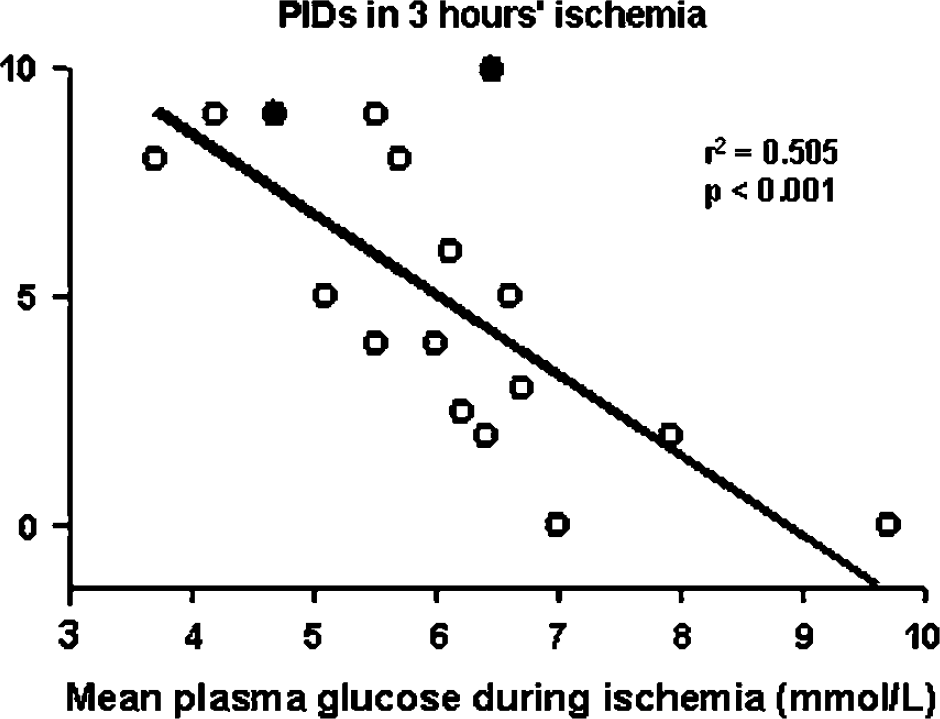
Total numbers of peri-infarct depolarisation (PIDs) in 3 h compared with mean postocclusion plasma glucose level (n=17). Linear regression analysis revealed a significant inverse relationship between the two variables (r2=0.505; P<0.001). In two experiments (•), insulin was used to reduce plasma glucose.
The number of transient fluorescence increases was compared with post-MCAO plasma glucose averaged over the entire period of occlusion. Results of linear regression analysis were compatible with an inverse linear dependence of frequency of transients on plasma glucose (Events-in-3-h=−1.76(mean plasma glucose during ischaemia)+15.6, r2=0.505, P<0.001) (Figure 3). The value of mean postocclusion plasma glucose corresponding to a null-incidence of PIDs (x-intercept) was 8.86 mmol/L. Glucose-insulin infusions were used to lower post-MCAO plasma glucose in two experiments; the relevant data points are separately identified in Figure 3, and give no appearance of deviating significantly from the relationship of PID frequency with spontaneous reduction in plasma glucose.
Effect of Middle Cerebral Artery Occlusion on Cortical Dialysate Glucose and Lactate
Basal levels of cortical dialysate glucose and lactate in the MG were 148±153 and 85±85 μmol/L (s.d.: n=15 to 18 animals), respectively. Figure 4 shows the effect of MCAO on mean cortical glucose and lactate levels (as changes from preclip values) at a sequence of time-points over the 3-h recording period. Middle cerebral artery occlusion caused an increase in cortical lactate within the first 20 mins and levels remained elevated thereafter. In contrast, glucose showed a time-dependent decrease after MCAO (paired t-test, 180 versus 20 mins: t=3.075, P=0.0133, n=10).
Effect of Peri-Infarct Depolarisations on Cortical Glucose and Lactate
Of the 14 experiments with both fluorescence and microdialysis monitoring, PID transients were observed in 8 preparations: a total of 41 PIDs occurred, 27 of which propagated to the region of the probe. The effects of all 27 PIDs on dialysate glucose and lactate levels are shown (averaged) in Figure 5. Typically, PID events propagating near the probe resulted in a transient increase in tissue lactate (approximately+15 μmol/L from pre-PID levels) that was coupled with a smaller decrease in glucose (−5 to −10 μmol/L). Occasionally, a succession of PIDs would propagate to the probe, resulting in a much higher overall increase in lactate at 3 h post-clip.
Figure 6 shows data from one such experiment where the mean PID peak lactate change from the pre-PID value was +22.3±7.7 μmol/L and the mean glucose change was −7.7±1.5 μmol/L (n=7 PIDs, mean±s.d.s). Data for the fourth PID in this experiment form the sequence of fluorescence changes (as colour-rendered change from baseline) shown in Figure 2B, and the time course of fluorescence around the microdialysis probe shown in Figure 2C.
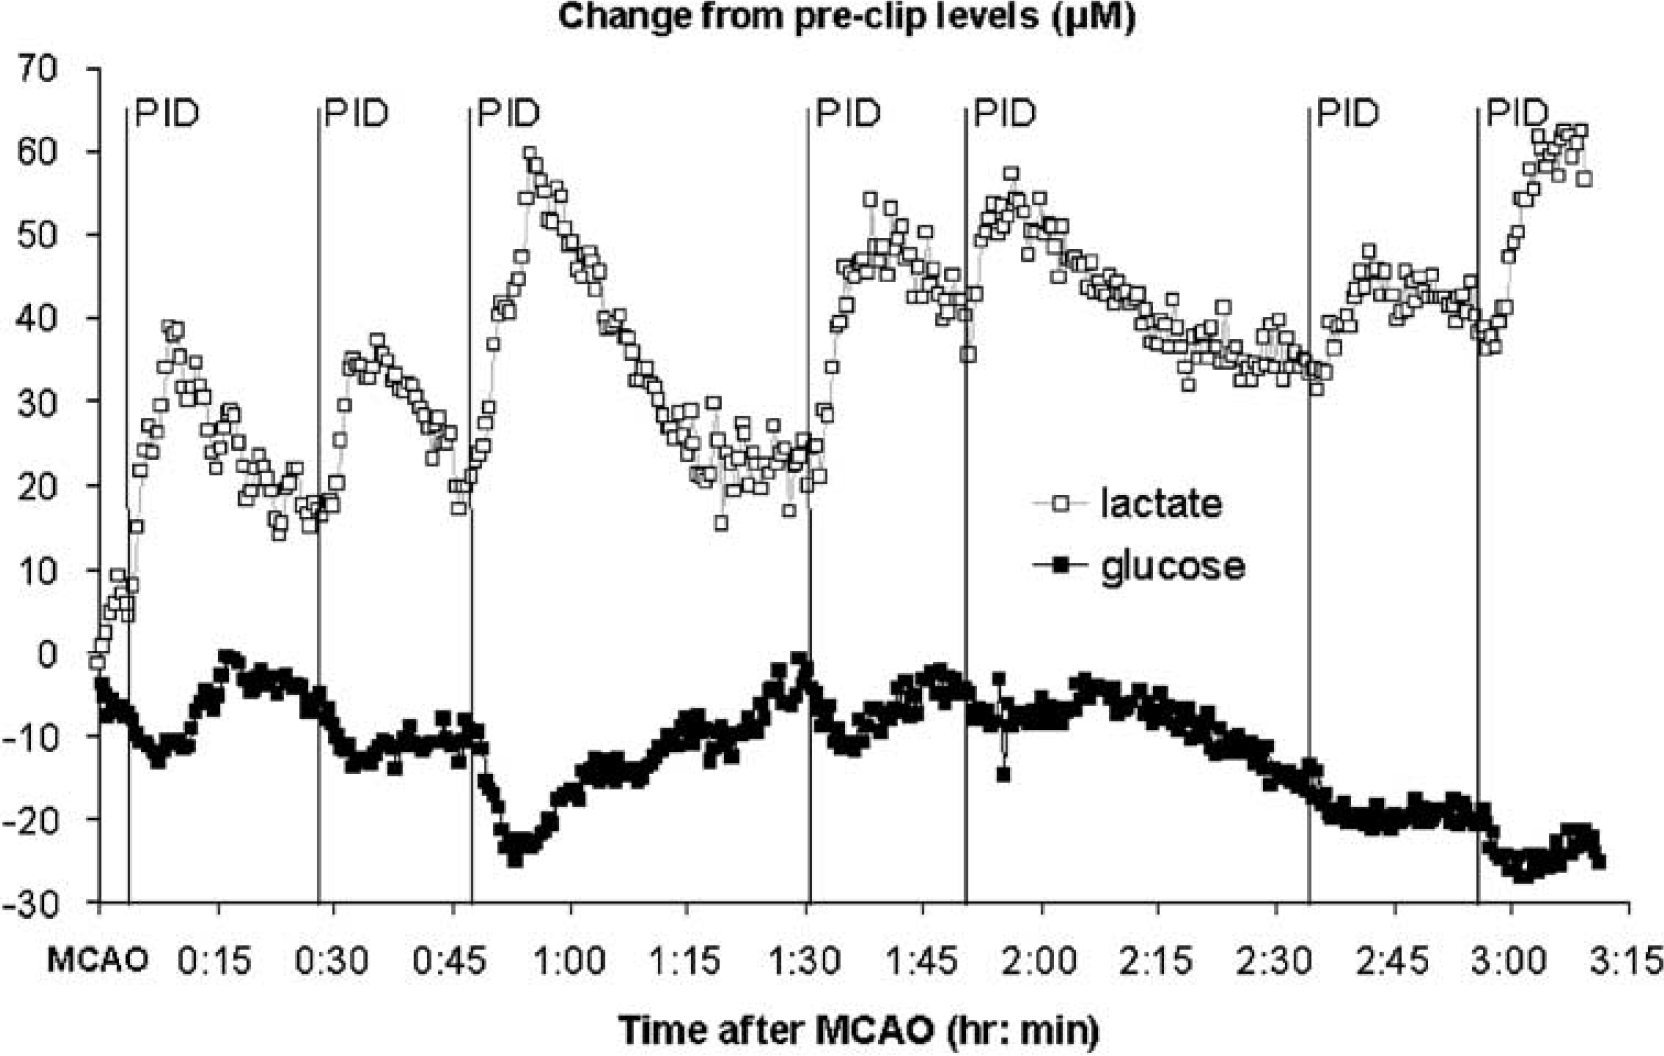
Effects of seven successive events, marked by fluorescence transients, on levels of cortical lactate and glucose in dialysate from the marginal gyrus after middle cerebral artery occlusion. All values (μmol/L) are expressed relative to preclip levels. The fourth peri-infarct depolarisation (PID) is the source of the fluorescence difference images and grey level time series from a region of interest around the probe, which are shown in Figure 2B, 2C.
Discussion
The phenomenon of CSD initially described by Leão (1944) is characterized by a slow, self-propagating wave of cortical tissue depolarization, which results in a transient suppression of electrical activity. Although CSD occurs variably in normoxic, healthy brain in response to stimuli such as electrical stimulation, superfusion with potassium chloride or needling the cortex, it is more readily provoked or occurs spontaneously in damaged or hypoperfused tissue (Somjen, 2001). Indeed, using electrocorticography in neurointensive care patients, we have recently shown with the first unequivocal electrophysiological data that CSD or CSD-like events occur spontaneously, and propagate, in injured human neocortex (Strong et al, 2002). It seems clear from experimental work that PIDs increase damage in the peri-infarct zone (Takano et al, 1996; Busch et al, 1996; Back et al, 1996), and do so incrementally (because infarct size is proportional to the number of PIDs; Mies et al, 1993).
The mechanism of this dependence of penumbral recruitment on PID burden remains unclear, and in this paper, we have examined the role of the availability of energy substrate in the process. In general terms, excessive metabolic demand (arising from the recurrent need to repolarise membranes) in the context of compromised vasoreactivity appears to contribute (Strong et al, 1988; Hossmann, 1996). It is therefore important to understand the metabolic features and consequences of PIDs, and to apply this knowledge and, where appropriate, the technology that underpins it, in the study and management of acute injury to the human brain. Nedergaard and Astrup (1986) drew attention to the likelihood of extreme glycopenia developing in the ischaemic penumbra, and we had recently found serendipitously that only a mild reduction in plasma glucose might be required to elicit an increase in PID frequency (Strong et al, 2000). Under these particular conditions, the possibility of a vicious circle would arise, in which PIDs deplete the residual tissue glucose pool, hence increasing the probability of further PIDs.
Thus, the aims of these experiments, studying permanent MCAO for 3 h, were to (1) examine the dynamics of tissue glucose and lactate in the ischaemic penumbra, with particular reference to the occurrence of PIDs, (2) to confirm prospectively an inverse relationship between PID rate and plasma glucose (especially in view of its relevance to current clinical practice), and (3) characterise the metabolic changes using rapid-sampling microdialysis, with a view to possible application of this method in the monitoring and study of patients with acute brain injury.
The results reveal a characteristic pattern of transient glucose depletion and lactate increase associated with a PID—a ‘metabolic signature’—superimposed on gradual depletion of the extracellular glucose pool, and confirm a robust inverse relationship of PID frequency with plasma glucose when this falls below 8.5 mmol/L. The findings also suggest that rapid-sampling microdialysis has potential value for the study and management of acute brain injury in humans. The performance and results of clinical application of this method in conjunction with electrophysiological monitoring are examined in the accompanying paper (Parkin et al, 2005).
Rapid-Sampling Microdialysis
The technology used in this study has been evolved from the dual assay developed and used for rapid-sampling microdialysis in brain injury patients (Jones et al, 2002). Placement of the switching valve close to the head in these experiments allowed us to reduce substantially the length of the connection tubing, thus reducing both lag time from brain to probe and band broadening effects. We have in the past used implantable biosensors (Lowry et al, 1998a, 1998b) to study brain metabolism. These have the advantage of giving a continuous, faster responding output. However, for the experiments described in this paper we decided against using such data partly because, until very recently, there has not been a reliable biosensor for lactate, but mainly because the conditions of the experiments (penumbral tissue challenged by transient depolarisations that may not be compensated by changes in blood flow) could lead to transient changes in local oxygen tension from already reduced levels. For amperometric biosensors using an oxygen-mediated response these are the worst conditions for reliable measurements (Jones et al, 2000).
The requirement for frequent sampling in a flow-injection system for assay of microdialysate necessarily restricts the number of species that can be assayed reliably, and we confined ourselves to two. The aim of these studies clearly specified glucose as the first of these, and since a marker of depolarisation was available from imaging, lactate was selected, as a second metabolite associated with glucose metabolism, in preference to a chemical marker of depolarisation such as glutamate or potassium.
Selection of the Marginal Gyrus for Probe Location
Initial experience with the cat MCAO model of stroke indicated that in the majority of experiments the suprasylvian gyrus lies within the core from an early stage (Strong et al, 1983). This was confirmed in a pilot experiment for this series, in which microdialysate glucose concentration fell over some 5 mins to unrecordable levels soon after MCAO. We therefore opted to locate the probe in the MG, which is known to lie within penumbra (Strong et al, 1983). There is evidence for diminished vasoreactivity on this gyrus (Strong et al, 1988), and for an appreciable incidence of PIDs there (Strong et al, 1996).
Progressive Deterioration in the Penumbra: Does Reduced Plasma Glucose Contribute?
This paper provides clear evidence, in this case in the metabolic domain, for the concept of progressive maturation or deterioration in the penumbra over time. As recent examples from the laboratory, Heiss et al (1994) noted deterioration in PET-derived variables over some 24 h after MCAO in cats; the same group also reported the occurrence of terminal depolarisation in the MG after 4.5 to 14 h in the same type of experiment (Saito et al, 1997), and considered that the intracellular Ca2+ transient associated with a PID may contribute to the pathogenic effects of these events (Ohta et al, 2001). In the present study, we noted a progressive decline in microdialysate glucose, while lactate appeared not to increase after the first 20 to 30 mins of ischaemia (Figure 4). It bears emphasis that the decline in dialysate glucose was continuing at the end of our protocol at 3 h after MCAO (Figure 4), showing no sign of stabilising. This is of interest in the light of the discussion earlier in this paper of glucose availability and utilisation in the penumbra. In addition, Vespa et al (2003) have recently reported an association of adverse clinical outcome with depletion in microdialysate glucose in patients with severe head injury. The present data also bear some resemblance to the demonstration by Parkin et al (2005) of progressive decline in microdialysate glucose associated with recurrent depolarisations in patients with head injury. Siemkowicz and Hansen (1978) showed earlier that terminal depolarisation after cardiac arrest can be deferred by preinsult hyperglycaemia and advanced by hypoglycaemia. Viewed together, these reports can be interpreted as suggesting that in marginally ischaemic or injured brain, depletion of the cortical glucose pool and recurrent PIDs constitute a positive feedback loop that accelerates deterioration and hastens the onset of terminal depolarisation (we make the assumption that the cortical astrocyte glycogen pool is fully depleted at an early stage in the process). It would seem that this mechanism of cyclical, PID-related substrate depletion is, at the least, one significant factor contributing to adverse clinical outcome, but may be secondary to progressive loss of perfusion. A clearer understanding is needed of the relationship between occurrence of PIDs and any progressive loss of perfusion that might occur during penumbral recruitment. That dialysate lactate failed to rise progressively after MCAO in these experiments may be because of the progressive decline in glucose, depletion of astrocyte glycogen (Tsacopoulos and Magistretti, 1996), or separate regulation of glucose and lactate (Fray et al, 1996).
The Metabolite (Glucose–Lactate in Microdialysate) Signature of a Peri-Infarct Depolarisation
These experiments have identified a stereotyped pattern of change in microdialysate glucose and lactate that would appear to be characteristic of a PID: there is a transient decrease in glucose, with an essentially simultaneous increase in lactate. These results from the use of rapid sampling microdialysis for glucose and lactate closely resemble those obtained by freeze trapping the cortex at the peak of transient DC-depolarisations in focal ischaemia in rats (Takeda et al, 1993).
Transient glucose depletion would appear to be because of a combination of increased utilization—as demonstrated by Nedergaard and Astrup (1986)—and reduced vascular delivery. The lactate transient may reasonably be attributed to a temporary increase in the rate of glycolysis. The opposite polarity of the glucose and lactate transients eliminates the possibility of a change in microdialysate recovery as an explanation (as artefact) (Parkin et al, 2005). This information therefore provides a potential pattern of change that may be sought in data from patients monitored using the same rsMD technology (Parkin et al, 2005), but it is important to recognise that the mean amplitudes of the transients are some 15 μmol for lactate and 8 to 9 μmol for glucose. Sensitivity of rsMD for detection of PIDs in patients with brain injury will therefore depend on the stability of the ‘resting’ glucose and lactate values in the technically challenging environment of the clinical intensive care unit.
Clinical Implications
The dependence of PID frequency on mean postocclusion plasma glucose demonstrated in the present experiments (Figure 3) is more critical than was suggested in our earlier work (Strong et al, 2000). The present data set indicates that the incidence of PIDs can be expected to begin to rise appreciably when plasma glucose falls below some 7.5 to 8 mmol/L. The higher incidence of PIDs in the new data than in our earlier report (Strong et al, 2000) is most likely because of better detection—a result of improved surgical technique and scrupulous avoidance of subarachnoid haemorrhage, the presence of which greatly reduces 450 nm cortical fluorescence because of quenching by haemoglobin. It is possible that the use of insulin in two experiments to reduce plasma glucose might have exerted a membrane-stabilising effect on the brain, reducing the incidence of PIDs in relation to the prevailing plasma glucose level. However, the 2 data points for these experiments lie within or possibly above the relationship found in the other 15 studies.
In view of the increasing use of insulin in intensive care units to control plasma glucose to a target range of 4 to 6 mmol/L (Van den Berghe et al, 2001), the present results must give rise to some concern that any neurological lesion or deficit may be exacerbated in patients treated according to this practice. The data also suggest that this risk may be greater than was suggested initially (Strong et al, 2000). However, there remains uncertainty as to the cytotoxic potential of PIDs at lower levels of plasma glucose (Gido et al, 1994).
Conclusion
In conclusion, these experiments have confirmed that frequency of spontaneous peri-infarct depolarisations in the ischaemic penumbra is increased when plasma glucose falls, and suggest that progressive reduction in extracellular glucose is a feature of the penumbra. Published studies of microdialysate glucose in patients with acute brain injury indicate that such reduction carries an especially poor prognosis. In addition, rapid sampling microdialysis with assay of glucose and lactate in our model of experimental stroke has identified a typical metabolic signature for a peri-infarct depolarization, which can be applied in analysing the results of application of this method in patients with acute brain injury.
Footnotes
Acknowledgements
The authors thank The Wellcome Trust (salary for SEH), together with the Community Fund, the Golden (now Rosetrees) Charitable Trust, HeadFirst and GlaxoSmithKline for their support for this study. The authors are grateful to Professor Stephanie Amiel for advice on the use of glucose-insulin infusions to lower plasma glucose.