
Abstract
We previously demonstrated that pharmacological inhibition of Na+−K+−Cl− cotransporter isoform 1 (NKCC1) is neuroprotective in in vivo and in vitro ischemic models. In this study, we investigated whether genetic ablation of NKCC1 provides neuroprotection after ischemia. Focal ischemia was induced by 2 hours occlusion of the left middle cerebral artery (MCAO) followed by 10 or 24 hours reperfusion. Two hours MCAO and ten or twenty-four hours reperfusion caused infarction (˜85 mm3) in NKCC1 wild-type (NKCC1+/+) mice. Infarction volume in NKCC1−/− mice was reduced by ˜30% to 46%. Heterozygous mutant (NKCC1+/–) mice showed ˜28% reduction in infarction (P>0.05). Two hours MCAO and twenty-four hours reperfusion led to a significant increase in brain edema in NKCC1+/+ mice. In contrast, NKCC1+/– and NKCC1−/− mice exhibited ˜50% less edema (P<0.05). Moreover, white matter damage was assessed by immunostaining of amyloid precursor protein (APP). An increase in APP was detected in NKCC1+/+ mice after 2 hours MCAO and 10 hours reperfusion. However, NKCC1−/− mice exhibited significantly less APP accumulation (P<0.05). Oxygen-glucose deprivation (OGD) induced ˜67% cell death and a fourfold increase in Na+ accumulation in cultured NKCC1+/+ cortical neurons. OGD-mediated cell death and Na+ influx were significantly reduced in NKCC1−/− neurons (P<0.05). In addition, inhibition of NKCC1 by bumetanide resulted in similar protection in NKCC1+/+ neurons and astrocytes (P<0.05). These results imply that stimulation of NKCC1 activity is important in ischemic neuronal damage.
Introduction
Imbalance of ion homeostasis is a crucial mechanism leading to ischemia-induced cell damage. Na+−K+−Cl− cotransporters are membrane proteins that mediate the electroneutral transportation of 1Na+, 1K+, and 2Cl− into the cell under normal conditions (Russell, 2000). Na+−K+−Cl− cotransporter isoform 1 (NKCC1) is important in the maintenance of intracellular Cl− in neurons and contributes to GABA-mediated depolarization in immature neurons (Alvarez-Leefmans, 2001). We hypothesize that overstimulation of NKCC1 plays a role in ischemic cell damage via increasing Na+, K+, and Cl− influx and disruption of ion homeostasis. Our previous in vitro experiments have shown that inhibition of NKCC1 by its potent inhibitor bumetanide significantly reduces neuronal death in either oxygen-glucose deprivation (OGD)- or glutamate-induced excitotoxity (Beck et al, 2003). NKCC1-mediated Na+ and Cl− influx contributes to acute phase damage in excitotoxicity (Beck et al, 2003). Moreover, pharmacological inhibition of NKCC1 with bumetanide decreases infarction and swelling in rat brains after 2 hours occlusion of the left middle cerebral artery (MCAO) and 24 hours reperfusion (Yan et al, 2001). These pharmacological studies suggest that stimulation of NKCC1 activity is involved in neuronal ischemic damage. In the present study, we further examined the role of NKCC1 in neuronal damage with a transgenic knockout approach.
Disruption of axonal ion homeostasis plays an important role in irreversible injury to white matter. Anoxia and ischemia cause rapid energy depletion, accumulation of intracellular Na+ concentration ([Na+]i) in axoplasma, and swelling as a result of excessive Na+ and Cl− influx (Stys, 1998). To date, the effort to identify the precise routes of abnormal transmembrane Na+ influx has focused on Na+ channels. Na+−K+−Cl− cotransporter isoform 1 is responsible for establishing a high [Cl−]i in the CNS axons and oligodendrocytes (Stys, 1998). However, it is unknown whether NKCC1 contributes to an imbalance of axonal ion homeostasis and white matter damage during ischemia.
In the present study, we used NKCC1 transgenic knockout mice to investigate the role of NKCC1 in ischemic brain damage. We found that ablation of NKCC1 significantly attenuated ischemic damage in both gray and white matter. Both pharmacological inhibition and transgenic knockout of NKCC1 significantly attenuated neuronal Na+ overload and cell death after ischemia.
MATERIALS AND METHODS
Animal Preparation
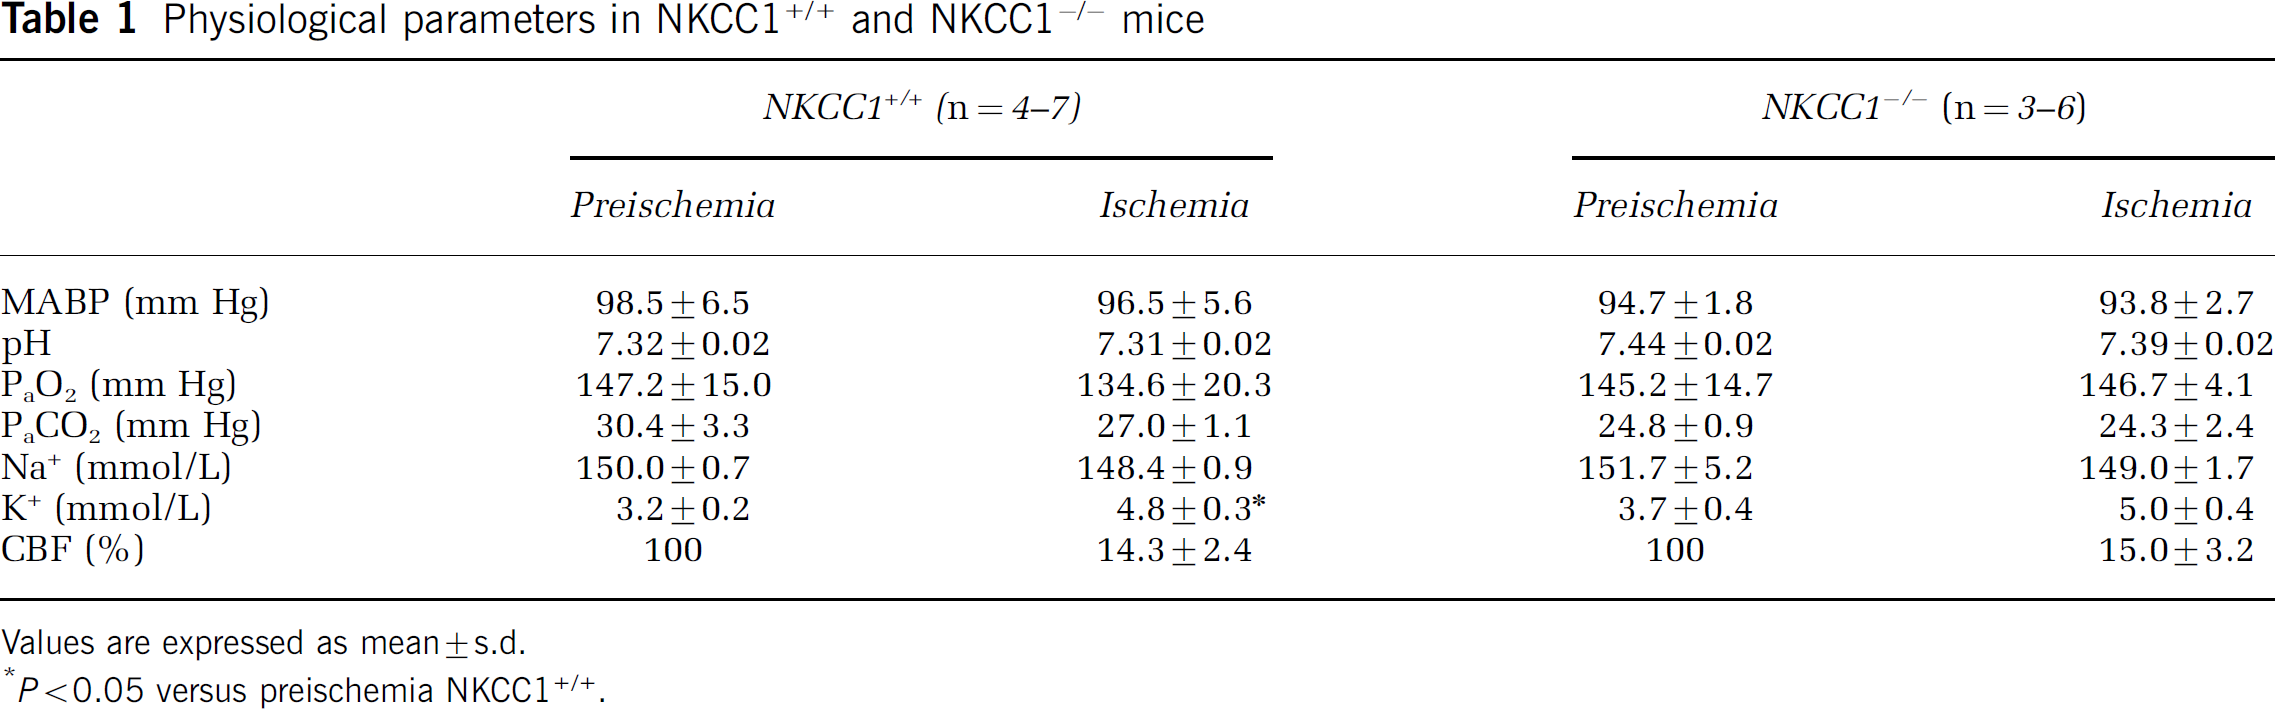
The NKCC1 transgenic mouse (SV129/Black Swiss) was established previously (Flagella et al, 1999). The genotype of each mouse was determined by a polymerase chain reaction (PCR) of DNA from tail biopsies as described before (Flagella et al, 1999). Adult NKCC1+/+, NKCC1+/–, or NKCC1−/− mice (20–25 g) were anesthetized with 5% halothane for induction and 1.0% halothane vaporized in N2O and O2 (3:2) for maintenance. Animals were intubated and mechanically ventilated with a miniventilator (Model 845, Harvard Apparatus, Holliston, MA, USA). The right femoral artery was cannulated for blood pressure monitoring and sampling. Artery blood samples (80 μL) were analyzed for PaO2, PaCO2, pH, Na+, and K+ before and at 1 hour MCAO (i-STAT, East Windsor, NJ, USA). Rectal temperatures were monitored and maintained at 37.0°C ± 0.5°C with a heating blanket and a heating lamp. All the mice underwent 2 hours MCAO and either 10 or 24 hours reperfusion.
Focal Ischemia Model
Focal cerebral ischemia in mice was induced by occlusion of the left middle cerebral artery (MCA) as described by Longa et al (1989). The left common carotid artery was exposed and the occipital artery branches of the external carotid artery (ECA) were isolated and coagulated. After coagulation of the superior thyroid artery, the ECA was dissected distally and coagulated along with the terminal lingual and maxillary artery branches. The internal carotid artery (ICA) was isolated and the extracranial branch of the ICA was then dissected and ligated. The distal 6 mm of a 10-mm-long suture (6–0 monofilament nylon) was coated with polyamide resin glue (McMaster-Carr, Chicago, IL, USA). The diameter of the coated suture was 180 to 200 μm as measured by a microscale (Carl Zeiss, Thornwood, NY, USA). The coated suture was introduced into the ECA lumen through an incision and then gently advanced approximately 9 to 9.5 mm in the ICA lumen to block MCA blood flow. The suture was withdrawn 2 hours after MCAO. The incision was closed and the mice underwent recovery under a heating blanket and heating lamp. After recovery, animals were returned to their cages with free access to food and water.
A total of 92 mice were operated on in this study. Six mice died because of perforation of the intracranial vessels by nylon sutures and were excluded from the study. All animal procedures used in this study were conducted in strict compliance with the NIH Guide for the Care and Use of Laboratory Animals and approved by the University of Wisconsin Center for Health Sciences Research Animal Care Committee.
Regional Cerebral Blood Flow Measurement
Changes in regional cerebral blood flow (CBF) at the surface of the left cortex were recorded using a blood perfusion monitor (Laserflo BMP2, Vasamedics, Eden Prairie, MN, USA) with a fiber optic probe (0.7 mm in diameter). The tip of the probe was fixed with glue on the skull over the core area supplied by MCA (2 mm posterior and 6 mm lateral from the bregma). Changes in regional blood flow after MCAO were expressed as a percentage of the baseline value.
Investigation of Intracranial Vasculature
NKCC1+/+, NKCC1+/–, and NKCC1−/− mice (n = 3 for each genotype) were euthanized with sodium pentobarbital and transcardially perfused with a flush of heparinized saline, followed by 4% paraformaldehyde (PFA) in 0.1 mol/L PBS (pH 7.4). After perfusion, the vasculature was evaluated by quick injection of a 3 mL mixture of gelatin, black ink, and mannitol from the ascending aorta (3.9%:22%:3%, 34°C). The brains were removed and fixed in 4% PFA overnight at 4°C. Cerebral vasculature was observed with a dissecting microscope (OPMI6-S, Zeiss, Oberkochen, Germany) and photographed with a digital camera (Coolpix 950, Nikon, Japan). To further quantitatively examine the vascular structures, the development of the posterior communicating arteries (PComAs) was examined. PComAs connect the carotid and vertebrobasilar arterial systems and its development affects brain sensitivity to ischemia among different mouse strains (Barone et al, 1993). The development of PComAs in both hemispheres was examined independently and graded on a scale of 0 to 3, as reported previously (Majid et al, 2000; Murakami et al, 1997): 0, no connection between anterior and posterior circulation; 1, anastomosis in capillary phase (present but poorly developed); 2, small truncal PComA; 3, truncal PComA.
Infarction Size Measurement
After 10 and 24 hours reperfusion, NKCC1+/+ and NKCC1−/− mice were anesthetized with 5% halothane vaporized in N2O and O2 (3:2) and then decapitated. NKCC1+/– mice were killed at 24 hours reperfusion. Brains were removed and frozen at –80°C for 5 mins. Two-millimeter coronal slices were made with a rodent brain matrix (Ted Pella Inc., Redding, CA, USA). The sections were stained for 20 mins at 37°C with 2% 2,3,5-triphenyltetrazolium chloride monohydrate (TTC, Sigma, St Louis, MO, USA). Infarction volume was calculated with the method reported by Swanson et al (1990) to compensate for brain swelling in the ischemic hemisphere. Briefly, the sections were scanned, and the infarction area in each section was calculated by subtracting the noninfarct area of the ipsilateral side from the area of the contralateral side with NIH image analysis software. Infarction areas on each section were summed and multiplied by section thickness to give the total infarction volume.
Water Content Measurement
NKCC1+/+ (n = 13), NKCC1+/– (n = 6), and NKCC1−/− (n = 6) mice were decapitated under deep anesthesia with 5% halothane vaporized in N2O and O2 (3:2) at 10 or 24 hours reperfusion. The ipsilateral and contralateral hemispheres were dissected and the wet weight of the tissue was measured. The tissue was dried at 120°C for 24 hours. The hemispheric water content was calculated as the difference between wet and dry weights and expressed as a percentage of wet weight.
Gel Electrophoresis and Western Blotting
Mice were anesthetized with 5% halothane vaporized in N2O and O2 (3:2) and decapitated. The cortex, hippocampus, and cerebellum were dissected and cut into small pieces in an isolation buffer containing protease inhibitors as described previously (Sun and Murali, 1999). Tissues were lysed by 30-second sonication at 4°C with an ultrasonic processor (VC 130 PB, Sonic & Materials Inc., Newtown, CT, USA) and cell debris was removed by centrifugation at 420g. Protein content was determined by a bicinchoninic acid method (Smith et al, 1985).
Protein samples (15 μg/lane) and prestained molecular mass markers (Bio-Rad, Hercules, CA, USA) were denatured in sodium dodecyl sulfate (SDS) reducing buffer (1:2 by volume, Bio-Rad) and heated at 37°C for 15 mins before gel electrophoresis. The samples were then electrophoretically separated on 6% SDS gels and the resolved proteins were electrophoretically transferred to a PVDF membrane (0.45 μm, Millipore Corporation, Bedford, MA, USA). The blots were incubated in 7.5% nonfat dry milk in Tris-buffered saline (TBS) overnight at 4°C and then incubated for 3 hours with a primary antibody. The blots were rinsed with TBS and incubated with horseradish peroxidase-conjugated secondary IgG for 1 hour. Bound antibody was visualized using the enhanced chemiluminescence assay (Amersham Corpn, Piscataway, NJ, USA).
Monoclonal T4 antibody against NKCC (1:4,000) and anti-β tubulin (type III) monoclonal antibody (1:2,000, Promega, Madison, WI, USA) were used for detection of NKCC1 and β tubulin, respectively. T4 monoclonal antibody was raised against the human colonic T84 epithelial Na+−K+−Cl− cotransporter (Departmental Studies Hybridoma Bank, Iowa City, IA, USA) (Lytle et al, 1995).
Immunofluorescence Staining
For double staining, brain sections (40 μm) of NKCC1+/+ and NKCC1−/− mice (n = 3 each) were incubated with T4 anti-NKCC monoclonal anti-body (1:100) plus anti-neuron-specific enolase (NSE) polyclonal antibody (1:100; DAKO, Carpiunteria, CA, USA) for 1 hour at 37°C, followed by overnight incubation at 4°C. After rinsing in PBS, slices were incubated with goat anti-mouse fluorescein isothiocyanate-conjugated IgG (1:100; Sigma, St Louis, MO, USA) and goat anti-rabbit Texas Red-X conjugated IgG (1:100; Molecular Probes, Eugene, OR, USA) for 1 hour at 37°C. Fluorescence images were captured by a laser-scanning confocal microscope (BioRad MRC 1024, Hercules, CA, USA). BioRad MRC 1024 laser Sharp software was used to control the microscope and its settings. Identical setting was used to capture the negative control and experimental images.
Immunohistological Staining for APP
NKCC1+/+ and NKCC1−/− mice (n = 3 to 4 for each genotype) underwent 2 hours MCAO and 10 hours reperfusion. They were deeply anesthetized with 5% halothane vaporized in N2O and O2 (3:2) and transcardially perfused with heparin in saline (2 U/mL), followed by 4% PFA in 0.1 mol/L PBS. The brains were postfixed in 4% PFA overnight, and subsequently cryoprotected with 20% sucrose and 30% sucrose overnight. Brains were cut into coronal sections (40 μm) on a freezing microtome (Leica SM 2000R, Leica, Nussloch, Germany). Sections (0.5 mm anterior and 2 mm posterior to the bregma) were selected and processed for immunohistological staining. Coronal sections were rinsed with PBS and treated with 0.3% H2O2 (v/v) in PBS for 10 mins at room temperature to quench endogenous peroxidase. After washing with PBS, sections were incubated with blocking solution (10% normal goat serum, 0.3% Triton X-100 in PBS) for 30 mins at 37°C. The slices were probed with monoclonal antibody against amyloid precursor protein (APP, 1:2,000; Sigma, St Louis, MO, USA) for 30 mins at 37°C, followed by overnight incubation at 4°C. After rinsing, sections were incubated with biotinylated goat anti-mouse IgG (1:200; Vector Labs, Burlingame, CA, USA) for 1 hour at 37°C and avidin-peroxidase (1:100; Vector Labs) for 45 mins at 37°C. Color reaction was developed with a DAB kit (Vector Labs). For negative control, a consecutive section was treated with similar procedures, except that the primary antibody was omitted. To assess APP immunoreactivity, a semiquantitative rating was calculated as described previously (Yam et al, 1997). Briefly, eight coronal sections (from bregma 1.54 to –4.04 mm) were selected. Each section was scored 0 to 3 according to APP accumulation: degree 0, no APP accumulation; 1, some APP staining; 2, a moderate amount of APP staining; 3, a large amount of APP staining (Yam et al, 1997). The total APP score is the sum of the scores from eight coronal sections.
Cortical Neuron and Astrocyte Cultures
Timed-pregnant NKCC1+/– mice were created by pairing male and female NKCC1+/– mice for 48 hours. The mice were then separated. E14 to 16 pregnant mice were anesthetized with 5% halothane and killed. Fetuses were removed and rinsed in cold Hanks balanced salt solution (HBSS). Each mouse fetus was subsequently genotyped. The tails were removed from the fetus and PCR was performed as described previously (Su et al, 2002b).
The cortices were removed and minced as described previously (Beck et al, 2003). The tissues were treated with 0.2 mg/mL trypsin at 37°C for 25 mins. The cell suspension was diluted in Eagle's minimal essential media (EMEM) containing 100 U/mL penicillin, 100 μg/mL streptomycin, 5 mmol/L glutamine, 5% fetal bovine serum, and 5% horse serum. The cortices from individual fetuses were seeded separately in poly-d-lysine-coated 24-well plates and incubated at 37°C in an incubator with 5% CO2 and atmospheric air. After 96 hours in culture, 1 mL of fresh media containing 8 μmol/L cytosine 1-b-d-arabinofuranoside was added. After another 96 hours, half of the media was replaced. After another 72 hours, a third of the media was replaced.
Dissociated cortical astrocyte cultures were established as described before (Su et al, 2002b). Cerebral cortices were removed from 1-day-old NKCC1+/+ or NKCC1−/− mice. The cell suspension was diluted in EMEM containing 100 U/mL penicillin, 100 μg/mL streptomycin, 10 mmol/L glutamine, and 10% fetal bovine serum. In all, 1.0 × 10⁴ live cells/well were seeded on collagen-coated coverslips in six-well plates.
OGD Treatment
DIV 12 to 15 neurons or DIV 14 to 21 astrocytes were rinsed twice with an isotonic OGD solution (pH 7.4) containing (in mmol/L): 0 glucose, 20 NaHCO3, 120 NaCl, 5.36 KCl, 0.33 Na2HPO4, 0.44 KH2PO4, 1.27 CaCl2 and 0.81 MgSO4. Cells were incubated for 1 to 3 hours in the OGD solution in a hypoxic incubator containing 94% N2, 1% O2, and 5% CO2, as described previously (Beck et al, 2003). For reoxygenation, the cells were incubated for 24 hours in 0.5 mL of EMEM containing 5.5 mmol/L glucose at 37°C in an incubator with 5% CO2 and atmospheric air. Alternately, reoxygenation was performed by incubation of coverslips with HEPES-MEM at the microscope stage (Beck et al, 2003). Normoxic control cells were incubated in 5% CO2 and atmospheric air in a buffer identical to the OGD solution except for the addition of 5.5 mmol/L glucose. In the drug treatment studies, cells were pretreated with 5 to 10 μmol/L bumetanide 10 mins before the OGD treatment. Bumetanide was present in all subsequent washes and incubations.
Measurement of Cell Death
Cell viability was assessed by propidium iodide (PI) uptake and retention of calcein using a Nikon TE 300 inverted epifluorescence microscope. Cultured neurons were rinsed with the isotonic control buffer and incubated with 1 μg/mL calcein-AM and 10 μg/mL PI in the same buffer at 37°C for 30 mins. For cell counting, cells were rinsed with the isotonic control buffer and visualized using a × 20 objective lens. Calcein and PI fluorescence was visualized and images were collected as described previously (Beck et al, 2003). In a blind manner, a total of 1,000 cells/condition were counted using MetaMorph image-processing software (Universal Imaging Corp., Downingtown, PA, USA). Cell mortality was expressed as the ratio of PI-positive cells to the sum of calcein-positive and PI-positive cells.
Intracellular Na+ Measurement
[Na+]i was measured with the fluorescent dye SBFI-AM, as described previously (Beck et al, 2003). Cultured neurons or astrocytes grown on coverslips were loaded with 10 μmol/L SBFI-AM in OGD buffer containing 0.05% pluronic acid for 60 to 120 mins during OGD treatment. After OGD, the coverslips were quickly (˜5 mins) placed in an open-bath imaging chamber (Model RC24, Warner Instruments, Hamden, CT, USA) containing HEPES-MEM (components and concentrations as described in Beck et al, 2003) at ambient temperature. To reduce phototoxicity in neurons, the HEPES-MEM was supplemented with antioxidants as described previously (Beck et al, 2003). Using a Nikon TE 300 inverted epifluorescence microscope and a × 40 Super Fluor oil immersion objective lens, neurons or astrocytes were excited every 10 seconds at 345 and 385 nm and the emission fluorescence at 510 nm was recorded. Images were collected and analyzed with the MetaFluor image-processing software (Universal Imaging Corporation, Downingtown, PA, USA) as described previously (Su et al, 2002a). In all, 345/385 ratios were recorded for 1 to 60 mins. In the bumetanide experiments, 5 μmol/L bumetanide was present in all buffers and subsequent washes. At the end of each experiment, absolute [Na+]i was determined for each cell, as described previously (Su et al, 2002a).
Statistical Analysis
Values are presented as mean ± s.d. Comparisons were made between NKCC1+/+, NKCC1+/–, and NKCC1−/− groups by either the nonparametric Mann-Whitney test or ANOVA using the Bonferroni/Dunn post hoc test (SigmaStat, Systat software, Point Richmond, CA, USA). A P-value of less than 0.05 was considered statistically significant.
RESULTS
NKCC1 Protein Expression in Mouse Brains
Genotypes were determined by PCR in DNA samples. As shown in Figure 1A, one DNA band (105 bp) was detected in the tail sample from NKCC1+/+ mice. In NKCC1−/− mice, a 156bp DNA band was detected. Both bands were present in NKCC1+/– samples. Figure 1B shows that NKCC1 protein was expressed in the cortex, hippocampus, and cerebellum of NKCC1+/+ mice. Na+−K+−Cl− cotransporter isoform 1 protein was absent in NKCC1−/− mice. βIII-tubulin was detected in all tissue samples on the same blot. Thus, the absence of NKCC1 protein signal in NKCC1−/− brains is not a result of insufficient protein loading.
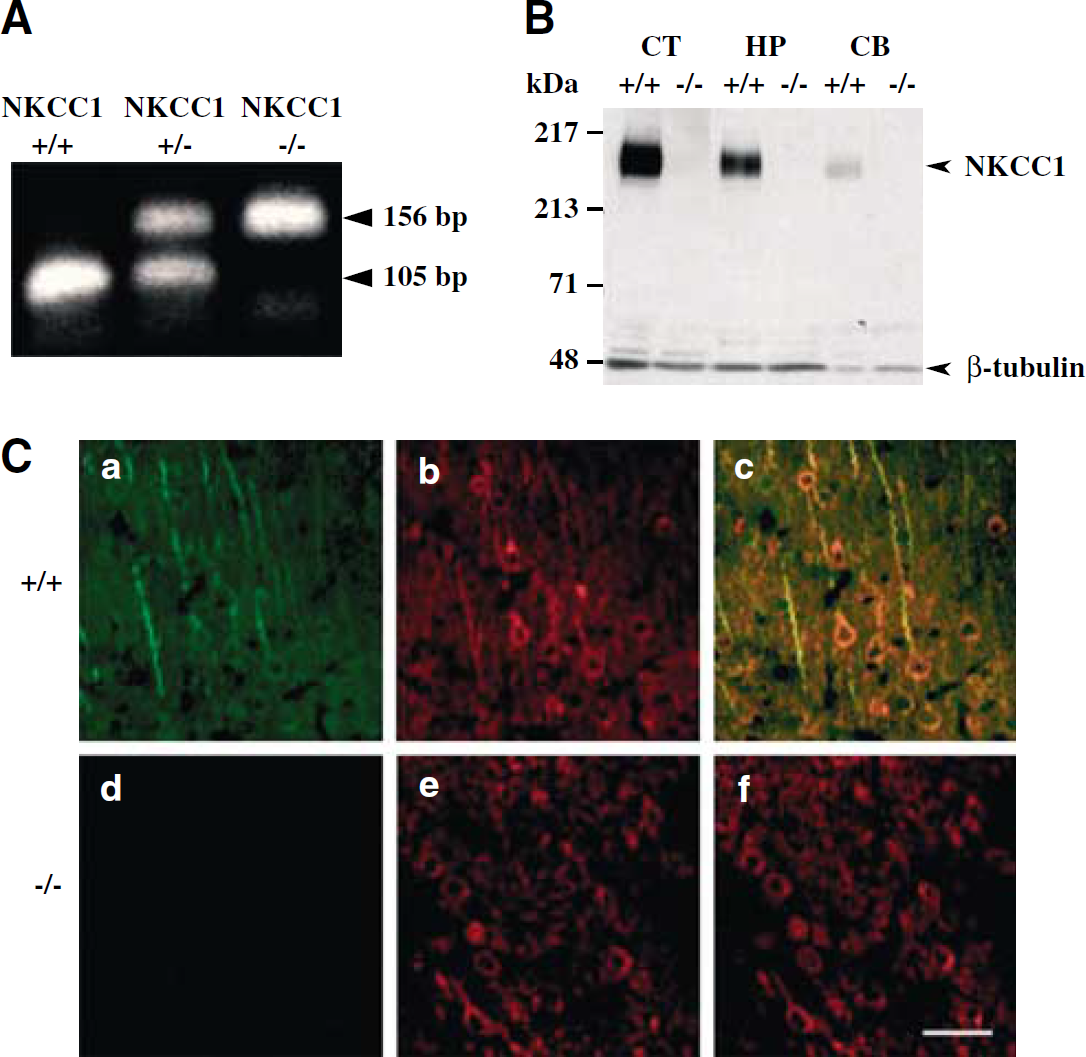
NKCC1 expression in three genotypes of mice. (
To further examine the expression of NKCC1 protein in NKCC1+/+ and NKCC1−/− mice, immunofluorescence double staining was performed. Expression of NKCC1 in cortical neurons was shown in Figure 1C. Neuronal marker NSE was detected in both NKCC1+/+ and NKCC1−/− cortical neurons (Figure 1C, b and e). However, NKCC1 protein expression (soma and axons) was only found in NKCC1+/+ but not in NKCC1−/− cortical neurons (Figure 1C, a and d). Colocalization of neuron marker NSE and NKCC1 were shown in NKCC1+/+ cortex, but not in NKCC1−/− cortical neurons (Figure 1C, c and f). NKCC1+/+ and NKCC1−/− cortical neurons showed similar morphology.
Cerebral Vascular Anatomy in NKCC1+/+, NKCC1+/–, and NKCC1−/− Mice
Because mice with different genotypes were used in the present study, vascular anatomy of NKCC1+/+, NKCC1+/–, and NKCC1−/− brains was evaluated to determine whether there were gross anatomic differences in the cerebral circulation (Figure 2). Black ink injection was used to visualize the vasculature structure of the major blood vessels in the brain. The Circle of Willis was observed in all three genotypes (arrows in Figure 2A). The distribution of MCA trunk and branch appeared to be anatomically identical among the genotypes. As shown in Figure 2B, the mean score of PComAs in both hemispheres was 2.2 ± 0.4 in NKCC1+/+ mice. A score of 2.1 ± 0.2 was found in NKCC1−/− mice. There was no significant difference between the two groups (P>0.05, n = 4, 5). These scores are within the range of normal PComAs development (Murakami et al, 1997).
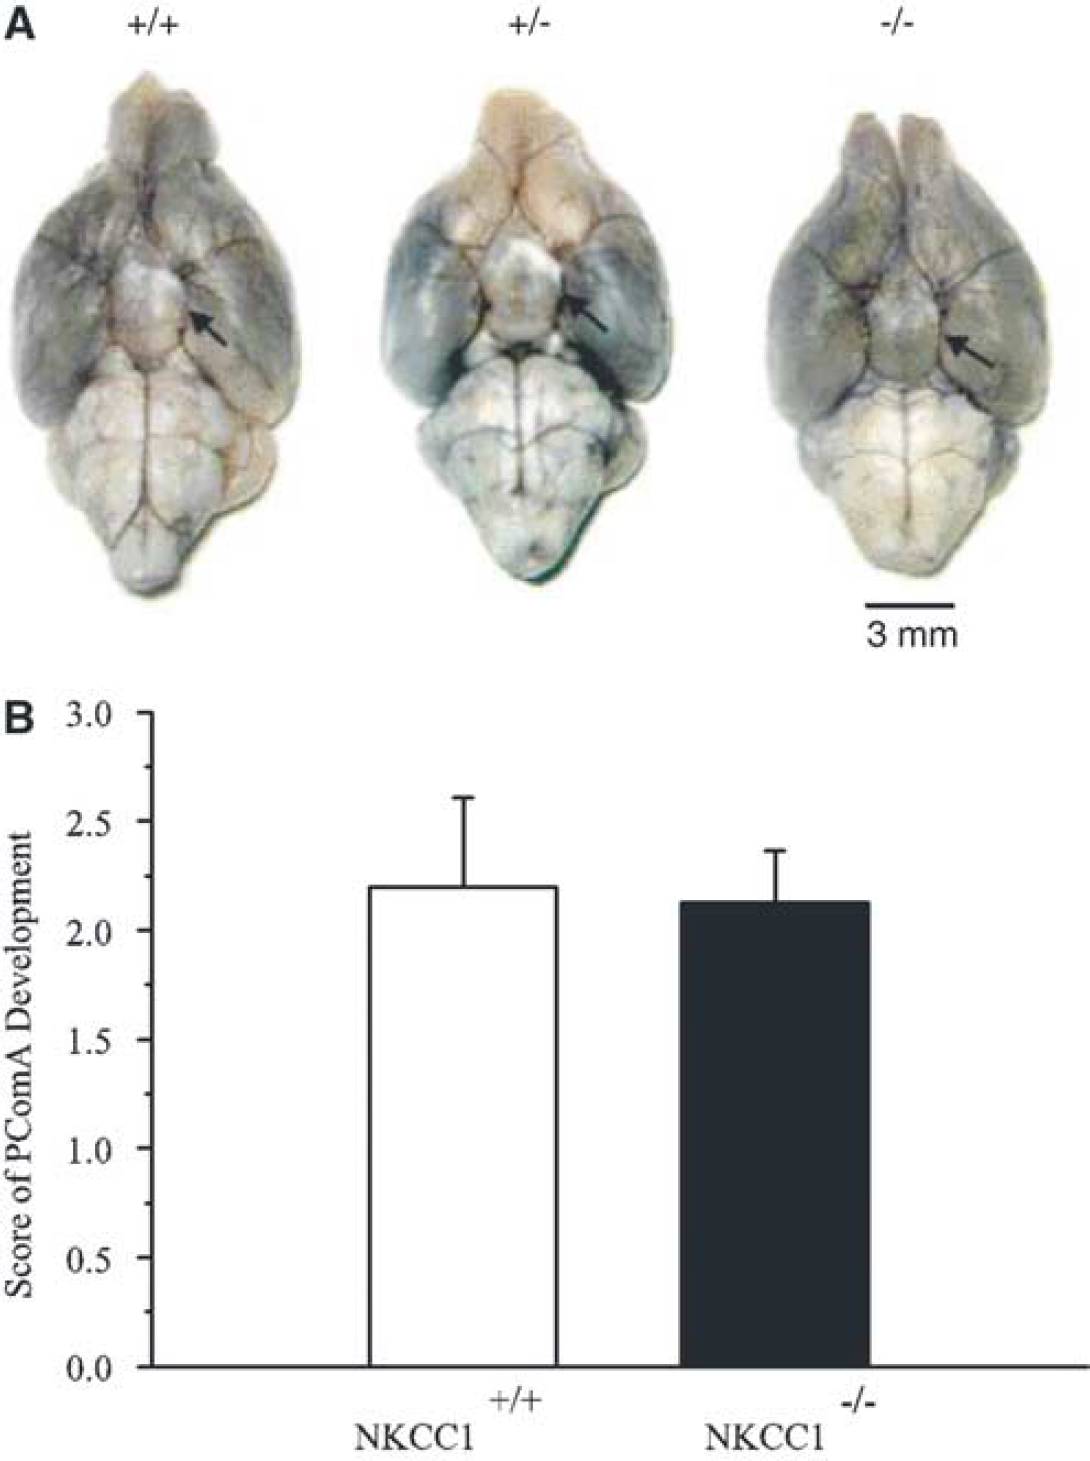
Vascular anatomy of NKCC1+/+, NKCC1+/–, and NKCC1−/− brains. (
No Significant Changes in Physiological Parameters Before and After Ischemia
Mean arterial blood pressure (MABP), pH, PaCO2, PaO2, Na+, and K+ were not significantly different between NKCC1+/+ and NKCC1−/− mice in control conditions (Table 1). There was some degree of hyperventilation in NKCC1+/+ and NKCC1−/− mice. After 2 hours MCAO, the physiological measurements did not change in either NKCC1+/+ or NKCC1−/− mice. Only NKCC1+/+ mice, but not NKCC1−/− mice, showed an ˜8.6% decrease in PaO2 at the end of 2 hours MCAO. This decrease did not reach the statistically significant difference between either preischemic values in NKCC1+/+ mice or one in NKCC1−/− mice (P>0.05). There were no changes in plasma Na+ concentrations in either NKCC1+/+ or NKCC1−/− mice after ischemia. However, in NKCC1+/+ mice, plasma K+ concentrations significantly increased after ischemia (from 3.2 ± 0.2 to 4.8 ± 0.2 mmol/L, P<0.05). In NKCC1−/− mice, plasma K+ concentrations also increased after ischemia, but did not reach statistical significance. This increase may reflect the release of intracellular K+ as a result of surgery-induced tissue damage. The sham-surgery animals also showed an increase in plasma K+ (4.7 mmol/L).
NKCC1+/+ and NKCC1−/− mice showed a similar degree of decrease in regional CBF after MCAO induction (14.3% ± 2.4% versus 15.0% ± 3.2%, n = 6 to 7, Table 1). Cerebral blood flow recovered at 30 mins reperfusion to 90.7% ± 9.3% and 82.7% ± 6.7% of baseline, respectively, in NKCC1+/+ and NKCC1−/− mice. These differences in CBF changes between the NKCC1+/+ and NKCC1−/− mice were not statistically significant (P>0.05).
Decreased Infarct Volume and Brain Edema in NKCC1−/− Mice After Focal Ischemia
To investigate a role of NKCC1 in ischemic gray matter damage, infarction volume was assessed in NKCC1+/+ and NKCC1−/− brain (Figure 3A). The data are summarized in Figure 3B. The average total infarction volume (cortical plus subcortical areas) in NKCC1+/+ mice was 84.3 ± 3.4 mm3 after 2 hours MCAO and 10 hours reperfusion. The predominant lesion was found in a region 4 to 6 mm posterior to the frontal pole where the blood supply is primarily from the middle cerebral artery. In NKCC1−/− mice, the average total infarction volume was 45.3 ± 11.9 mm3 (P<0.05). After 2 hours MCAO and 24 hours reperfusion, the average total infarction volume in NKCC1+/+ mice was 85.5 ± 3.4 mm3. In NKCC1−/− mice, the average total infarction volume was 61.4 ± 2.5 mm3 (P<0.01, Figure 3B).
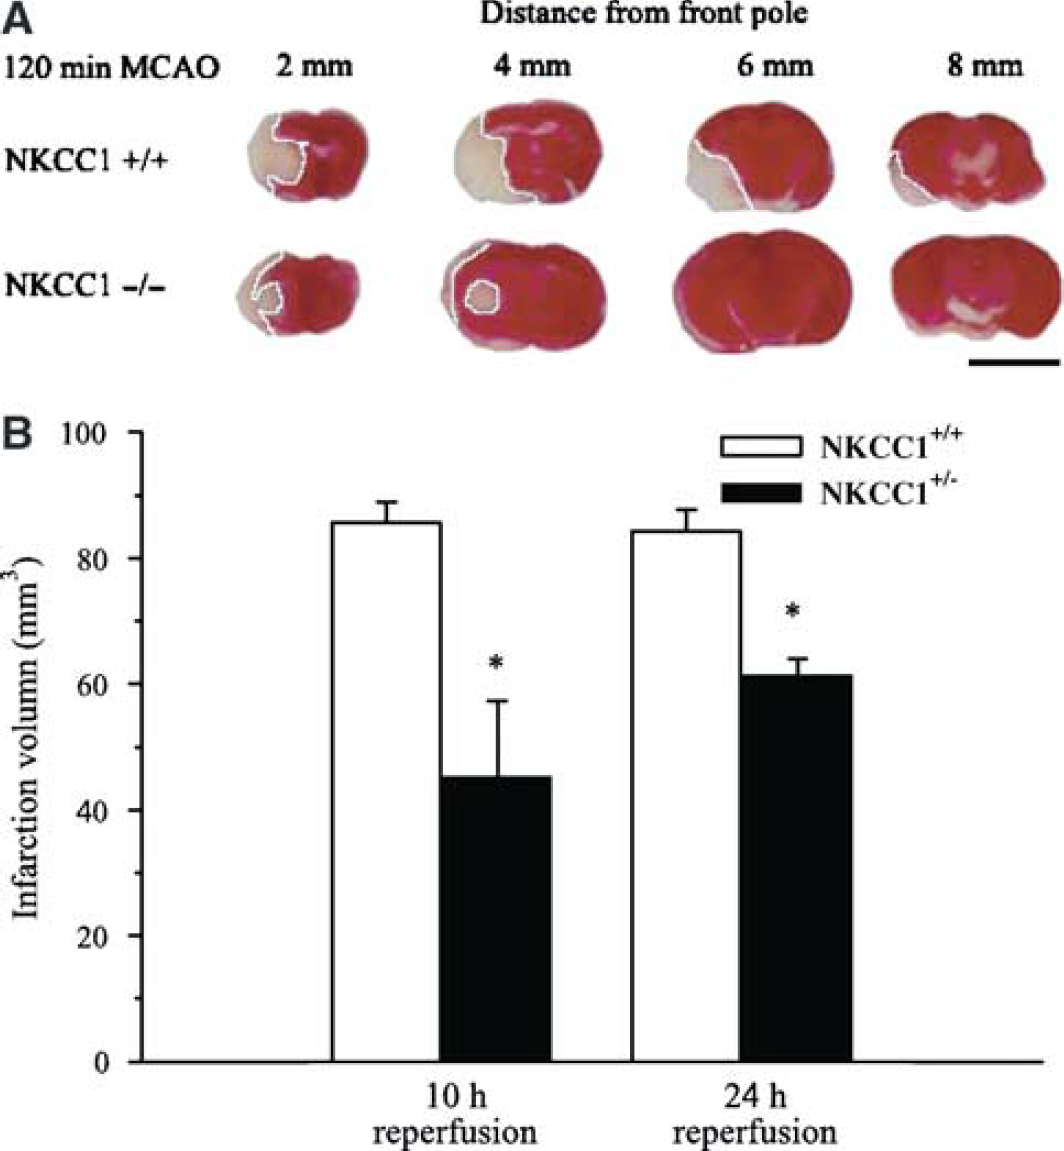
Brain infarction in NKCC1+/+ and NKCC1−/− mice. (
The water content in NKCC1+/+ and NKCC1−/− brains at 10 hours reperfusion is shown in Figure 4. In NKCC1+/+ mice, water content averaged 78.9% ± 0.4% in the contralateral hemispheres. Ischemia led to a significant increase in water content in the ipsilateral hemispheres (81.5% ± 0.4%, P<0.01, Figure 4). In NKCC1−/− mice, water content increase in the ipsilateral hemispheres was significantly less than that in NKCC1+/+ mice (80.4% ± 0.6%, P<0.05). However, it was still significantly higher than that in the contralateral hemisphere of NKCC1−/− mice (78.3% ± 0.5%, P<0.01, Figure 4).
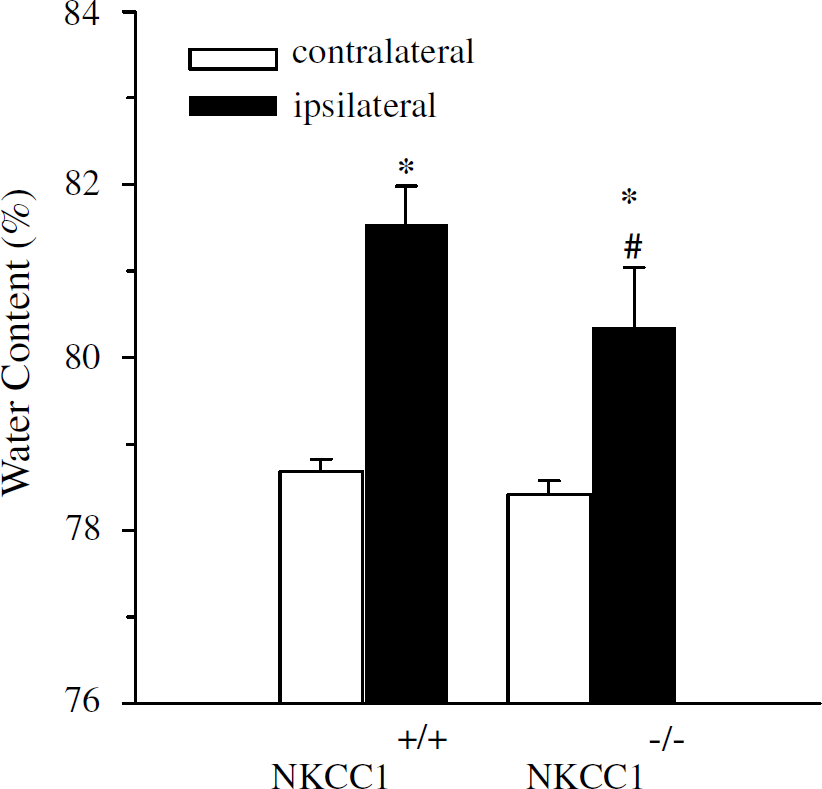
Edema in NKCC1+/+ and NKCC1−/− mice after ischemia. Edema in NKCC1−/− mice was significantly less than in NKCC1+/+ mice after 2 hours MCAO and 10 hours reperfusion. Data are means ± s.d. NKCC1+/+, n = 7; NKCC1−/−, n = 6. *P<0.01 versus NKCC1−/− or NKCC1+/+ mice, contralateral; #P<0.05 versus NKCC1+/+ mice, ipsilateral.
Decreased Infarction Volume and Brain Edema in NKCC1+/– Mice
We next investigated whether some neuronal protection can be observed in NKCC1+/– mice in which NKCC1 expression was reduced. NKCC1+/+ and NKCC1+/– mice underwent 2 hours MCAO and 24 hours reperfusion. As shown in Figures 5A and 5B, the average total infarction volume in NKCC1+/+ mice was 84.7 ± 8.0 mm3. In contrast, in NKCC1+/– mice, the average total infarction volume was reduced to 61.1 ± 11.8 mm3, but did not reach statistically significant differences from the NKCC1+/+ group (P = 0.14). The water content in NKCC1+/+ and NKCC1+/– brains is shown in Figure 6. In NKCC1+/+ mice, water content averaged 78.8% ± 0.3% in the contralateral hemispheres. Ischemia led to a significant increase in water content in the ipsilateral hemispheres in NKCC1+/+ mice (82.7% ± 0.4%, P<0.01). In NKCC1+/– mice, water content increase in the ipsilateral sides was significantly less than that in NKCC1+/+ mice (80.9% ± 0.5%, P<0.01, Figure 6).
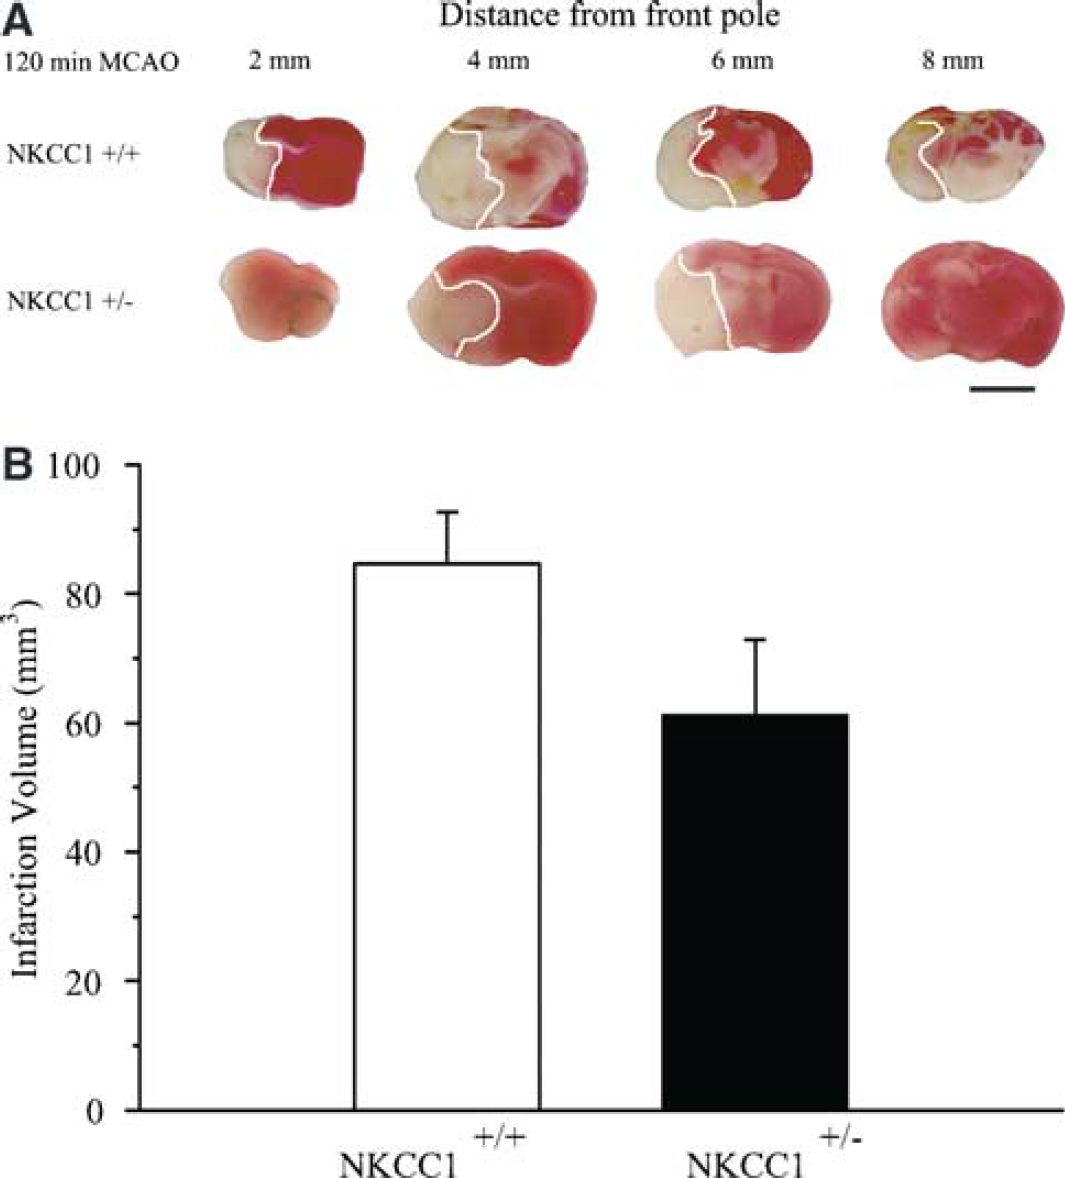
Brain infarction in NKCC1+/– brains. (
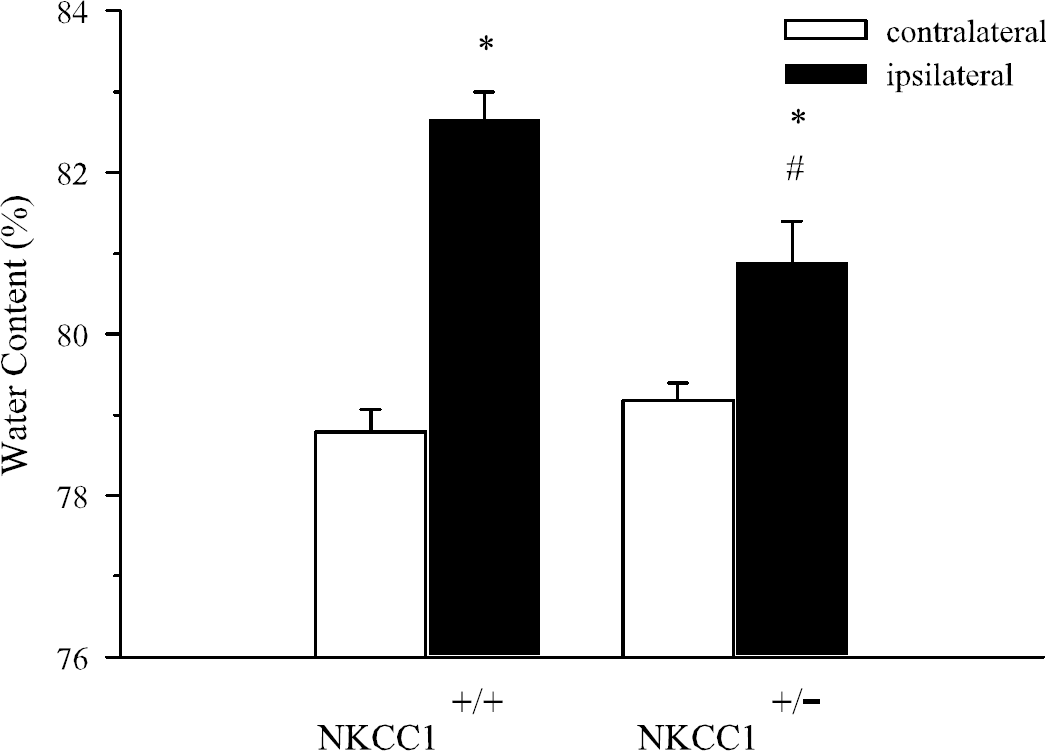
Brain edema in NKCC1+/+ and NKCC1+/– mice. Water content was measured in NKCC1+/+ and NKCC1+/– mice after 2 hours MCAO and 24 hours reperfusion. Data are means ± s.d. n = 6. *P<0.01 versus NKCC1+/+ or NKCC1+/– mice, contralateral; #P<0.01 versus NKCC1+/+ mice, ipsilateral.
Physiological parameters in NKCC1+/+ and NKCC1−/− mice
APP Accumulation After Ischemia
In addition to evaluation of gray matter injury, we also examined white matter damage with APP axonal transport study. As shown in Figure 7A, APP immunoreactivity was detected in the NKCC1+/+ contralateral striatum, mostly located in the perikarya of neurons. Low APP immunoreactivity was found in the white matter of the internal capsule in the contralateral hemisphere of NKCC1+/+ brain (Figure 7B). In NKCC1+/+ brains, after 2 hours MCAO and 10 hours reperfusion, high APP immunoreactivity was detected in ipsilateral subcortical white matter fiber bundles of both the striatum and the internal capsule (arrows, Figures 7C and 7D). Axons stained strongly for APP and had a bulbous or swollen appearance, suggesting the occlusion of APP anterograde flow (Figure 7D). Amyloid precursor protein accumulation was only observed in the border of the core infarction area. No immunoreactivity of APP was found in the infarct core (data not shown). This is consistent with the finding by others (Yam et al, 1997). It is possible that in the severely damaged area, APP synthesis was impaired and APP transport ceased.
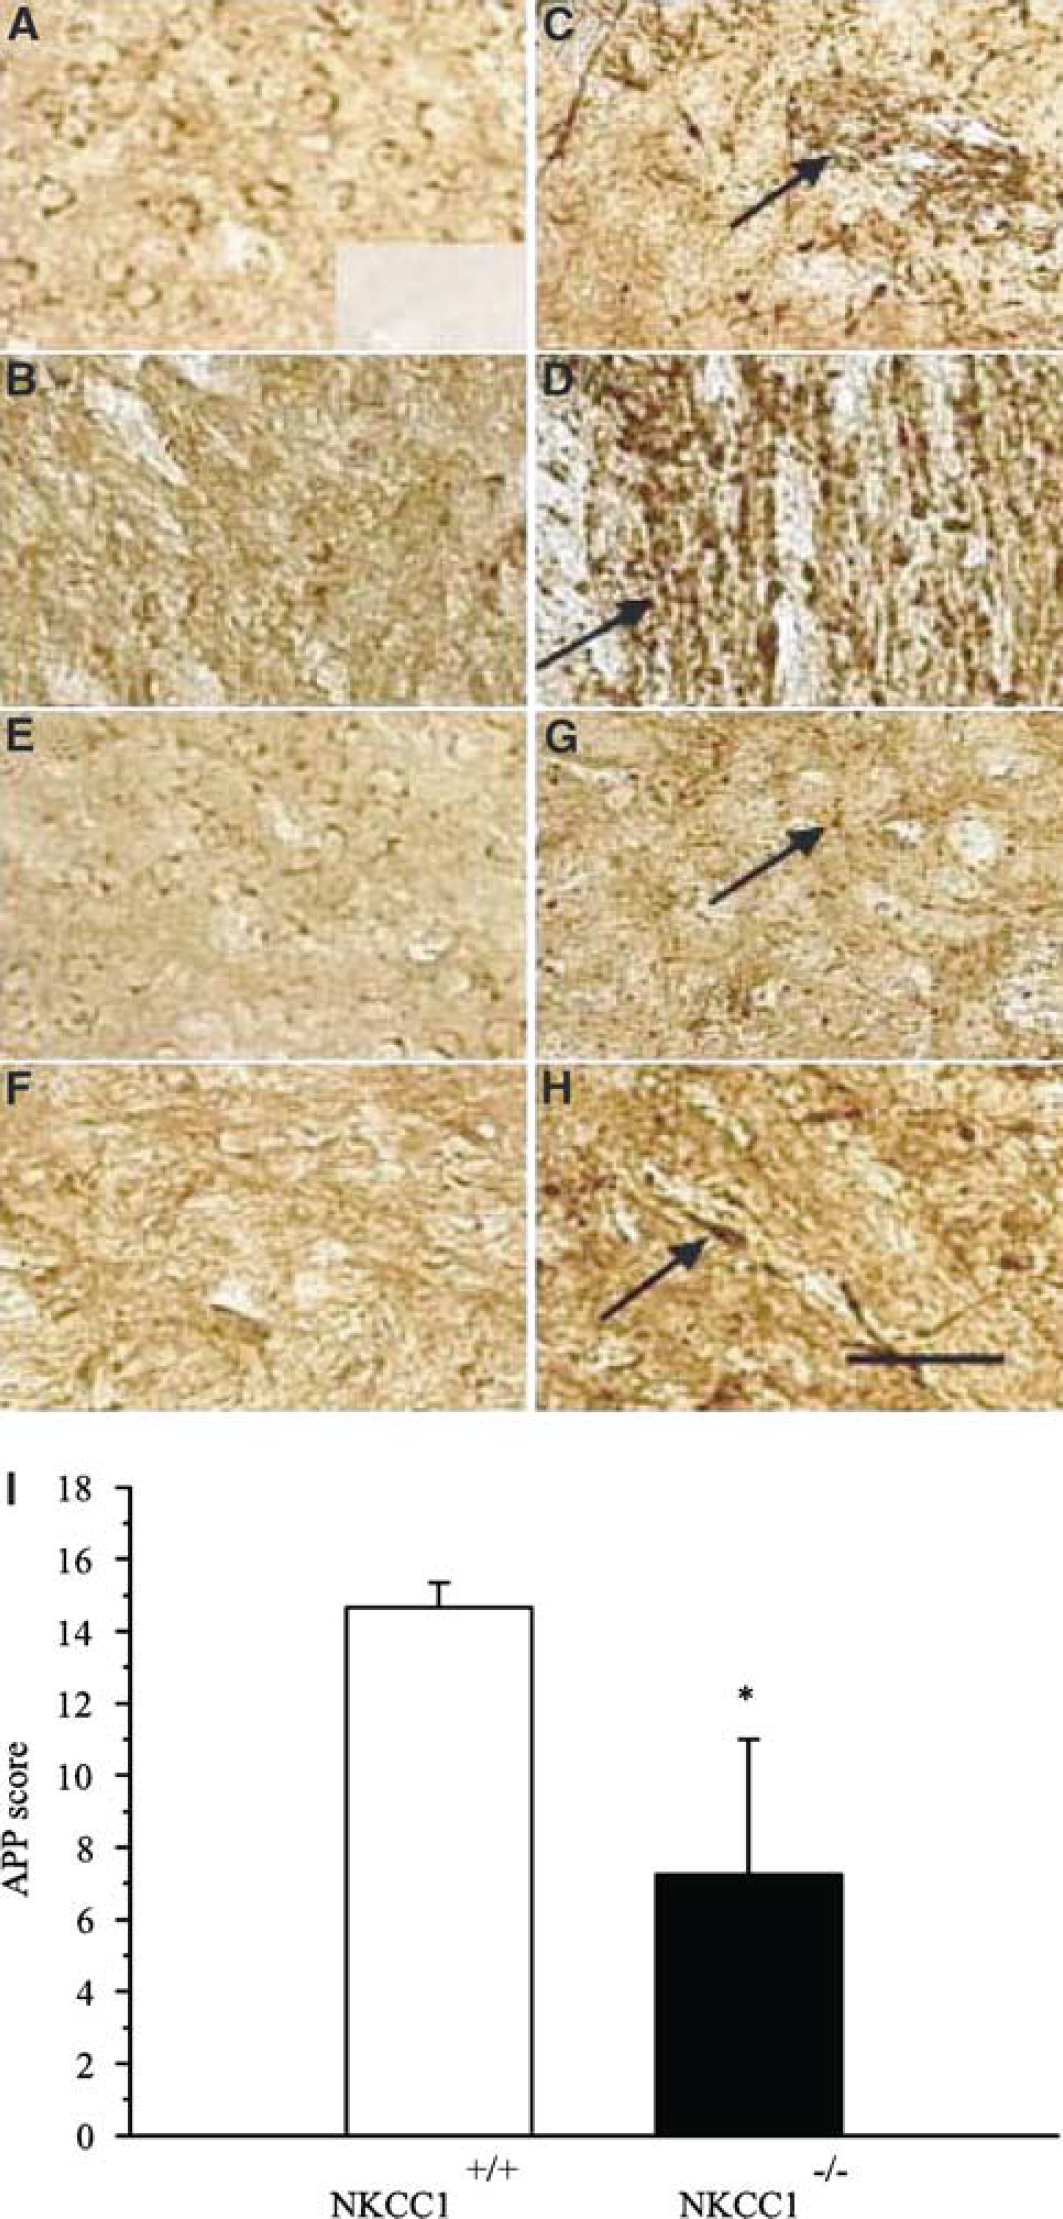
Amyloid precursor protein (APP) accumulation in NKCC1+/+ and NKCC1−/− brains after focal ischemia. (
Low APP immunoreactivity was detected in the striatum and internal capsule of the contralateral hemisphere in NKCC1−/− brains, similar to NKCC1+/+ mice (Figures 7E and 7F). However, after 2 hours MCAO and 10 hours reperfusion, a significantly less amount of APP accumulation was found in ipsilateral fiber bundles of the striatum and internal capsule in NKCC1−/− mice (Figures 7G and 7H). A semiquantitative rating was calculated and the summary data are shown in Figure 7I. The APP score in NKCC1+/+ brains was 15.0 ± 0.6, which was significantly higher than that in NKCC1−/− mice (6.8 ± 3.4, P<0.05).
NKCC1−/− Neurons Exhibit Less Cell Death After OGD
To further establish the role of NKCC1 in ischemic neuronal damage, we determined whether genetic ablation of NKCC1 is also neuroprotective in an in vitro ischemic model. Basal cell death levels under normoxic conditions were not significantly different between NKCC1+/+ (Figures 8A and 8B) and NKCC1−/− cortical neurons (Figure 8, insets in A and B). After 3 hours OGD and 21 hours reoxygenation (REOX), NKCC1+/+ cortical neurons exhibited 67% ± 2% cell death (Figures 8C, 8D, and 8I). Inhibition of NKCC1 activity with 10 μmol/L bumetanide significantly reduced OGD-mediated cell death in NKCC1+/+ neurons (34% ± 2%, P<0.05, Figures 8E, 8F, and 8I). In addition, OGD-mediated cell death was significantly attenuated in NKCC1−/− neurons (30% ± 3%, P<0.05, Figures 8G, 8H, and 8I). NKCC1+/– neurons also exhibited a significant reduction in cell death (42% ± 5%, P<0.05, Figure 8I). However, no additional neuroprotection was found when 10 μmol/L bumetanide was administered in NKCC1−/− neuron cultures (27% ± 3%, P>0.05, Figure 8I). This finding further supports our hypothesis that NKCC1 plays a role in ischemic neuronal damage.
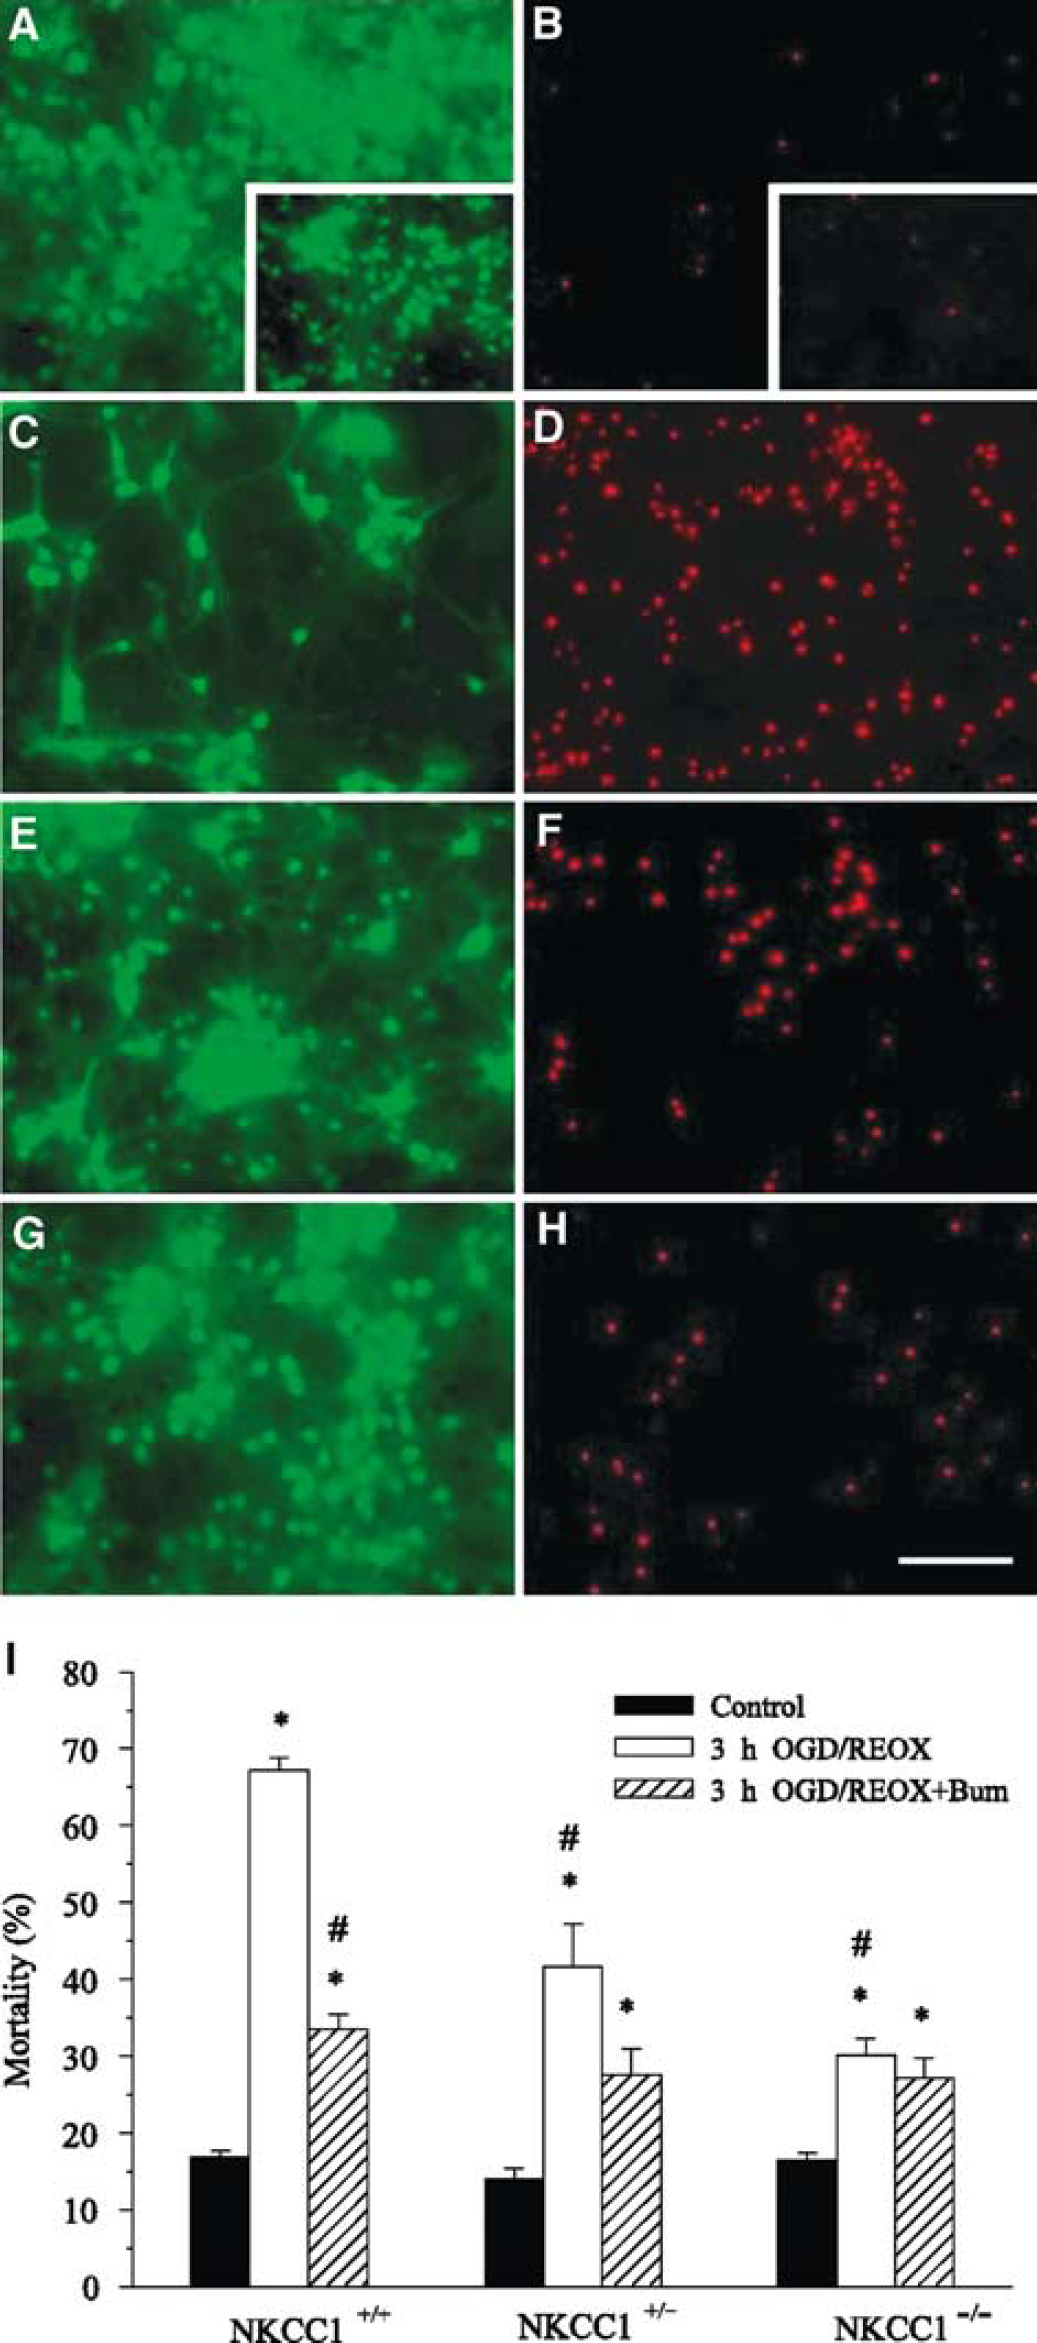
Decreased cell mortality in NKCC1+/– and NKCC1−/− neurons. Cell mortality was assessed in DIV 14 to 15 cortical neurons from NKCC1+/+, NKCC1+/–, and NKCC1−/− mice after 3 hours Oxygen-glucose deprivation (OGD) and 21 hours REOX. For bumetanide treatment, neurons were incubated in EMEM in the presence or absence of 10 μmol/L bumetanide at 37°C for 3 hours OGD and 21 hours REOX. At the end of the experiment, cells were stained with PI and calcein-AM for 30 mins at 37°C and cell images were acquired (see Materials and methods). (
NKCC1−/− Neurons Exhibit Less Na+ Accumulation After OGD
Having established that NKCC1−/− neurons are less susceptible to OGD-mediated death, we investigated whether NKCC1−/− neurons experienced less disruption of ion homeostasis. [Na+]i was measured in NKCC1+/+ and NKCC1−/− neurons after 1 hour OGD and 1 hour REOX. As shown in Figure 9, the basal level of [Na+]i in neurons was not significantly different between genotypes, averaging 6.0 ± 0.3 mmol/L. Oxygen-glucose deprivation led to a significant increase in [Na+]i in NKCC1+/+ neurons (22.0 ± 6.1 mmol/L, P<0.05). Inhibition of NKCC1 activity with bumetanide reduced the OGD-mediated increase in [Na+]i to 15.9 ± 5.2 mmol/L (P<0.05). The increase in [Na+]i in NKCC1−/− neurons was reduced to 14.2 ± 5.0 mmol/L (P<0.05).
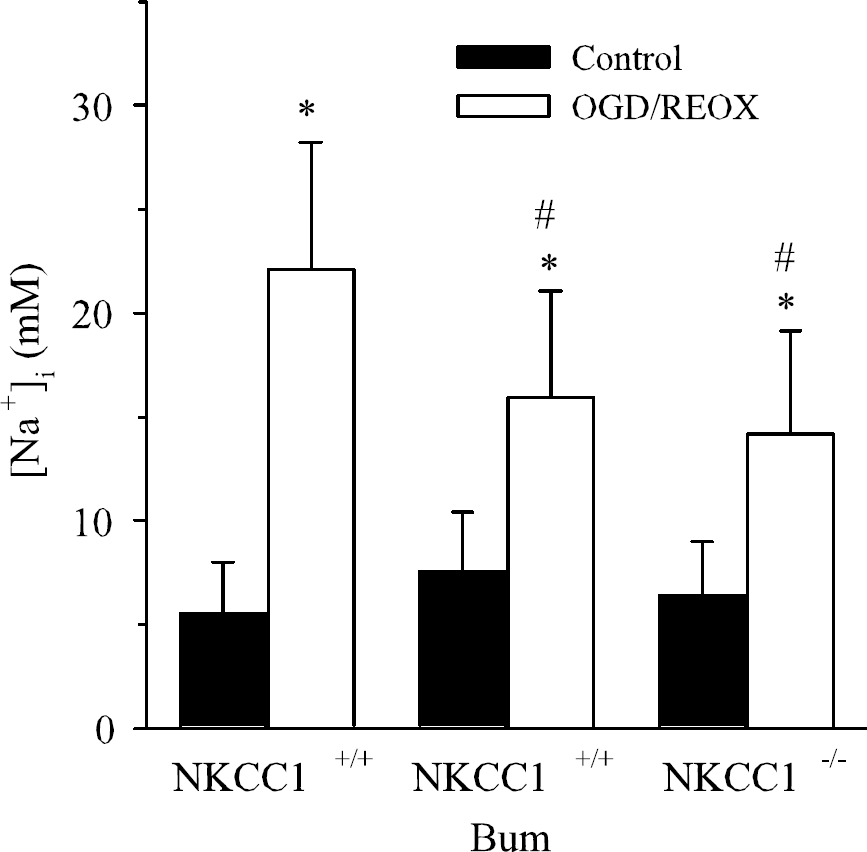
NKCC1 contributes to Na+ accumulation in neurons after oxygen-glucose deprivation (OGD). Neurons (DIV 10 to 12) from NKCC1+/+ and NKCC1−/− mice were exposed to 1 hour OGD and assessed for [Na+]i using SBFI. In bumetanide-treated experiments, bumetanide (5 μmol/L) was present throughout 1 hour OGD and 1 hour REOX. Data are means ± s.d., n = 18 to 36 cells from three cultures. *P<0.001 versus control. #P<0.001 versus NKCC1+/+ OGD.
Inhibition of NKCC1 Activity in Astrocytes Reduces Intracellular Na+ Accumulation After OGD
Na+−K+−Cl− cotransporter isoform 1 plays a role in cell volume regulation and K+ and Na+ uptake in astrocytes. We speculated that neuroprotection observed in NKCC1-null mice in focal ischemia may in part be attributed to inhibition of astrocyte NKCC1 activity. To further investigate this speculation, we examined whether inhibition of NKCC1 with bumetanide blocks Na+ overloading in cultured cortical astrocytes. After 2 hours OGD, we monitored [Na+]i in NKCC1+/+ astrocytes every 2 to 5 mins during 1 hour REOX (Figure 10A). NKCC1+/+ astrocytes subjected to 125 mins normoxia illustrated steady levels of [Na+]i. Two hours OGD plus five mins REOX of NKCC1+/+ astrocytes did not significantly affect [Na+]i (8.0 ± 3.9 versus 10.1 ± 4.3 mmol/L, respectively, Figure 10B). However, ˜10 mins REOX led to a dramatic elevation of [Na+]i in NKCC1+/+ astrocytes (40 to 50 mmol/L, Figure 10A). [Na+]i continued to increase until it reached an average of 79.3 ± 27.5 mmol/L at 60 mins REOX (Figures 10A and 10B). In contrast, when NKCC1 was inhibited with 5 μmol/L bumetanide, the previously shown sudden increase in [Na+]i at ˜10 mins REOX was abolished. [Na+]i only increased moderately at 60 mins REOX in the presence of bumetanide (27.3 ± 7.9 mmol/L, P<0.05, Figure 10B). Similarly, NKCC1−/− astrocytes exhibited a significantly reduced accumulation of [Na+] at 60 mins REOX (38.3 ± 10.2 mmol/L, Figure 10B). These findings imply that NKCC1 activity in astrocytes may also play a role in ischemic brain damage.
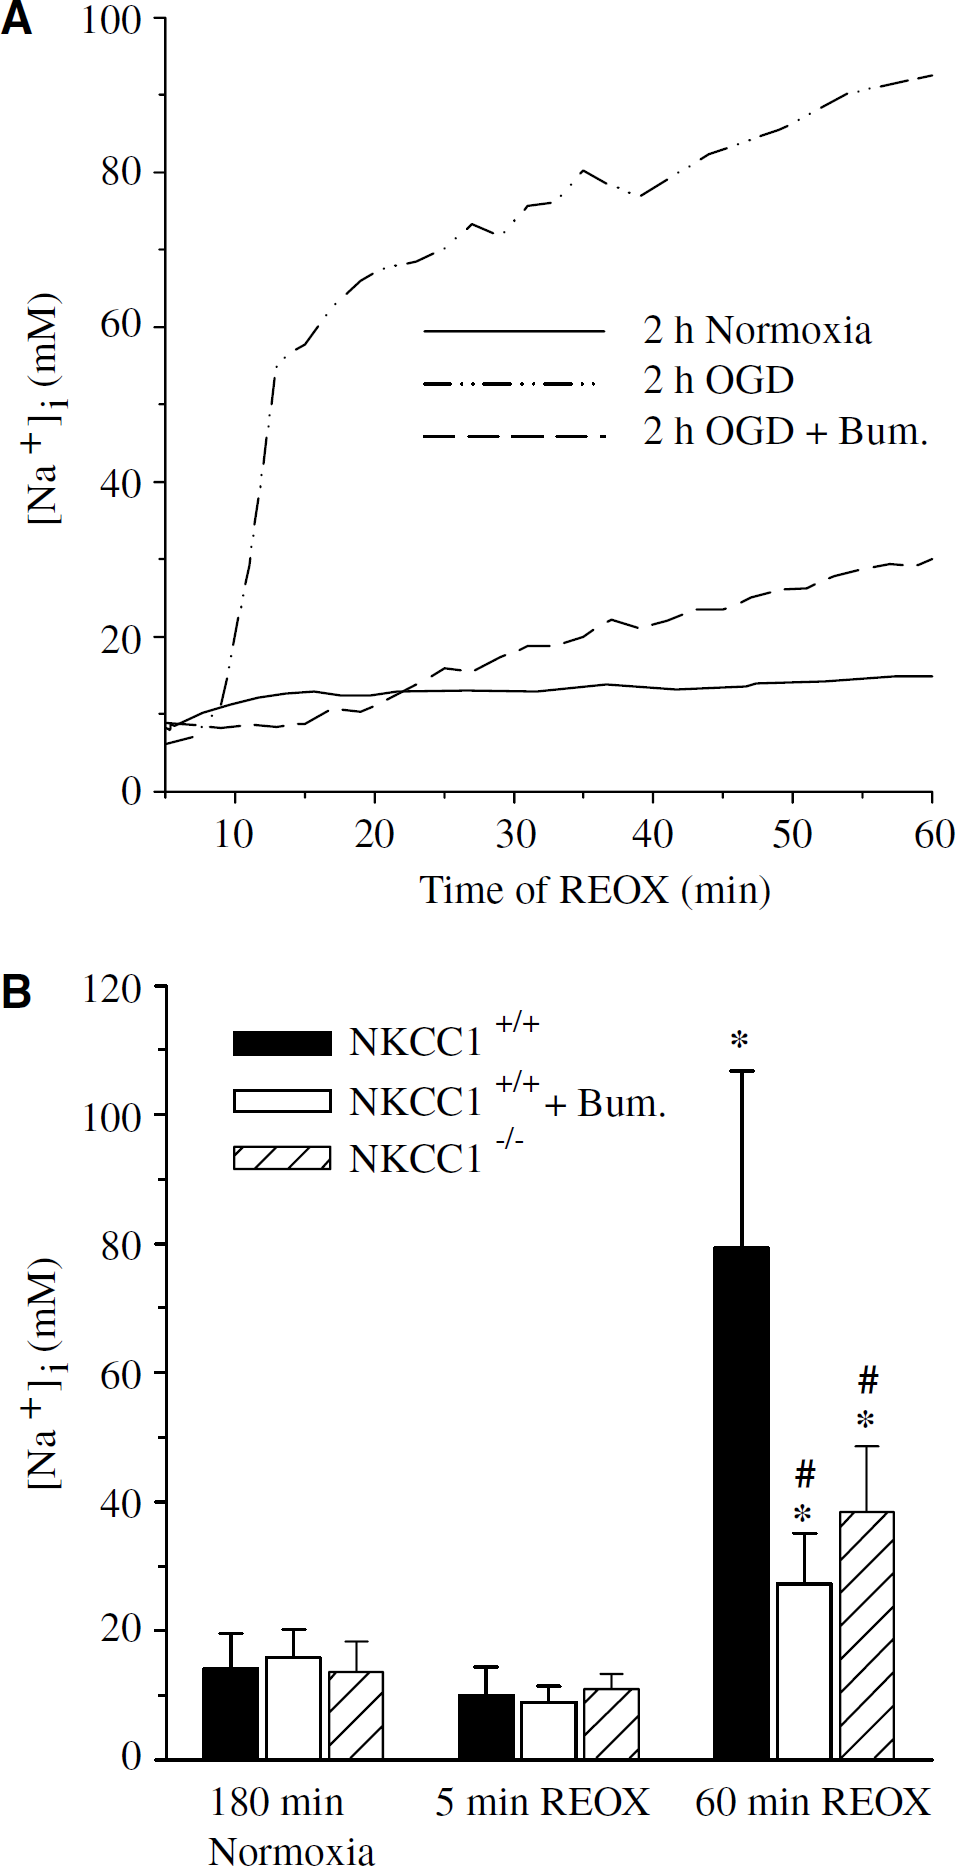
NKCC1-mediated Na+ accumulation in astrocytes after oxygen-glucose deprivation (OGD). Astrocytes (DIV 14 to 21) from NKCC1+/+ or NKCC1−/− mice were exposed to 2 hours OGD and intracellular Na+ concentration ([Na+]i) monitored every 2 to 5 mins during 1 hour REOX. In bumetanide-treated experiments, bumetanide (5 μmol/L) was present throughout OGD and REOX. Data are means ± s.d., n = 60 to 100 cells from 2 to 4 cultures. *P<0.001 versus normoxia. #P<0.001 versus 2 hours OGD plus 60 mins REOX NKCC1+/+.
DISCUSSION
Inhibition of NKCC1 is Neuroprotective in Ischemic Damage
We previously reported that pharmacological inhibition of NKCC1 with bumetanide (100 μmol/L) reduces infarction volume and edema after 2 hours MCAO and 24 hours reperfusion in rat brains (Yan et al, 2001). Cell protection by NKCC1 inhibition with 5 μmol/L bumetanide has also been shown in myocardial ischemic injury of diabetic rats (Ramasamy et al, 2001). However, the pharmacological approach can be criticized because of the lack of inhibitor specificity at high concentrations. Bumetanide is the most widely used drug in NKCC1 inhibition (Haas, 1994). However, bumetanide also blocks the outwardly directed K-Cl cotransporters (IC50 ˜50μmol/L) (Payne, 1997). In addition, it has been reported that 2 mmol/L bumetanide inhibited 54% of the N-methyl-d-aspartate (NMDA)-induced current (Lerma and Martin del Rio, 1992).
In the present study, we further established the role of NKCC1 in cerebral ischemic damage by examining gray matter damage in NKCC1+/+, NKCC1+/–, and NKCC1−/− mice. Genetic ablation of NKCC1 attenuated ischemia-induced infarction volume by ˜45% and reduced edema by ˜30% after focal ischemia (P<0.05). Moreover, a moderate degree of neuroprotection was also detected in NKCC1+/– mice. Although there was ˜45% reduction in edema in NKCC1+/– mice (P<0.05) after focal ischemia, infarction volume decreased by only ˜28%. The latter results imply that activation of NKCC1 contributes to neuronal ischemic damage, not only via edema formation but also via some other signal transduction mechanisms (see the discussion below). Taken together, the results of the current NKCC1 transgenic knockout study firmly establish that both pharmacological inhibition and genetic ablation of NKCC1 activity is neuroprotective in focal ischemic damage.
NKCC1-Mediated Na+ Accumulation and Neuronal Cell Death in Ischemia
We hypothesize that NKCC1-mediated Na+, K+, and Cl− influx may cause disruption of ion homeostasis and subsequent neuronal death after ischemia. In our recent study, we found that NKCC1 mediates Na+ and Cl− accumulations during acute excitotoxicity in rat cortical neurons (Beck et al, 2003). Inhibition of NKCC1 activity by bumetanide significantly reduces Na+ and Cl− accumulations (Beck et al, 2003). In the present study, OGD triggered an approximately fourfold increase in Na+ in NKCC1+/+ neurons. Bumetanide inhibition and genetic ablation of NKCC1 activity resulted in ˜50% less Na+ accumulation during OGD (P<0.05). However, the remaining 50% of Na+ accumulation was not affected by NKCC1 inhibition. This implies that some other Na+ influx pathways (such as voltage-gated Na+ channels, Na+/H+ exchanger, etc.) or a decrease in Na+ extrusion via Na+/K+ ATPase may contribute to Na+ accumulation during ischemia.
Additionally, an ˜7.5-fold increase in Na+ was observed in cortical astrocytes during REOX. Inhibition of NKCC1 activity with bumetanide reduced the Na+ overload by ˜60%. Therefore, NKCC1 activity in both neurons and astrocytes may contribute to perturbation of Na+ ionic homeostasis during cerebral ischemia.
Disruption of Na+ homeostasis plays an important role in ischemic cell damage (Siesjo, 1992; Stys, 2004). A steep inwardly directed Na+ gradient is essential for glutamate re-uptake and regulation of intracellular ion concentrations by other secondary ion transporters (Longuemare et al, 1999; Walz, 1989). Breakdown of the Na+ gradient is one of the key elements in promoting cellular damage. Moreover, Na+ influx may induce cell damage via favoring Ca2+ influx through the reverse action of the Na+/Ca2+ exchanger (Breder et al, 2000; Stys et al, 1992), leading to the Ca2+-mediated cell death cascade. The Na+/Ca2+ exchanger, which normally extrudes one Ca2+ in exchange for three Na+ influx, is electrogenic and transfers one positive charge inside the cell. In addition to the increase in [Na+]i during ischemia, the ischemia-induced depolarization of the plasma membrane may aggravate the reversal of the exchanger because of its electrogenic property (Leppanen and Stys, 1997). Inhibition of the Na+/Ca2+ exchanger has been shown to protect against neuronal ischemic damage (Breder et al, 2000). We recently reported that stimulation of NKCC1 enhances the reverse mode of operation of the Na+/Ca2+ exchanger in astrocytes after OGD (Lenart et al, 2004). Intracellular Ca2+ overload can induce cell death through multiple molecular pathways, including mitochondrial damage, phospholipase A2 activation, stimulation of Ca2+-dependent proteases, NO synthase, and reactive oxygen species formation (Kristian and Siesjo, 1998).
Thermodynamic Analysis of NKCC1-Mediated Ion Transport After Ischemia
Ion transport mediated by NKCC1 is electroneutral in most cases, with a stoichiometry of 1Na+ :1K+ :2Cl− (Russell, 2000). The driving force for NKCC1-mediated ion influx is supplied by the inward Na+ gradient, maintained by Na+/K+-ATPase. An important question to consider is whether the thermodynamics of NKCC1 during ischemia would make ion influx of Na+ possible. We calculated the net free energy (ΔG) for NKCC1 activity, as determined by the concentration gradients of the three ions (Russell, 2000), and investigated whether changes of ΔG during OGD/REOX would allow for NKCC1 to mediate Na+ accumulation. As shown in Table 2, we calculated ΔG for NKCC1 using known concentrations of [Na+]o, [Na+]i, [K+]o, and [Cl−]o and assumed concentrations for [K+]i and [Cl−]i of 111 and 36 mmol/L, respectively (White et al, 1992). Under normoxic control conditions, ΔG was quite negative in both neurons and astrocytes, indicating that net Na+ influx was strongly favored (Table 2). During OGD/REOX, ΔG decreased by 28% in neurons (assuming no changes in [K+]i and [Cl−]i), and the net direction of Na+ remained strongly inward (Table 2). In astrocytes after 2 hours OGD and 60 mins REOX, where [Na+]i increased by ˜7.5 times, ΔG decreased by 44%, but remained negative (Table 2). Furthermore, during OGD/REOX, if it is assumed that [K+]i decreased by half and [Cl−]i doubled, there is no effect on the calculated ΔG (data not shown). Taken together, this suggests that NKCC1 activity can be maintained under the ionic environments during ischemia.
Thermodynamic analysis of NKCC1 during OGD/REOX
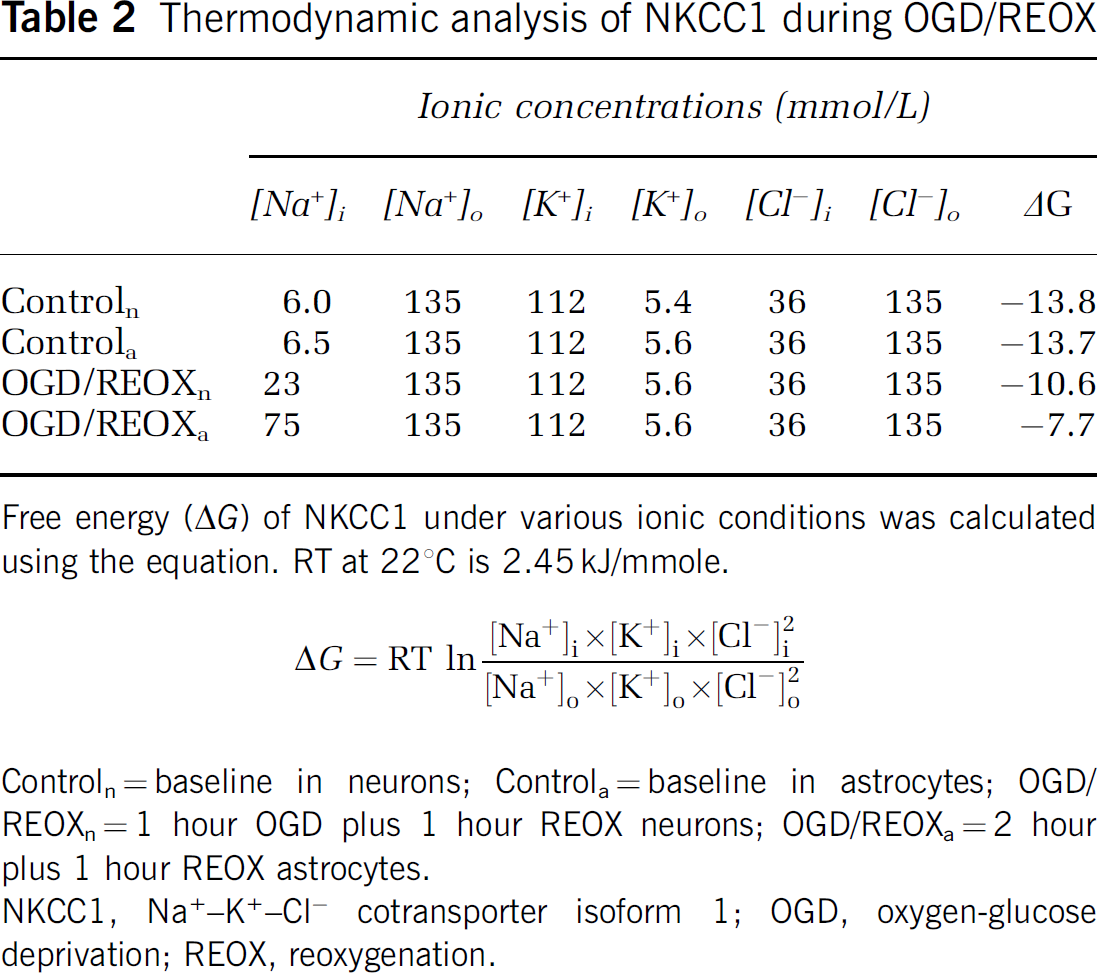
Free energy (ΔG) of NKCC1 under various ionic conditions was calculated using the equation. RT at 221C is 2.45 kJ/mmole.
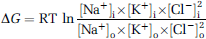
Controln=baseline in neurons; Controla=baseline in astrocytes; OGD/ REOXn=1 hour OGD plus 1 hour REOX neurons; OGD/REOXa=2 hour plus 1 hour REOX astrocytes.
NKCC1, Na+-+-Cl=cotransporter isoform 1; OGD, oxygen-glucose deprivation; REOX, reoxygenation.
Ischemic White Matter Injury and NKCC1
Compared with gray matter, there are fewer white matter injury studies in cerebral ischemic damage. This is partly due to an assumption that white matter is less vulnerable to ischemia and white matter damage is secondary to neuronal damage (Marcoux et al, 1982). Recently, the mechanisms of white matter damage have been explored. Isolated myelinated axonal tracts are susceptible to anoxia-mediated damage (Ransom et al, 1990). Ion homeostasis, especially Na+ and K+, is crucial to normal axon functions. The optic nerve shows an increase in axoplasmaic Na+ from 20 to 100 mmol/L during anoxia (Stys et al, 1997). The importance of Na+ accumulation and subsequently reversal of Na+/Ca2+ exchange in axon anoxia damage is confirmed by electrophysiology studies (Stys et al, 1992; Stys, 1998). Na+ channel blocker (TTX) or Na+/Ca2+ exchanger inhibitor bepridil significantly reduces the anoxia-induced axon damage (Stys et al, 1992; Stys, 1998).
Na+−K+−Cl− cotransporter isoform 1 is expressed in myelinated axons, especially in the paranode area (Alvarez-Leefmans, 2001). NKCC1, together with Na+ and K+ channels, and Na+−K+ ATPase, may play an important role in the regulation of axonal volume and ion homeostasis under physiological conditions. We hypothesized that overstimulation of NKCC1 activity may contribute to axoplasmaic Na+ accumulation and axonal damage during ischemia. Amyloid precursor protein has recently been proposed as a sensitive marker of axonal disruption in white matter during brain ischemia (Yam et al, 1997, 2000). Amyloid precursor protein is transported by fast anterograde axon transport along microtubules. Disruption of this transport as a consequence of cytoskeleton derangement results in APP accumulation, indicating the dysfunction or discontinuity of the axons (Dewar et al, 1999; Koo et al, 1990; Yam et al, 1997). Two to four hours focal ischemia causes cytoskeletal breakdown and disturbance of fast axonal transport in myelinated fiber tracts (Dewar et al, 1999). In our present study, NKCC1+/+ brains exhibited significant accumulation of APP in the ipsilateral internal capsule after focal ischemia. In contrast, APP accumulation was reduced by ˜55% in NKCC1−/− brains. White matter degeneration is often assumed to be secondary to neuronal damage. However, in our experiments, axons were examined for myelin basic protein staining and no changes in myelin basic protein expression were observed after 2 hours MCAO and 24 hours reperfusion (data not shown). This implies that APP accumulation occurs early and is likely a result of primary axonal ischemic damage. Taken together, our results suggest that NKCC1 plays a role not only in gray matter but also in white matter ischemic damage.
In conclusion, the results in both pharmacological inhibition and genetic ablation studies show that NKCC1 plays a role in ischemic cell damage, possibly via disruption of Na+ and Ca2+ homeostasis. Moreover, inhibition of NKCC1 activity reduces both gray and white matter ischemic damage after focal ischemia. Therefore, NKCC1 could be a target for the future development of therapeutic treatment of ischemic cerebral damage.
Footnotes
Acknowledgements
The authors thank Brett Lenart, Joe Beck, and Yiping Yan for their excellent technical assistance.