
The advent of non-invasive imaging methods such as functional magnetic resonance imaging (fMRI) has made it possible to obtain spatial maps of hemodynamic ‘activation’ in the human brain under a variety of conditions. However, the indirect and poorly understood nature of the coupling between these hemodynamic signals and the underlying neuronal activity has greatly limited the interpretability of neuroimaging results. In our laboratory, we address the question of coupling between pre- and post-synaptic neuronal activity, and the hemodynamic response in rodent somatosensory cortex in response to a localized tactile stimulus. We use full-field multiple-wavelength (spectroscopic) optical imaging of the intrinsic signals that enables simultaneous measurements of oxyhemoglobin (HbO), deoxyhemoglobin (Hb) and total hemoglobin (HbT) and simultaneous electrophysiological recordings of spiking and synaptic activity. Our results show that
the hemodynamic response within one cortical column as a function of the stimulus intensity increases beyond saturation of local spiking and synaptic activity. Therefore, a “point” hemodynamic response is a non-linear function of neuronal activity. This disproportional increase in the local hemodynamic response cannot be explained by incresing per-synaptic activity, because inputs from the thalamus (VPM and POm) show saturation with an increase in the stimulus intensity similar to the one demonstrated by the local activity in the cortex. The non-linearity can be explained at least in part by the fact that a point hemodynamic measure is influenced by neuronal activity across multiple cortical columns. HbO and HbT hemodynamic responses can be well approximated by space-time separable functions with an antagonistic center-surround spatial pattern extending over several millimeters. The surround “negative” hemodynamic activity does not correspond to observable changes in neuronal activity (see Figure 1).
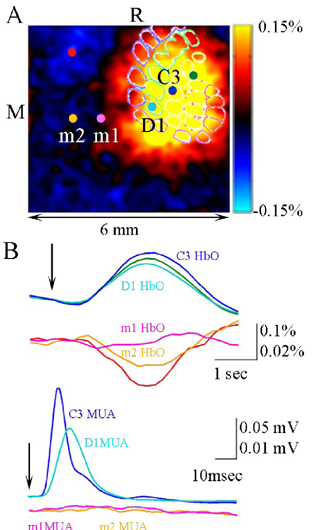
A. A ratio image of HbO at the peak of the response. Electrophysiological recordings were performed at the locations of D1 and C3 barrels inside Barrel field and m1 and m2 outside Barrel field. B. Timecourses of HbO (top) and spiking activity (bottom) from the locations shown in A. The locations are color coded. The vertical scale for the locations outside Barrel field is magnified x5. Arrows denote stimulus delivery. M=medial, R=rostral, MUA=multiple unit activity.
Thus, the hemodynamic response is not just a temporal convolution of the neuronal activation, but is also a spatial convolution. Consequently, attempts at characterizing the neurovascular relationship based on point measurements of electrophysiology and hemodynamics may yield inconsistent results, depending on the spatial extent of neuronal activation. The complex spatial integration of the hemodynamic response should be considered when interpreting fMRI data in terms of neuronal activity.