
Introduction
CBF/CMRO2 may be quantified using PET with 15O-tracers, but the conventional three-step technique (3S) requires a relatively long study period, attributed to need for separate acquisition for 15O2, H215O, and C15O tracers. Simultaneous fitting of dynamic Single-15O2 time activity curve to CBF/CMRO2 in addition to V0 suffers from statistical uncertainty. In this study, we present a novel technique that provides a pixel-by-pixel calculation of CBF/CMRO2 from a single dynamic PET acquisition with a sequential administration of 15O2 and H215O, which may be of use for rapid and accurate assessment in pharmacological and/or cognitive studies.
Methods
A mathematical formula was derived based on a single-tissue compartment model 1 and treating a vascular component as V0, i. e., tissue radioactivity (CPET(t)) can be expressed as CPET(t)=E f Ao*exp(-ft/p)+f Aw*exp(-ft/p)+V0 Ao, where Ao and Aw denote oxygen and water input functions, f is CBF, E is OEF, and p(=0.8 mL/g) is partition coefficient for water. Quantitative images of CBF/CMRO2 were calculated using basis function method (BFM) 2 , in which parameters can be estimated using linear least squares by dealing with non-linear terms by choosing a discrete spectrum for f and forming the corresponding basis function. Experiments were carried out to validate this technique on anaesthetized monkeys (n=6) by comparing the global values of OEF (gOEF) varied by changing PaCO2 to those obtained by simultaneous arterio-sinus blood sampling (gOEFA-V), and on normal young human subjects at rest (n=6) by comparing CBF/CMRO2 values with those by non-linear least square method (NLM). We also performed a simulation study to estimate sensitivities to various error sources.
Results
gOEF agreed with gOEFA-V (y=0. 94x+0.04, P<0.001) in monkey. The regional CBF, OEF and CMRO2 values in cortical regions by the present method were 0.75±0.20 mL/min/g, 0.39±0.03 and 0.053±0.012 mL/min/g and, those from NLM were 0.73±0.19 mL/min/g, 0.40±0.03 and 0.053±0.015 mL/min/g, respectively. No significant difference was found between the two methods. The obtained image quality for CBF, OEF and CMRO2 was reasonably comparable to that of 3S (Fig. 1). The simulation study showed error sensitivity of the present technique to delay or dispersion of the input function, and the error in the partition coefficient was equivalent to that observed for 3S.
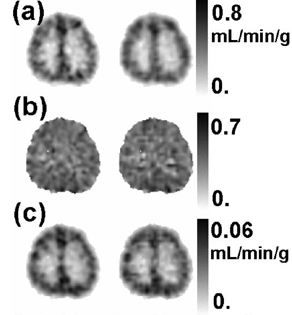
Funtional images of (a) CBF (b) OEF and (c) CMRO2 by 3S1(left) and the present method (right).
Conclusion
These results show that this rapid technique has ability for accurate assessment of CBF/CMRO2 for clinical and research purpose.
Footnotes
Acknowledgements
Grant support: The present work was supported by the Program for Promotion of Fundamental Studies in Health Science of the Organization for Pharmaceuticals.