
Introduction
The benzodiazepine receptor concentration is currently measured with the PET-[11C]flumazenil (FMZ) and the SPECT-[123I]iomazenil (IMZ)1, 2. However, while PET is used for quantitative studies, SPECT is restricted to the use of semi-quantitative approaches which only estimates a receptor density index. Here, benzodiazepine receptors – [123I]iomazenil interactions are studied with SPECT using a dual-ligand approach to estimate all binding parameters.
Methods
SPECT studies were carried out on nine normal volunteers using the following protocol: tracer injection (T0); displacement with unlabelled FMZ injection (T0 + 70 min); co-injection of [123I]IMZ and unlabelled FMZ (T0 + 110 min). At the scan start time, an injection of about 2 mCi of [123I]IMZ was given intravenously. The displacement procedure consisted of 0.02 mg/kg of FMZ, and the co-injection procedure was a mixture of [123I]IMZ (2 mCi) and FMZ (0.02 mg/kg). The three compartment model developed in this study, involves two parts to simulate [123I]IMZ and FMZ kinetics, with distinct K1, k2, kon and koff parameters for each part, and a common parameter: the receptor density, B'max. Because of the large number of parameters, the model was simplified using fixed relations between IMZ and FMZ parameters and a coupled identification procedure. Therefore, only five parameters were identified (B'max, K1, k2, kon/VR, koff) from which the total distribution volume (DVT) was calculated (DVT = K1/k2(1+ B'max/KdVR)). With the first 70 min of the SPECT data, and using a one tissue-compartment model, we estimated K1 and k″2 parameters and calculated an index of receptor density, the total distribution volume (DV″T=K1/k″2). Five regions were used to quantify model parameters (pons, cerebellum, temporal, frontal and occipital cortex).
Results
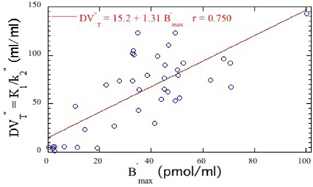
From the nine volunteers, the mean values of receptor density across regions ranged from 7 to 69 pmol/ml and the mean values of ligand affinity from 2. 3 to 3.7 pmol/ml. There was a linear relationship between DVT and DV″T values with a correlation coefficient close to unity. Figure 1 shows a comparison of DV“T values with the corresponding B'max values. In spite of a large variability, there is a high correlation between both parameters.
Conclusion
Using SPECT and the dual-ligand approach all parameters of the model can be quantified with correct standard errors. Despite of the complexity of such approach, it may be use to estimate reference values of biological parameters.
Footnotes
Acknowledgements
Grant support: Swiss National Science Foundation N 31-64020.00 and 3100A0-104185