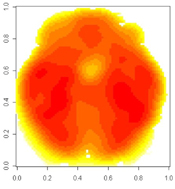
In statistical analysis of brain imaging data comparing groups, one approach is to regard each voxel of an image as a response variable, with diagnostic group and other covariates used as predictors. Alternatively, one could use a within-subject design to examine effects of treatment or changes in clinical state. Commonly, a test statistic is computed for each voxel, and analysis focuses on determining which subset of voxels is “significant”. An alternative approach is to regard two- or three-dimensional images as predictors of binary variables such as treatment response status, suicide attempter status, etc. This functional logistic regression model is an example of “functional data analysis,” which extends more traditional methodology to allow for curves (or, in higher dimensions, images) as either predictors or response variables. We describe an approach to predict any binary response using voxel-based images of outcome measures of estimates of binding. In classical logistic regression, the log-odds of the response variable are modeled as a linear combination of a set of covariates, and its coefficients are estimated. Further inference involves determining which covariates are most important for predicting the outcome. By contrast, in functional logistic regression with an image as a predictor, the log-odds for a subject are modeled as the integrated product of the subject's image and a coefficient image which must be estimated from the data. This image can be interpreted analogously to the coefficient vector in classical logistic regression: Locations at which the image is far from zero indicate the corresponding brain region is important in predicting the response. Since the dimension of the image is much higher than the number of subjects, the coefficient image must be constrained to be smooth in order to fit the model. We accomplish this by first projecting the coefficient image onto a 2-D or 3-D radial B-spline basis, and then applying a functional version of principal components regression to further reduce the dimensionality of the estimated coefficient function. Adequate smoothness of the coefficient image is ensured by imposing a roughness penalty whose magnitude is determined by generalized cross validation. It is straightforward to further extending this general methodology to allow for the addition of a vector of covariates (including relevant genotypes) or a second image. The example coefficient image in Figure 1 was computed for predicting diagnosis using one 2-D slice of BP’ (f1Bmax/KD) in a [11C]McN5652 study of depression. Peaks and valleys in the image indicate brain areas that are particularly useful in prediction of diagnosis. This general procedure has many potential applications in neuroreceptor imaging, including identifying at-risk individuals, treatment planning, and predicting suicide attempts. Once a model has been fit, the probability of the binary outcome may be estimated for any new subjects by applying the model to his/her image.