
Spectral analysis (SA) (Cunningham and Jones, 1993, J. Cereb. Blood Flow Metab, 13: 15–23) has been used to evaluate tracer kinetics in ligand-receptor dynamic PET study. SA is a modeling independent approach that assumes that the impulsive response function for tissue tracer kinetics measured by PET can be expressed as a sum of exponentials of alph*exp(-beta*t), where alph and beta are nonnegative values that can be estimated by basis functions approach with Lawson and Hanson nonnegative least squares (NNLS) algorithm. The basis functions set {exp(−beta*t)} is commonly determined by equally sampling log(beta) in a predefined range (Turkheimer et al., 2003, Phys Med Biol. 48(23): 3819–41). The objective of this study is to develop and evaluate an automatic basis functions selection algorithm for SA.
Methods
SA with a minimal basis functions and NNLS algorithm are used for parameter estimation (SAMBF). SAMBF is implemented as below: Starting with a initial basis functions set {exp(−beta*t)} by sampling log(beta) from 0 to −1 with a given step size delta<0 (−0.02 is used in the study), a forward iteration to expand basis functions set with step size delta is stopped until a criterion of minimizing the residual sum of squares of fitting is satisfied. To evaluate the effects of fixed range of beta on estimates, SA with log(beta) fixed at −2, −3, … −8 is also implemented. For comparison, a 2-tissue 5-parameter (2T5P) (K1, k2, k3, k4, Vp) (BP=k3/k4) compartmental model with the constraint of K1/k2=DV(reference tissue) is used for target tissue modeling. Eight [11C]MDL 100,907 ([11C]MDL) and [11C]McN5652 ([11C]MCN) human dynamic PET studies are used for evaluation. Each PET scan is performed on a GE Advance scanner with 90 min 3D data acquisition. Regions of interest of cerebellum, cingulate, occiptal, orbital frontal, parietal, pre-frontal, superior frontal, and temporal cortices are drawn on the co-registered MRI images, and then applied to dynamic PET images to obtain time activity curves (TACs) for kinetic analysis. Metabolite-corrected plasma TACs is used as input function.
Results
In the following Fig. 1, the log(beta) (mean +/− standard deviation) determined by SAMBF is −4.6 +/− 0.26, for putamen in [11C]MCN study, and −5.5 +/− 0.11 for superior frontal cortex in [11C]MDL study. As log(beta) decreases from −2 to −8, the K1 estimates from conventional SA tend to K1(SAMBF). However, following figure also demonstrates that the DV estimates from SA increases as log(beta) decreases for tissue of slow kinetics. SAMBF and 2T5P provide comparable estimates of K1 and DV for all tissues in both [11C]MCN and [11C]MDL PET studies. In conclusion, spectral analysis with a minimal basis functions approach is simple, robust, and reliable for quantification of ligand-receptor dynamic PET.
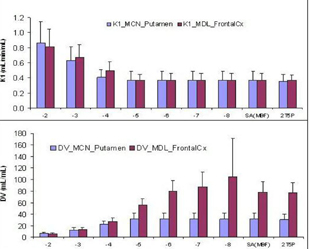
Mean and Standard Deviation of K1 and DV by SA Methods
Footnotes
Acknowledgements
NIH grants AA12839 DA00412 NS38927.