
Background and Purpose
Nowadays dynamic FDOPA-PET imaging is routinely performed for quantitative analysis of physiological activities of brain tissues for Parkinson's disease; however, the significant tissue region boundary is suffered from high noise problem. Thus, a novel feature extraction method based on analyzing kinetic parametric information that obtained from a series of time ranges is presented to exactly extract brain structures from the parametric images.
Method
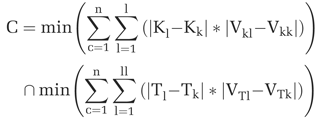
In this study, physiological information, including tissue time-activity curves (TACs) and derived “kinetic parametric curves (KPCs)”, are incorporated to segment desired brain tissues, such as striatum, gray and white matters, from dynamic FDOPA-PET studies. The Patlak graphic method is used to generate kinetic parametric images by integral from different time ranges (0 to 20, 40, 60, 80, 100 and 120 min), respectively. The obtained tissue kinetic factors are estimated based on compartmental modeling analysis, and the plasma curve from human PET study is used as the input function. To classify the brain tissues, the KPCs and TACs data sets of dynamic PET images were clustered using minimum difference (distance) and vector (trend) to clustering centers defined previously by iterative procedure to classify the tissue regions corresponding to similar bio-chemical behavior in this study. The algorithm can be defined as Eq. 1 where Ki and Ti, are the pixel level data, and the VKi and VTi are the vectors of KPCs and TACs, respectively. The subscript “c” added to each notation is denoted as cth clustering center. When the minimum difference and maximum similarity of KPCs and TACs to clustering centers occur simultaneously, the class “C” was determined.
Results
As a result, 10 sets of dynamic FDOPA-PET studies were used to validate the performance of the segmentation method provided in this paper. To estimate the kinetic parametric data by using Patlak graphic method in different time ranges (0 to 20, 40, 60, 80, 100 and 120 min), the data sets of three clustering centers were shown in Figure 1. By clustering the whole image data sets by Eq. 1
and the original image and segmentation results were shown in Figure 2.
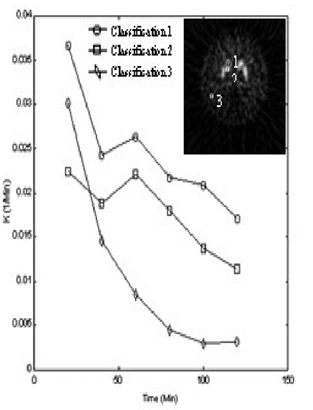
The kinetic parametric factors estimated in different time ranges (1 to 20, 40, 60, 80, 100 and 120 min).
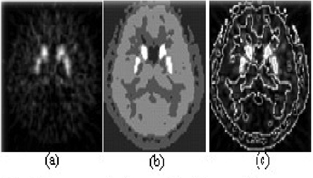
The segmentation results of parametric image. (a) original parametric image, (b) segmentation result, (c) original image added boundary extracted from segmentation imagae.
Conclusion
In this study, the method can effectively extract brain tissues, including striatum, GM and WM in dynamic FDOPA-PET images. Moreover, the segmentation result reveals more complete brain structures extracted from functional images, and the method can also be used as preprocess that is much helpful for structural/ functional image registration.