
Introduction
(R)-[11C] verapamil has been proposed as a PET ligand for measuring P-glycoprotein (P-gp) function in humans 1 . Verapamil can be metabolised through N-demethylation and N-dealkylation. Part of the metabolites probably undergo rapid brain uptake and N-dealkylation metabolites probably also show affinity for P-gp. Compartmental tracer kinetic analysis did not resolve whether the contribution of radioactive metabolites of (R)-[11C] verapamil should be included in the analysis of (R)-[11C] verapamil data. Spectral analysis could reveal the number of compartments contained in the data as well as the limitations to the number of compartments that can be resolved due to the noise in the data. The aim of the present study was to evaluate the contribution of radioactive metabolites to the (R)-[11C]verapamil signal using a multi-input spectral analysis method.
Methods
(R)-[11C]verapamil PET data from ten healthy volunteers was used. An essentially noise-free typical (R)-[11C]verapamil blood curve and time-activity curve (TAC) were calculated based on the mean arterial blood curve, metabolite data and whole brain grey matter TAC of all subjects. Then, 1000 verapamil, N-dealkylation metabolite and N-demethylation metabolite input function sets were simulated with noise based on estimated measurement uncertainty. Simulations were repeated using a mean TAC noise level of 5% as well. These simulated data were used as input for spectral analysis assuming that either only verapamil or verapamil and any combination of metabolites cross the blood-brain barrier. Spectral analysis was applied to both measured and simulated data using 30 basis functions for each input function, with decay constants of the impulse responses varying between 0 and 5 min-1 where 0 min-1 describes irreversible uptake of the tracer.
Results
Figure 1 shows the basis function spectrum for noise-free data and histograms of the selected basis functions for simulated and patient data, as described in the figure caption.
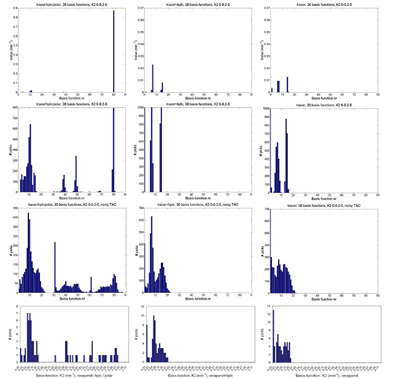
– Spectral analysis results with three separate parents, HPLC and polar fraction input Functions (left), a summed parent + HPLC input (center), and only parent input (right). Top to bottom: spectrum of noise-free data, noise-free TAC with simulated noisy metabolite data, simulated noisy TAC with noisy metabolite data, and data measured in healthy volunteers. The leftmost 30 basis functions are based on input 1, the central 30 on input 2 and the rightmost 30 on input 3.
Conclusion
Although radioactive metabolites may have different kinetics than the parent compound, the different compartments cannot be resolved when metabolite data are included. The uncertainty in parent and N-dealkylation metabolite fractions (as both determined by HPLC) is probably too large to treat these fractions separately, and the similar shape of both metabolite fractions makes them also difficult to separate. Omission of metabolite compartments tends to lead to the selection of an irreversible compartment by spectral analysis. A simplified model assuming that parent and N-dealkylated metabolites have identical kinetics and that uptake of N-demethylation metabolites can be neglected leads to separable compartments even for noisy data.