
Introduction
The concentrations in arterial and venous plasma are different for all compounds. The differences are usually largest during the first minutes after administration. It is therefore not possible to use venous time-activity data instead of arterial time-activity data as input function when modeling transport from blood to different organs in a positron emission tomography (PET) study. However, arterial sampling is more complicated and involves larger risks for the patient than venous sampling. In addition, venous sampling is standard in pharmacokinetic studies. The purpose of the study was to investigate the possibility to construct an input function from venous time-activity data using an arterio-venous transform. If a model between venous and brain concentrations (including an arterio-venous transform) could be established, it would be possible to use such a model for the prediction of brain kinetics based on an arbitrary administration mode by applying this model on venous plasma PK.
Methods
This concept was tested with data from a clinical PET study in which both arterial and venous plasma sampling was done in parallel to PET measurement of brain drug kinetics. The labeled study drug was a cyclogenase-2 (COX2) inhibitor and was administered at tracer doses (<10 ug). The main feature of the method is the inclusion of an arterio-venous transform in the kinetic model. We have studied three different arterio-venous transforms (Tav); a monoexponential function, a biexponential function and a monoexponential function combined with a delta impulse term. Assuming time invariance and linearity, the venous-arterial relationship can be described as Cve=Car * T and Car=Cve * Tav-1, where Cve and Car are concentration in venous and arterial plasma, respectively, * indicates convolution, Tav is the arterio-venous transform and Tav-1 is the inverse of the transform. We then extend the model to include the transport into the brain by adding a second convolution step, i.e. Cbr=Cve * Tav-1* Tbr, where Tbr is a monoexponential or a biexponential impulse response function describing the brain kinetics and Cbr is concentration in brain.
Results and discussion
The model was evaluated according to two different criteria; the difference between the area under the measured curve and the predicted curve (AUCdif) and a run test for randomness of the residuals between predictions and measurements. AUCdif was considerably smaller when the transform was used in combination with a venous input compared to a model based on venous input without transform and comparable to a model based on arterial input. The run test indicated random residuals for the majority of the subjects. It was also shown that three different brain regions with different shaped time-activity curves could be modeled with a common arterio-venous transform together with an individual brain distribution model (See Figure 1).
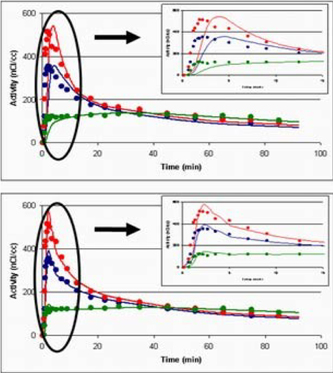
Time-activity curves in striatum (red), lateral temporal lobe (blue) and white matter (green). Open circles are measured concentrations and solid lines are predictions. Upper panel: No arteriovenous concentration transform. The venous concentrations are convolved with a monoexponential impulse response function. Lower Panel: The arterio-venous transform is included in the mode. Omitting the transform resulted in bad predictions, especially of the peak concentrations.