
Introduction
The novel positron emission tomography (PET) tracer [11C]PIB has previously been shown to be a marker of amyloid deposits in brain of Alzheimer's disease (AD) patients 1 . For differential diagnosis of early dementia with imaging techniques, a PET study design which is able to reliable distinguish between amyloid load in normal elderly and in AD is required. Because of the scattered occurance of focal amyloid deposits in AD, exploratory interrogation of parametric images with statistical parametric mapping (SPM) may be more appropriate than an a priori defined region-of-interest based analysis. Here, we report the use of spectral analysis 2 to generate parametric images of [11C]PIB binding.
Methods
After bolus administration of 370 MBq [11C]PIB, 3D PET data were acquired on the ECAT EXACT HR+ scanner. The metabolite corrected arterial plasma input function was generated using an on-line blood detector and 10 discrete arterial samples which were analyzed on an HPLC system. 100 logarithmically spaced basis functions between 0.0008 1/s and 0.1 1/s were used as the functional base. Parametric images of the total volume of distribution (VD) as well as of the impulse response function (IRF) at various time points were generated 3 .
Results
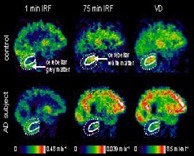
The figure 1 shows sagittal views of parametric images from a control (top row) and an AD subject (bottom row). The IRF image at 1 minute shows predominantly grey matter areas with high values. The AD subject, however, shows globally lower values with association cortical areas in particular being targeted. The IRF image at 75 minutes in the control marks white matter regions with high values, and shows very little retention in the grey matter. In the AD subject, very high IRF 75 min values are obtained throughout the cortex in particular targeting frontal and occipital areas. Cerebellar grey matter showed similar [11C]PIB binidng in AD and controls. The VD images resemble those of the 75 min IRF. However, when normalised to cerebellar grey matter, the contrast of the 75 min IRF image is superior to that of the VD image. In the AD subject the ratios of the frontal over the cerebellar values are 2.3 for the VD and 4.3 for the 75 min IRF, respectively. In the control subject the frontal/cerebellum ratio is 1.1 with either analysis.
Conclusion
Spectral analysis is a powerful tool for the generation of parametric images from [11C]PIB studies. It separates the tissue response function into the early, blood flow dependent signal component and the later signal component indicative of [11C]PIB retention to amyloid plaques. Imaging the IRF at late time produces a higher contrast than the VD image. The use of spectral analysis does, however, require the measurement of the plasma input function.