
Introduction
A new model of murine focal cerebral ischemia whose pathophysiological microcirculatory processes can be chronically and directly investigated in vivo was reported recently 1 . The present study examines the feasibility and interest of the long-term use of a high-spatial-resolution optical method for 2-D CBF measurements. The method is derived from that of Schiszler et al 2 . and was initially developed for acute quantitative measurements in rats 3 . In this presentation, infarct-evolution and/or recovery processes up to 30 days in the same mouse, at the same location were measured repeatedly in vivo using laser-scanning confocal fluorescence dynamic microscopy 1 .
Methods
A closed cranial window was chronically implanted over the left parietal cortex of C57/BL6 mice. Focal ischemia was induced in 8 mice by topical thermocoagulation of two MCA branches through the window 1 , while 5 sham mice were not subjected to ischemia. Rhodamin B isothiocyanate-dextran (MW=71200, 20 mg/ml) was repeatedly injected (<0.01 ml as a bolus) into the tail vein to fluorescently label plasma for each measurement. Rhodamine-dilution images of microvessels in a ROI (1.3 mm × 0.9 mm) at the surface of the ischemic cortex were digitally video-recorded in real-time (25 frames/sec). Images of the same ROI in the same mouse were obtained before, just after, and at 7 and 30 days after arterial occlusion. Sequential frames of Rhodamin-dilution curves over less than 5 sec were analyzed off-line with Matlab software (KEIO-IS) to obtain blood distribution (H) and mean transit time (MTT) 2 , affording a 2-D microflow (1/MTT) map consisting of 2500 flow values (50×50 matrices, spatial resolution = 26 μm × 18 μm) and a histogram of the flow values with 1st, 2nd, 3rd, and 4th moments.
Results
Just after arterial occlusion, mean microflow values decreased from 0. 59±0.09 to 0.47±0.08 (1/sec, p<0.01). At 7 and 30 days after ischemia, the mean values were not significantly different from baseline. The index of heterogeneity was increased from 0.45±0.04 to 0.58±0.12 (p<0.01) by arterial occlusion and then gradually turned to homogeneity (Figure 1). Functional anastomoses and vascular remodeling were evidenced. There were no significant changes of flow velocity in sham mice.
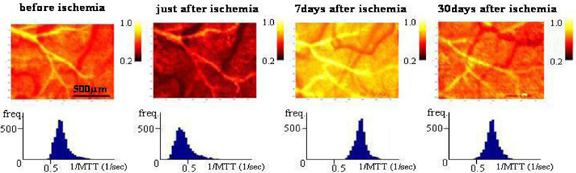
Example of 2-D flow maps during 4 phases. The scale indicates the degree of flow velocity in each matrix. Histograms of each corresponding period are placed below.
Conclusion
The present data show for the first time that quantitative repeated measurements of 2-D microflow in mice can be performed in the long term with high spatial and temporal resolution, through a chronic cranial window, using in vivo confocal dynamic microscopy. Such an approach represents a powerful tool to investigate long-term pathophysiological microcirculatory changes, or to compare microflow changes during cortical activations in the same mouse.