
Increases in neural activity in the brain are followed by increases in cerebral blood flow (CBF), blood volume (CBV) and oxygen metabolism (CMRO2), which can be observed via the BOLD signal. It has been suggested that changes in CBV are slower both at the onset of the stimulus and the return to baseline once the stimulus is off. In addition, when the stimulus is off, there is an uncoupling between CBF and CBV, with the CBF returning to baseline quickly, resulting in the post-stimulus undershoot in the BOLD signal. A recent study showed evidence for sustained increases in CMRO2 after the vascular response had fully recovered to baseline. These data suggest that the post-stimulus undershoot in the BOLD signal should be attributed to oxygen metabolism, and not delayed CBV changes, which were shown to return to baseline quickly. In our study, we investigated the spatial-temporal dynamics of CBV and the BOLD response, using a high spatial resolution cat model at 9.4 T. We used a visual stimulus consisting of binocular high-contrast square-wave moving gratings (0.15 cyc/deg, 2 cyc/s) and a coronal slice perpendicular to area 18 for the functional study. The GE BOLD response and GE CBV-weighted changes, following a bolus injection of MION (10 mg Fe/kg), were both measured. The scan time for 1 image was 4 s and the spatial resolution was 150 × 150 × 2000 μm3. Following the MR session, a 3 mm cortical slab corresponding to the imaged plan was extracted and sectioned with a 15μm slice thickness with a cryostat and was stained with cresyl violet (Nissl) to determine the borders between layers. Functional time courses were generated by selecting ROIs in the tissue (layer IV) area as well as in the surface vessel areas and averaged over all cats. Figure 1 shows the temporal profiles of BOLD and CBV-weighted signals changes as a function of spatial location. The BOLD response showed the post-stimulus undershoot, similarly in both the tissue and large vessel areas, despite a larger positive BOLD signal in the vessel areas. In contrast, CBV temporal profiles were spatially dependent. In the tissue region, a sustained response is observed after the stimulus is off whereas the CBV response in the large vessel areas returns to baseline almost immediately after the stimulus is off. Our findings suggest that in the tissue, the BOLD post-stimulus undershoot must be in part explained by the sustained and elevated CBV response, however, there still may be contributions from elevated CMRO2 levels. In the vessel areas the data suggests that the undershoot must come from either sustained CMRO2 effects in the tissue which drain into the vessels, and/or decreases in CBF (without significant changes in CBV). Changes in CBV, CBF, and CMRO2 may explain the post-stimulus undershoot; however, the contribution of each to the BOLD signal is spatially dependent.
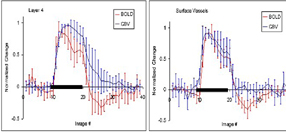
Average time courses of normalized change from 4 cats in layer 4 and surface vessel areas from both GE BOLD and GE CBV weighted MION data. The black box indicates the stimulus.